.png)
Stock’s Details
Scentre Group
Added 279 New Brands to the Portfolio:Scentre Group (ASX: SCG) is a real estate company, specialized in the management and development of the property. The business’s portfolio is located across major cities, with a population forecast to grow by more than 40% by 2050.
FY19 Operational Highlights for the Period ended 31 December 2019:SCG recently declared its full-year results, wherein the company reported revenue of $2,616.4 million, slightly lower from $2,635.1 million in FY18. Funds from operations (FFO) stood at $1,344.6 million, up by 0.4% on y-o-y basis. Operating earnings (OE) came in at $1,287.4 million, while OE per security stood at 24.34 cents. In FY19, customer visits stood at 548 million, up by 12 million from FY18. During the year, the company launched 344 new brands to the portfolio while 279 existing brands grew their store network. The business launched a dining and entertainment precinct at Westfield Mt Druitt, adding 12 new rooftop restaurants and entertainment usages.
.png)
Key FY19 Operational Highlights (Source: Company Reports)
Outlook: As per the FY20 guidance, the company expects operating earnings within the range of 24.75 cents to 24.80 cents per security. Project Income after tax is expected at ~$28 million. The company anticipates FY20 FFO at 25.30 cents per security. As per the FY20 distribution is concerned, the company expects at 23.28 cents per security, an increase of 3% from FY19.
The Board of directors has declared an unfranked dividend of $0.11300 per ordinary share with a payment date of 28 February 2020.
Valuation Methodology: Price to Earnings Based Valuation
.png)
Price to Earnings based Valuation(Source: Thomson Reuters)
Note: All forecasted figures and peers have been taken from Thomson Reuters, NTM-Next Twelve Months
Stock Recommendation:The stock of SCG is trading at $3.72, with a market capitalisation of ~$19.8 billion. The stock is trading towards the lower band of its 52-week trading range of $3.63 and $4.160. The stock has corrected by 4.06% and 1.31% in the last three months and six months, respectively. The business isstrategically focusing on customer preferences and intends to meet their changing expectations.Considering the business prospect and price movements, we have valued the stock using price to earnings based relative valuation method. For the purpose, we have considered peers like Mirvac Group (ASX: MGR), Vicinity Centres (ASX: VCX), Charter Hall Retail REIT (ASX: CQR) and arrived at a target price of lower double-digit (in % terms). Hence, we recommend a “Hold” rating on the stock at the current market price of $3.72 per share, down 1.587% as on 18th February 2020.
Ingenia Communities Group
H1FY20 Operational Highlights for the Period ended 31 December 2019:Ingenia Communities Group (ASX: INA) owns, operates and develops quality affordable seniors living accommodation and holiday communities. INA recently declared its half-yearly results, wherein the company reported revenue of $116.9 million, up 25% on pcp aided by increasing rents, recent acquisitions and settlements growth. EBIT stood at $32.2 million, up 40% from H1FY19. Statutory profit came in at $23.6 million, depicting a growth of 81% on y-o-y basis, driven by tightening cap rates offset by fair value movements on investment properties, which includes expensing of acquisition expenses and realisation of development profits. Operating cash flow, during the period stood at $27.2 million, up 60% from 1H19, driven by an increase in settlements and rental income. During the period, the business achieved 140 new home settlements, up 22% on 1H19, and adding ~$1.2 million in annual rental income. Net Asset Value (NAV) per security stood at $2.83, as compared to $2.65 on H1FY19.
.png)
Key FY19 Financial Highlights (Source: Company Reports)
The Board of Directors announced an unfranked dividend of $0.056 per ordinary share, payable on 26 March 2020.
Guidance: The business will continue to acquire mature lifestyle and holiday communities in order to create value for the investors. Management continues to explore expansion, development and acquisition opportunities within the seniors rental market as Ingenia Gardens continues to provide high-yield stable recurring cash flows.
Stock Recommendation:The stock of INA is quoting at $4.96, with a market capitalisation of ~$1.37 billion. The stock is trading towards the upper band of its 52-week trading range of $2.941 and $5.050. The stock has generated returns of 46.12% and 62.04% in the last six months and one year, respectively. Demand drivers remain strong across the industry with an ageing population and housing affordability underpinning earnings growth, while the business remains strong with its sector leading development pipeline and opportunities to acquire existing communities and sites for future development. The stock is available at a price to cash flow of 23x on TTM basis, as compared to the industry median (Financials) of 24.6x. Considering the business prospects, price movements and current trading levels, we recommend a “Hold” rating on the stock at the current market price of $4.96 per share, down 1.587% as on 18th February 2020.
Abacus Property Group
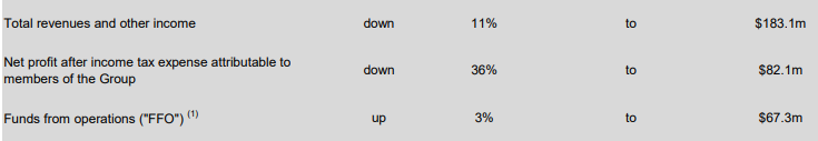
H1FY20 Operational Highlights for the Period ended 31 December 2019:Abacus Property Group (ASX: ABP) is a leading diversified property group that focuses on investing across core plus property opportunities within the commercial property markets in Australia and New Zealand. ABP announced its half yearly results, wherein it reported total revenues and other income of $183.1 million, down by 11% on yoy basis. The company’s statutory profit stood at $82.1 million, down by 36% from H1FY19. In the same time span, Funds from operations (FFO) stood at $67.3 million, up 3% on pcp. The business witnessed a 3.1% growth in net property rental income to $59.2 million while office portfolio rent grew by 3.2% on y-o-y basis. The business reported an addition of more than $500 million to office portfolio, which added quality and long-term stability of income for the business. Total assets, at the end of FY19 stood at $3.3 billion, depicting a growth of 17.8% from FY18.
Key FY19 Operational Highlights (Source: Company Reports)
Valuation Methodology: Price to Earnings Based Valuation
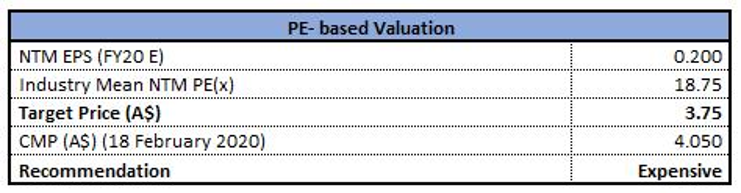
Price to Earnings based Valuation(Source: Thomson Reuters)
Note: All forecasted figures and peers have been taken from Thomson Reuters, NTM-Next Twelve Months
Stock Recommendation:The stock of ABP is trading at $4.050, with a market capitalisation of ~$2.54 billion. The stock is trading towards the upper band of its 52-week trading range of $3.50 and $4.38. The stock has generated a positive return of 2.34% and 0.77% in the last three months and six months, respectively. ABP is a strong asset backed, annuity style investment house and reported balance sheet conversion with 92% of investment assets deployed across the key sectors. Considering the recent acquisitions, price movements and current trading levels, we have valued the stock using price to earnings-based relative valuation method. For the purpose, we have considered peers like Goodman Group (ASX: GMG), Mirvac Group (ASX: MGR), Charter Hall Group (ASX: CHC) and arrived at a target price of single-digit downside (in% terms). Hence, we give an “Expensive” rating on the stock at the current market price of $4.050 per share, up 3.053% as on 18th February 2020 on account of the earnings announcement.
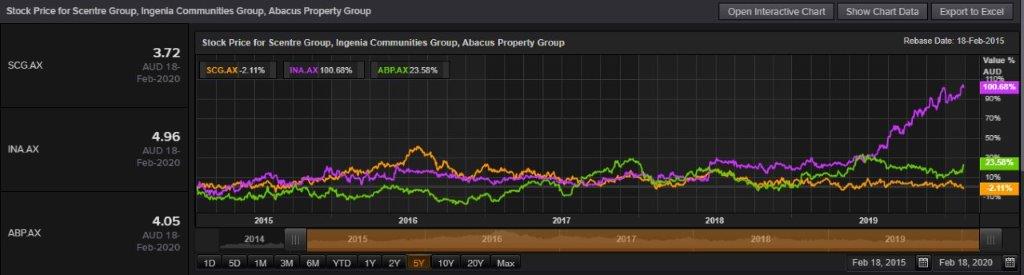
Comparative Price Chart (Source: Thomson Reuters)
Disclaimer
The advice given by Kalkine Pty Ltd and provided on this website is general information only and it does not take into account your investment objectives, financial situation or needs. You should therefore consider whether the advice is appropriate to your investment objectives, financial situation and needs before acting upon it. You should seek advice from a financial adviser, stockbroker or other professional (including taxation and legal advice) as necessary before acting on any advice. Not all investments are appropriate for all people. Kalkine.com.au and associated pages are published by Kalkine Pty Ltd ABN 34 154 808 312 (Australian Financial Services License Number 425376). The information on this website has been prepared from a wide variety of sources, which Kalkine Pty Ltd, to the best of its knowledge and belief, considers accurate. You should make your own enquiries about any investments and we strongly suggest you seek advice before acting upon any recommendation. Kalkine Pty Ltd has made every effort to ensure the reliability of information contained in its newsletters and websites. All information represents our views at the date of publication and may change without notice. To the extent permitted by law, Kalkine Pty Ltd excludes all liability for any loss or damage arising from the use of this website and any information published (including any indirect or consequential loss, any data loss or data corruption). If the law prohibits this exclusion, Kalkine Pty Ltd hereby limits its liability, to the extent permitted by law to the resupply of services. There may be a product disclosure statement or other offer document for the securities and financial products we write about in Kalkine Reports. You should obtain a copy of the product disclosure statement or offer document before making any decision about whether to acquire the security or product. The link to our Terms & Conditions has been provided please go through them and also have a read of the Financial Services Guide. On the date of publishing this report (mentioned on the website), employees and/or associates of Kalkine Pty Ltd do not hold positions in any of the stocks covered on the website. These stocks can change any time and readers of the reports should not consider these stocks as advice or recommendations.
 AU
AU

 Please wait processing your request...