Snap Inc.
.png)
SNAP Details
50% Revenue Jump Aided byGrowth in Daily Active Users:Snap Inc. (NYSE: SNAP) is a camera-based application which was designed to communicate through short videos and images called “Snaps.” The company informed that it would announce its full-year results on 04 February 2020.
Q3FY19 Financial Highlights for the Period ended 30 September 2019:SNAP announced its quarterly results, wherein the business reported revenue of $446.199 million as compared to $297.695 million aided by growth in daily active users (DAUs) across North America, Europe, and Rest of World. The company reported DAUs at 210 million in Q3FY19 as compared to 186 million in Q3FY18. The business witnessed a 40% y-o-y increase in total daily time spent by Snapchatters watching Discover.At the end of Q3FY19, SNAP created more than 600,000 lenses through Lens Studio, higher than 500,000 on Q2FY19. The company announced its partnership with SYBO Games and launched a new multiplayer game named Subway Surfers Airtime. The game was an exclusive release on Snapchat platform while depicted the extension of its hit franchise, Subway Surfers. During the quarter, the company added more than 50 new outlets globally across eight geographies, while time spent on premium content grew at 55% on y-o-y basis within the international segment. The company reported a net loss of $227.375 million, lower as compared to a loss of $325.148 million in Q3FY18.
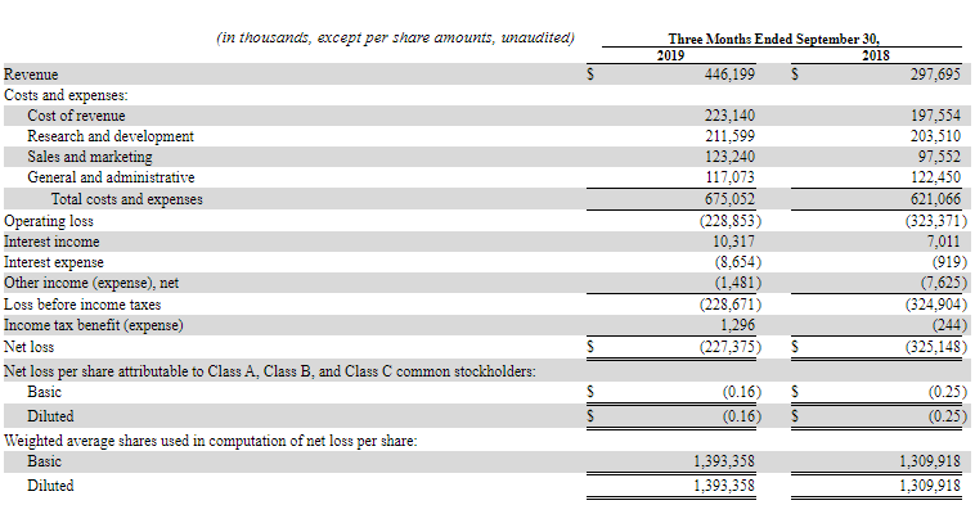
Guidance: The Management expects Q4FY19 revenue to come within the range of $540 million - $560 million, while adjusted EBITDA is expected between breakeven and $20 million.
Valuation Methodology: Enterprise Value to Sales based Valuation
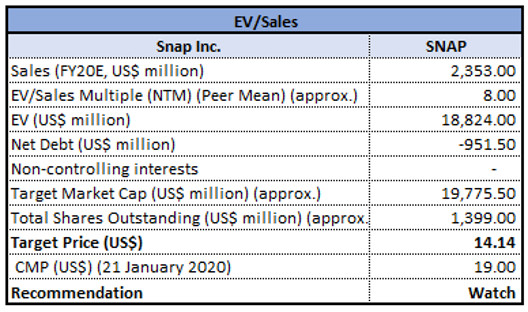
Enterprise Value to Sales Based Valuation (Source: Thomson Reuters)
Note: All forecasted figures and peers have been taken from Thomson Reuters, NTM-Next Twelve Months
Stock Recommendation: The stock of SNAP closed at $19.00 with a market capitalization of $26.599 Bn as om 21 January 2020. The stock is quoting at the upper band of its 52-weeks trading range of $5.74 to $19.29. The company reported improved in operating cash flow and free cash flow in Q3FY19. The company delivered strong results in Q3FY19. Investments made by the company are continuously driving the growth of the community and the business.Considering the aforesaid facts, current trading levels and increase in expenses, we have valued the stock using one relative valuation method, i.e., Enterprise value (EV) to Sales. For the purpose, we have considered peers like Twitter Inc. (NYSE: TWTR), Pinterest Inc. (NYSE: PINS), Facebook Inc (NASDAQ: FB), etc. Therefore, we arrived at a conclusion that the stock might see a correction, moving forward. Hence, we have a watch stance on the stock at the closing price of $19.00, down 0.58% as on 21 January 2020.
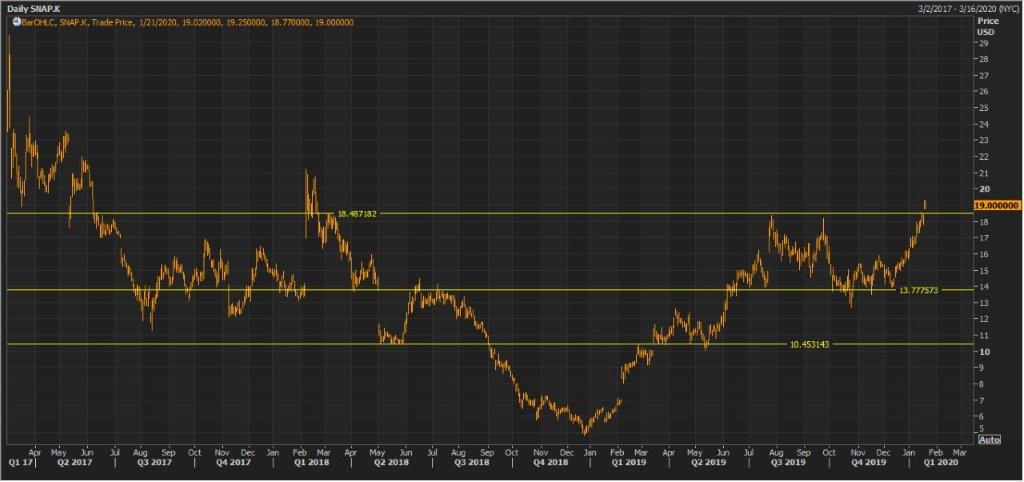
SNAP Daily Technical Chart (Source: Thomson Reuters)
Pinterest, Inc.
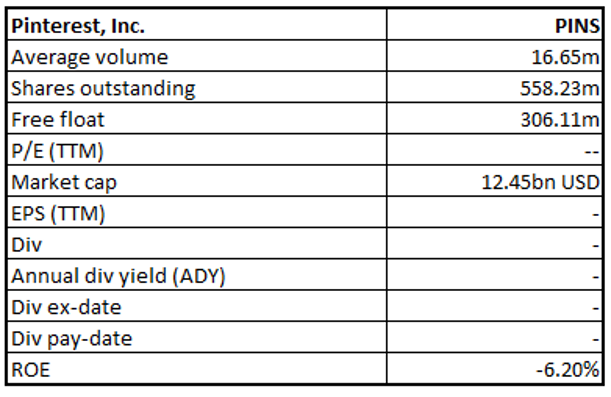
PINS Details
Robust Growth in Monthly Active Users: Pinterest, Inc. (NYSE: PINS) is a technology-based company and operates in visual discovery engine which is used by end-users for discovery information. On 14 January, PINS reported total registered users of 82.4 million, surpassing Snapchat’s register users of 80.2 million.
Q3FY19 Financial Highlights for the Period ended 30 September 2019:PINS announced its quarterly results, wherein the company reported revenue at $279.703 million as compared to $190.197 million in previous corresponding quarter, aided by 28% y-o-y growth in monthly active users (MAU). The company reported a loss from operations at $133.710 million as compared to a loss of $22.431 million in Q3FY18. The company reported cost of revenue at $83.520 million as compared to $63,649 million in the previous corresponding quarter. Sales and marketing expenses and general and administrative expenses stood at $110.740 million and $51.450 million, respectively, during Q3FY19. Net loss during the quarter, came in at $124.732 million as compared to $18.874 million in the previous corresponding period. The business exited the quarter with cash and cash equivalents of $1033.871 million while total assets stood at $2,280.472 million. The company reported net cash used in operating activities at $8.901 million, net cash used in investing activities at $202.779 million while net cash provided by financing activities at $1,137.674 million.
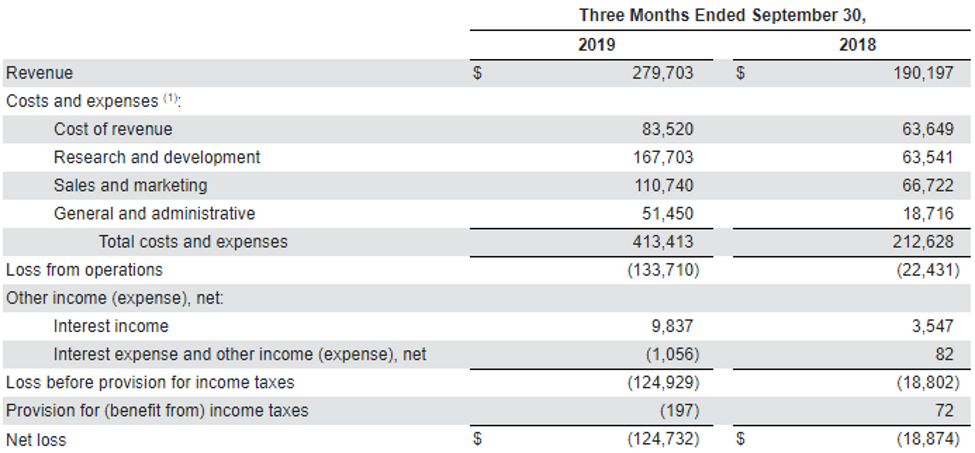
Q3FY19 Income Statement Highlights (Source: Company Reports)
Valuation Methodology: Enterprise Value to Sales Based valuation
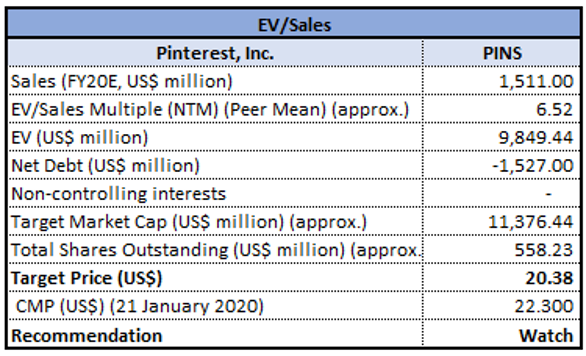
Enterprise Value to Sales based Valuation (Source: Thomson Reuters)
Note: All forecasted figures and peers have been taken from Thomson Reuters, NTM-Next Twelve Months
Stock Recommendation:The stock of PINS closed at $22.30 with a market capitalization of ~$12.448 billion as on 21 January 2020. The stock is trading at the lower band of its 52-week trading range of $17.39 to $36.83. The business has its presence across 26 countries, up from six countries, a year ago. Research and development expenses in terms of revenue stood higher at 60%, increased from 33% in the previous corresponding period. The company is looking to redesign its portfolio to provide insightful and superior recommendations quality to help people discover new ideas.Considering the aforesaid facts, current trading levels and increase in expenses, we have valued the stock using one relative valuation method, i.e., Enterprise value (EV) to Sales based approach. We have considered peers like Snap Inc. (NYSE: SNAP), Facebook Inc. (NASDAQ: FB), Alphabet Inc. (NASDAQ: GOOGL), etc., and arrived at a target price of lower single-digit downside (in % terms). Hence, we have a watch stance on the stock at the closing price of $22.30, down 3.04% as on 21 January 2020.
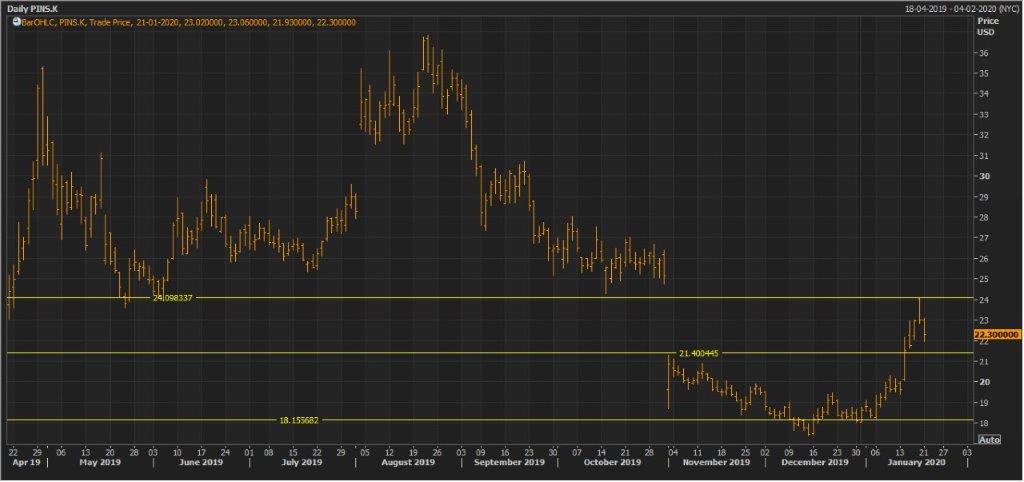
PINS Daily Technical Chart (Source: Thomson Reuters)
Disclaimer
The advice given by Kalkine Pty Ltd and provided on this website is general information only and it does not take into account your investment objectives, financial situation or needs. You should therefore consider whether the advice is appropriate to your investment objectives, financial situation and needs before acting upon it. You should seek advice from a financial adviser, stockbroker or other professional (including taxation and legal advice) as necessary before acting on any advice. Not all investments are appropriate for all people. Kalkine.com.au and associated pages are published by Kalkine Pty Ltd ABN 34 154 808 312 (Australian Financial Services License Number 425376). The information on this website has been prepared from a wide variety of sources, which Kalkine Pty Ltd, to the best of its knowledge and belief, considers accurate. You should make your own enquiries about any investments and we strongly suggest you seek advice before acting upon any recommendation. Kalkine Pty Ltd has made every effort to ensure the reliability of information contained in its newsletters and websites. All information represents our views at the date of publication and may change without notice. To the extent permitted by law, Kalkine Pty Ltd excludes all liability for any loss or damage arising from the use of this website and any information published (including any indirect or consequential loss, any data loss or data corruption). If the law prohibits this exclusion, Kalkine Pty Ltd hereby limits its liability, to the extent permitted by law to the resupply of services. There may be a product disclosure statement or other offer document for the securities and financial products we write about in Kalkine Reports. You should obtain a copy of the product disclosure statement or offer document before making any decision about whether to acquire the security or product. The link to our Terms & Conditions has been provided please go through them and also have a read of the Financial Services Guide. On the date of publishing this report (mentioned on the website), employees and/or associates of Kalkine Pty Ltd do not hold positions in any of the stocks covered on the website. These stocks can change any time and readers of the reports should not consider these stocks as advice or recommendations.
 AU
AU

 Please wait processing your request...