OceanaGold Corporation
.png)
OGC Details
FY20 Capital Investment Guidance anticipated at ~US$225 million: OceanaGold Corporation (ASX: OGC) is a mid-tier, multinational gold exploration company with footprints across the Philippines, New Zealand and the United States. The company recently informed that it would release its complete FY19 audited and operational results on 20 February 2020.
Key Operating Highlights for the Period ended 31 December 2019: OGC declared its operational highlights, wherein the company reported 470,601 ounces of Gold for FY19 and 108,151 ounces of Gold production in Q4FY19. The company reported its copper production for FY19 at 10,255 tonnes, which came in-line with the company’s guidance of 10,000 to 11,000 tonnes. During the fourth quarter of FY19, the company reported cash costs of $733 per ounce sold for FY19, with cost of $757 per ounce reported. The business continued its advance development across Martha Underground with ~830 metres and reported development and construction of the raise bore between the 800-RL and 920-RL drives, which was executed during the fourth quarter of FY19.
Guidance: The company declared its full-year guidance for FY20, wherein the company expects gold production within the range of 360 koz to 380 koz, combining the production facilities of Haile, Macraes & Waihi. The company expects its cash costs within the range of US$675 per oz sold to US$725 per oz sold. All-In Sustaining Costs per oz is expected within US$1,075 to US$1,125. The company expects total capital investment within the range of US$220 million to US$225 million for FY20.
.png)
Key FY20 Operating Guidance (Source: Company Reports)
Valuation Methodology: Price to Earnings Based Valuation
.png)
Price to Earnings Based Valuation (Source: Thomson Reuters), *1USD = 1.49 AUD
Note: All forecasted figures and peers have been taken from Thomson Reuters, NTM-Next Twelve Months
Stock Recommendation: The stock of OGC is quoting at $2.790 with a market capitalisation of $1.79 billion. The stock is trading at the lower band of its 52-week trading range of $2.49 to $4.84. Development of the Martha Underground project continues to progress well, and the first production is projected during the second quarter of FY21. The Martha Underground along with the WKP potential forms the basis for the Waihi District Study, which will be published as an initial economic evaluation and is expected to be completed in the second quarter of FY20.Considering the current trading levels and business prospects, we have valued the stock using Price to Earnings based relative valuation method. For the purpose, we have taken peers like St Barbara Ltd (ASX: SBM), Evolution Mining Ltd (ASX: EVN), Newcrest Mining Ltd (ASX: NCM), etc., and arrived at a target price of double-digit upside (in % terms). Hence, we recommend a “Buy” rating on the stock at the current market price of $2.79 per share, down 2.787% on 14 February 2020.
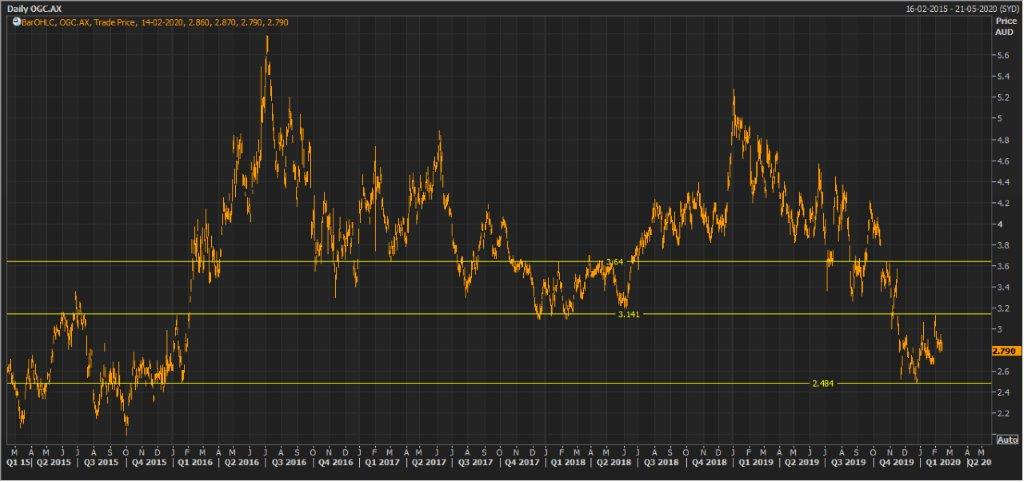
OGC Daily Technical Chart (Source: Thomson Reuters)
Caltex Australia Limited
.png)
CTX Details
Caltex Refiner Sales for January 2020 Stood at 551 ML:Caltex Australia Limited (ASX: CTX) is engaged in the purchase, processing, distribution, and marketing of petroleum products. The company informs that it has received a non-binding and indicative proposal from Alimentation Couche-Tard Inc. to acquire all of the shares in Caltex through a scheme of arrangement at an indicative cash price consideration of $35.25 per share excluding any dividends declared or paid by CTX. With the recent proposal, the company might propose a special dividend to the shareholders.
Trading Update: The company recently updated its Caltex Refiner Margin (CRM) in respect of the CRM sales from production for January 2020. In January 2020, CRM was reported at US$5.78/bbl, which was below the Q4FY19 CRM of US$7.51/bbl in the previous corresponding period. The month witnessed strong operational performance and reported CRM sales from production of 551 ML, higher than the prior comparative month. During the month of January 2020, CRM was impacted by higher landed crude oil premiums. The transition of the shipping industry to IMO2020 has resulted in premiums remaining elevated in January.
.png)
Key Operating Highlights for January 2020 (Source: Company Reports)
Q3FY19 Operational Highlights for the Period ended 30 September 2019: CTX announced its quarterly reports, wherein the company posted Refiner Margin (CRM) at US$10.53/bbl, lower than Q3FY18 margin of US$12.17bbl.CTX reported CRM sales from production of 1,055 ML, lower 1,410ML in Q3FY18. The lower production was due to the planned turnaround and inspection (T&I) programs occurred during July and August 2019. The quarter witnessed a rise in crude oil premiums products, indicating increased sweet crude demand, representing the higher-margin conditions. Landed crude premium during H1FY19 stood at US$5.50/bbl, witnessed an increase of US$0.83/bbl in landed crude premium as compared to H1FY19.
Valuation Methodology: Price to Earnings Based Valuation
.png)
Price to Earnings Based Valuation (Source: Thomson Reuters)
Note: All forecasted figures and peers have been taken from Thomson Reuters, NTM-Next Twelve Months
Stock Recommendation: The stock of CTX is trading at $33.55, with a market capitalization of $8.42 billion. The stock is quoting at the upper band of its 52-week trading range of $20.520 and $35.960. The stock has generated stellar returns of 19.57% and 28.06% in the last three months and six months, respectively. The business reported improved CRM sales during the month of January 2020 as compared to the previous corresponding period. Going forward, the company will monitor conditions carefully and its potential impact on regional refining margins and product demand. Considering the above factors, we have valued the stock using one relative valuation method, i.e., Price to Earnings multiple and arrived at lower single-digit downside (in % terms). For the above valuation, we have taken the peer group – Viva Energy Group Ltd (ASX: VEA), Woodside Petroleum Ltd (ASX: WPL), Santos Ltd (ASX: STO), etc. Hence, we give an “Expensive” rating on the stock at the current market price of $33.55 per share, down 0.534% as on 14th February 2020.
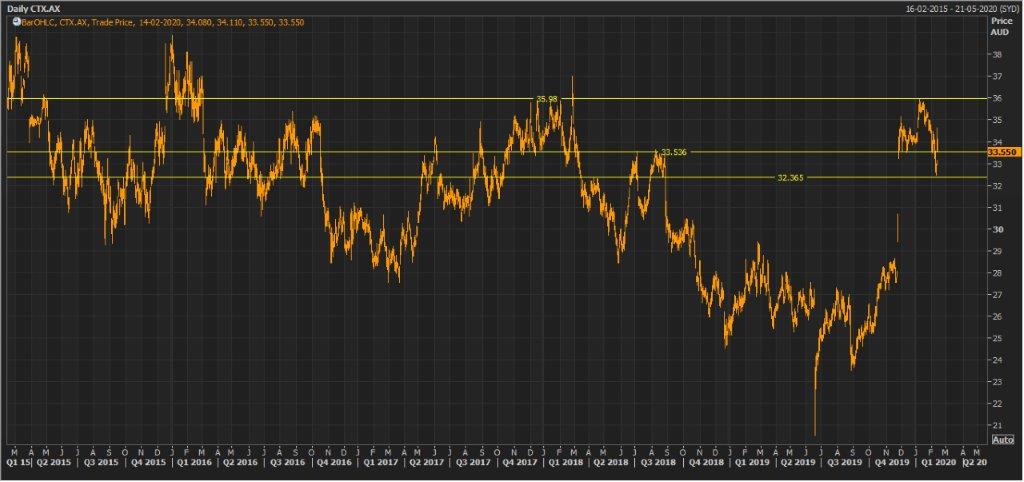
CTX Daily Technical Chart (Source: Thomson Reuters)
Disclaimer
The advice given by Kalkine Pty Ltd and provided on this website is general information only and it does not take into account your investment objectives, financial situation or needs. You should therefore consider whether the advice is appropriate to your investment objectives, financial situation and needs before acting upon it. You should seek advice from a financial adviser, stockbroker or other professional (including taxation and legal advice) as necessary before acting on any advice. Not all investments are appropriate for all people. Kalkine.com.au and associated pages are published by Kalkine Pty Ltd ABN 34 154 808 312 (Australian Financial Services License Number 425376). The information on this website has been prepared from a wide variety of sources, which Kalkine Pty Ltd, to the best of its knowledge and belief, considers accurate. You should make your own enquiries about any investments and we strongly suggest you seek advice before acting upon any recommendation. Kalkine Pty Ltd has made every effort to ensure the reliability of information contained in its newsletters and websites. All information represents our views at the date of publication and may change without notice. To the extent permitted by law, Kalkine Pty Ltd excludes all liability for any loss or damage arising from the use of this website and any information published (including any indirect or consequential loss, any data loss or data corruption). If the law prohibits this exclusion, Kalkine Pty Ltd hereby limits its liability, to the extent permitted by law to the resupply of services. There may be a product disclosure statement or other offer document for the securities and financial products we write about in Kalkine Reports. You should obtain a copy of the product disclosure statement or offer document before making any decision about whether to acquire the security or product. The link to our Terms & Conditions has been provided please go through them and also have a read of the Financial Services Guide. On the date of publishing this report (mentioned on the website), employees and/or associates of Kalkine Pty Ltd do not hold positions in any of the stocks covered on the website. These stocks can change any time and readers of the reports should not consider these stocks as advice or recommendations.
 AU
AU
.jpg)
 Please wait processing your request...