Fortescue Metals Group Ltd
Product and Marketing Strategy Supported Fortescue In the First Quarter: Fortescue Metals Group (ASX: FMG) ended September 2018 quarter with the cash production costs (or C1) amounting to US$13.19 per wmt (or wet metric tonne) as well as with 40.2 million tonnes of the iron ore shipments. The company had stated that the results represent decent cost performance and marketing strategy execution which supported the realised price. These factors have also helped the company in terms of cash flows improvement.
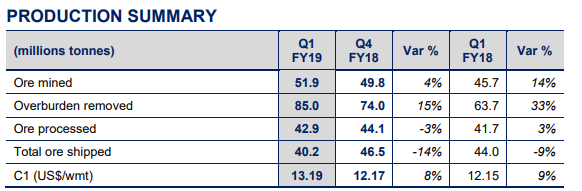
FMG’s Production Summary (Source: Company Reports)
Crucial Margins Above Industry Medians: In FY 2018, Fortescue Metals Group has managed to maintain the important margins above the industry median levels. In FY 2018, the company’s EBITDA margin stood at 45.3% which is higher as compared to the industry median of 29.6%. The company’s net margin is also higher compared to the industry median. In FY 2018, its net margin was 12.7% while the industry median was 12.5%. Moreover, there has also been a rise in the company’s current ration on the YoY basis. In FY 2018, its current ratio was 1.33x which implies the YoY rise as in the previous year it was 1.18x implying the rise of 12.6%.
Important Numbers to Look in FY 2019: As depicted by the press release dated October 25, 2018, Fortescue Metals Group had stated that it might witness 165-173mt with respect to the shipments and would also be focusing towards the margins optimisation with the help of volumes as well as product mix. The press release also stated that there are expectations of the total capital expenditure or CAPEX amounting to US$1.2 billion. There C1 cost is expected to be in the range of US$12-13/wmt.
Stock Recommendation: On the daily chart of Fortescue Metals Group, Moving Average Convergence Divergence or MACD has been applied and default values were used. After careful observation, it was noticed that the MACD line has touched the signal line and the crossover might occur moving forward. If the crossover occurs, it would lead to the bullish momentum in the stock.
As a result, we maintain our “Buy” rating on the stock at the current market price of A$4.150 per share.
BHP Group Limited
Total Petroleum Production Witnesses Marginal Decline: BHP Group Limited (ASX: BHP) had earlier reported the results of the September 2018 quarter in which it posted total petroleum production of 33 MMboe which implies a marginal fall of 1% on the PCP basis. However, the production of crude oil, condensate as well as natural gas liquids stood at 14 MMboe which reflects the fall of 7% on the PCP basis because of the 70-day planned dry dock maintenance which was seen at the Pyrenees as well as because of natural field decline.
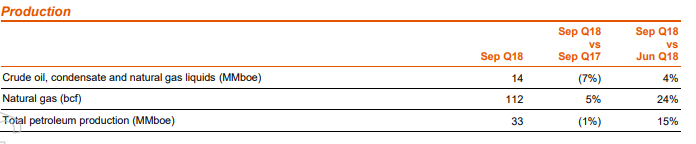
Petroleum Production (Source: Company Reports)
In the September 2018 quarter, the production of natural gas stood at 112 bcf which implies the rise of 5% compared to the same period of the previous year because of higher tax barrels at Trinidad as well as Tobago in pursuant to Production Sharing Contract terms.
Decent Growth in Important Margins: BHP Group Limited has posted gross margins of 72.8% in FY 2018 which implies the growth of 0.2% on the YoY basis. Its net margins have also witnessed 4.6% YoY rise to 23.1% in FY 2018. Moreover, the company happens to possess robust standing when it comes to the return on equity or ROE for FY 2018. The company’s ROE for FY 2018 stood at 15.9% which implies the YoY growth of 4.5%. The company’s ROE is also higher than the industry median ROE which is 11.7%.
Net Debt to Be Between US$10-15 Billion (Medium-Term): As depicted by the November 2018 AGM presentation, BHP Group is expected to witness net debt between US$10-15 billion with respect to medium-term. It also stated that the capital expenditure or CAPEX of the company would be lower than US$8 billion in FY 2019 as well as FY 2020.
Stock Recommendation: On the daily chart of BHP Group, Moving Average Convergence Divergence or MACD has been applied and, for the purposes, the default values were used. As per the observation, the MACD line has crossed the signal line and is moving upwards which signifies that the stock might encounter upward trend.
As a result, we maintain our “Hold” rating on the stock at the current market price of A$33.680 per share (down 1.607% on January 02, 2018).
Disclaimer
The advice given by Kalkine Pty Ltd and provided on this website is general information only and it does not take into account your investment objectives, financial situation or needs. You should therefore consider whether the advice is appropriate to your investment objectives, financial situation and needs before acting upon it. You should seek advice from a financial adviser, stockbroker or other professional (including taxation and legal advice) as necessary before acting on any advice. Not all investments are appropriate for all people. Kalkine.com.au and associated pages are published by Kalkine Pty Ltd ABN 34 154 808 312 (Australian Financial Services License Number 425376). The information on this website has been prepared from a wide variety of sources, which Kalkine Pty Ltd, to the best of its knowledge and belief, considers accurate. You should make your own enquiries about any investments and we strongly suggest you seek advice before acting upon any recommendation. Kalkine Pty Ltd has made every effort to ensure the reliability of information contained in its newsletters and websites. All information represents our views at the date of publication and may change without notice. To the extent permitted by law, Kalkine Pty Ltd excludes all liability for any loss or damage arising from the use of this website and any information published (including any indirect or consequential loss, any data loss or data corruption). If the law prohibits this exclusion, Kalkine Pty Ltd hereby limits its liability, to the extent permitted by law to the resupply of services. There may be a product disclosure statement or other offer document for the securities and financial products we write about in Kalkine Reports. You should obtain a copy of the product disclosure statement or offer document before making any decision about whether to acquire the security or product. The link to our Terms & Conditions has been provided please go through them and also have a read of the Financial Services Guide. On the date of publishing this report (mentioned on the website), employees and/or associates of Kalkine Pty Ltd do not hold positions in any of the stocks covered on the website. These stocks can change any time and readers of the reports should not consider these stocks as advice or recommendations.
 AU
AU

 Please wait processing your request...