Inotiv Inc
Inotiv, Inc. (NASDAQ: NOTV) is a contract research company, which is engaged in providing nonclinical and analytical drug discovery and development services to the pharmaceutical and medical device industries and selling a range of research-quality animals and diets to the same industries, as well as academia and government clients. Its products and services focus on bringing new drugs and medical devices through the discovery and preclinical phases of development. It operates through two segments: Discovery and Safety Assessment (DSA) and Research Models and Services (RMS).
Recent Financial and Business Updates:
- Financial Highlights: In the first quarter of fiscal year 2024 (Q1 FY 2024), Inotiv reported a notable increase in revenue, reaching USD 135.5 million compared to USD 122.8 million in the same period of the previous fiscal year. This growth was driven by a substantial rise in Research Models and Services (RMS) revenue and Discovery and Safety Assessment (DSA) revenue. The consolidated net loss for Q1 FY 2024 amounted to USD 15.8 million, representing 11.7% of total revenue, a significant improvement from the consolidated net loss of USD 86.9 million (70.8% of total revenue) in Q1 FY 2023. Adjusted EBITDA for Q1 FY 2024 was USD 9.6 million, constituting 7.1% of total revenue, compared to a negative adjusted EBITDA of USD (5.5) million (negative 4.5% of total revenue) in the same quarter of the previous fiscal year.
- DSA and RMS Highlights: During December 2023, Inotiv announced its partnership with Vanguard Supply Chain Solutions LLC to facilitate the internal integration of Inotiv's North American transportation operations. The Fort Collins, CO expansion was completed by October 2023, and the Company successfully sold its RMS facilities in Spain and France during the three months ended December 31, 2023. Ongoing optimization efforts include the completion of site expansion in the UK and the anticipated relocation of activities from Blackthorn to Hillcrest, expected to conclude by the end of March 2024. Additionally, facilities in Cumberland and Dublin, Virginia; Haslett, Michigan; and Blackthorn, U.K. are under contract for sale as of December 31, 2023.
- First Quarter Fiscal 2024 Financial Results: Revenue witnessed a 10.3% increase, reaching USD 135.5 million in Q1 FY 2024, with a positive impact from higher RMS and DSA revenue. The operating loss for Q1 FY 2024 improved to USD 9.4 million compared to an operating loss of USD 90.6 million in Q1 FY 2023, primarily due to increased RMS operating income and reduced corporate expenses. Cash and cash equivalents as of December 31, 2023, stood at USD 22.0 million, and the company remained in compliance with debt covenants.
- Fiscal 2024 Outlook: Inotiv reaffirms its fiscal 2024 outlook, expecting revenues in the range of USD 580 to USD 590 million and adjusted EBITDA in the range of USD 75 to USD 80 million. The company anticipates continued compliance with financial covenants and maintains a capital expenditure projection of approximately 4.5% of revenue for fiscal year 2024.
Technical Observation (on the daily chart)
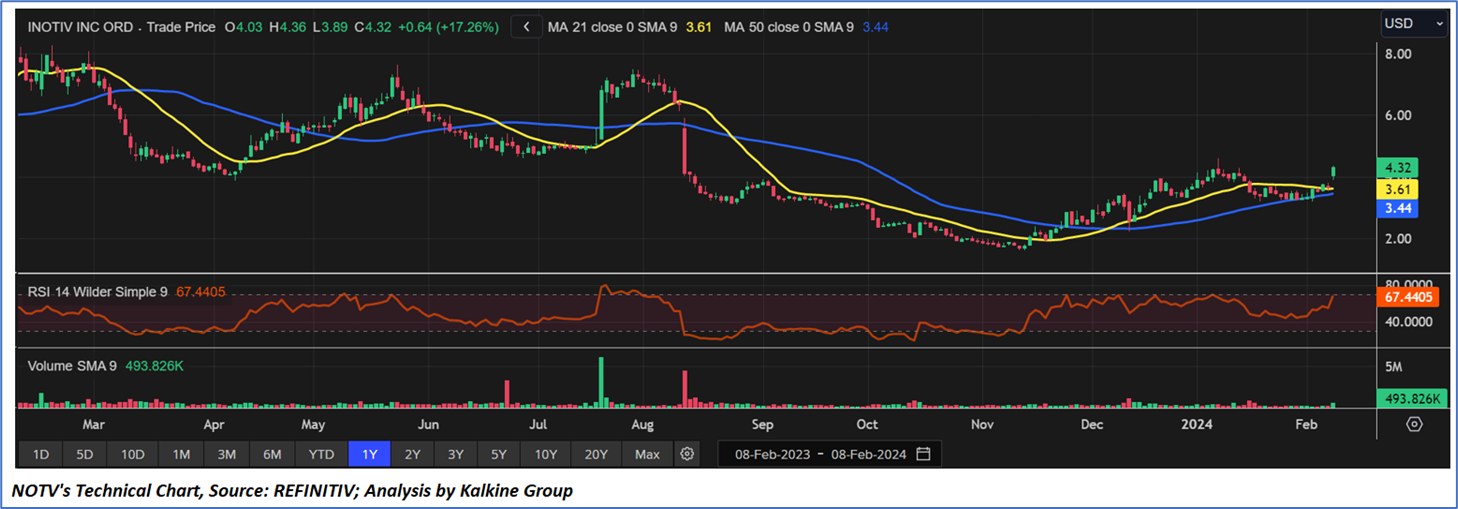
The Relative Strength Index (RSI), calculated over a 14-day span, stands at 67.44, currently upward trending and near overbought zone, signifying the likelihood of either more consolidation or some correction. Adding to this, the stock presently finds itself positioned above both the 21-day and 50-day Simple Moving Averages (SMA), which could function as a dynamic short-term support levels. The current price is near an import resistance zone of USD 4.50-USD 5.00, which if broken can further lead to more upward momentum.
Individuals can evaluate the stock based on the support and resistance levels provided in the report in case of keen interest taking into consideration the risk-reward scenario.
Markets are trading in a highly volatile zone currently due to certain macro-economic issues and prevailing geopolitical tensions. Therefore, it is prudent to follow a cautious approach while investing.
How to Read the Charts?
The yellow colour line reflects the 21-period simple moving average (SMA) while the blue line indicates the 50- period simple moving average (SMA). SMA helps to identify existing price trends. If the prices are trading above the 21-period and 50-period moving average, then it shows prices are currently trading in a bullish trend.
The orange colour line in the chart’s lower segment reflects the Relative Strength Index (14-Period) which indicates price momentum and signals momentum in trend. A reading of 70 or above suggests overbought status while a reading of 30 or below suggests an oversold status.
The red and green colour bars in the chart’s lower segment show the volume of the stock. The volume is the number of shares that changed hands during a given day. Stocks with high volumes are more liquid than stocks with lesser volume as liquidity in stocks helps with easier and faster execution of the order.
The Orange colour lines are the trend lines drawn by connecting two or more price points and used for trend identification purposes. The trend line also acts as a line of support and resistance.
Technical Indicators Defined: -
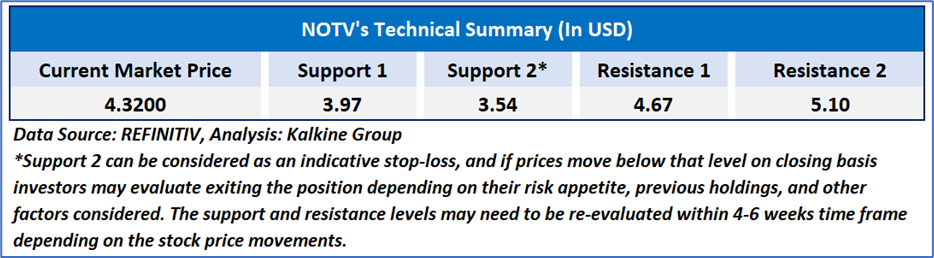
Support: A level at which the stock prices tend to find support if they are falling, and a downtrend may take a pause backed by demand or buying interest. Support 1 refers to the nearby support level for the stock and if the price breaches the level, then Support 2 may act as the crucial support level for the stock.
Resistance: A level at which the stock prices tend to find resistance when they are rising, and an uptrend may take a pause due to profit booking or selling interest. Resistance 1 refers to the nearby resistance level for the stock and if the price surpasses the level, then Resistance 2 may act as the crucial resistance level for the stock.
Stop-loss: It is a level to protect further losses in case of unfavourable movement in the stock prices.
Abbreviations
CMP: Current Market Price
SMA: Simple Moving Average
RSI: Relative Strength Index
USD: United States dollar
Note 1: Past performance is not a reliable indicator of future performance.
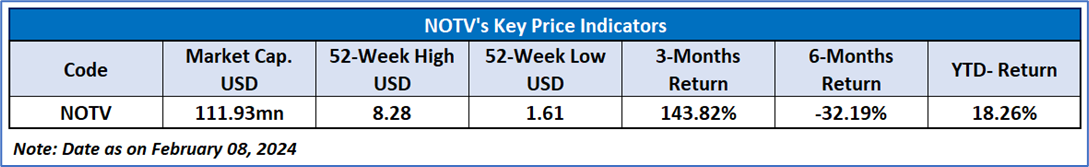
Note 2: The reference date for all price data, currency, technical indicators, support, and resistance levels is February 08, 2024. The reference data in this report has been partly sourced from REFINITIV.
Note 3: Investment decisions should be made depending on an individual's appetite for upside potential, risks, holding duration, and any previous holdings. An 'Exit' from the stock can be considered if the Target Price mentioned as per the Valuation and or the technical levels provided has been achieved and is subject to the factors discussed above.
Note 4: The report publishing date is as per the Pacific Time Zone.
 AU
AU

 Please wait processing your request...