Sidus Space, Inc
Sidus Space, Inc (NASDAQ: SIDU) operates as a space mission enabler, delivering a range of services such as bespoke satellite design, payload hosting, mission planning and management, AI-driven space-based sensor data-as-a-service, and space manufacturing. Its flagship modular satellite, LizzieSat, is a 3D-printed, multi-sensor, multi-mission platform that can be tailored to incorporate new technologies or scaled and customized to develop entirely new satellite configurations based on specific mission needs.

Recent Development
Sidus Space, Inc. announced that it has priced a best-efforts equity offering of 10.8 million shares of its Class A common stock at USD 1.50 per share, which is expected to generate approximately USD 16.2 million in gross proceeds before fees and expenses. All shares in the offering are being issued directly by the Company.
Key Growth Aspects
- Strengthening Technology Portfolio and Vertically Integrated Model: Sidus Space continues to advance its vertically integrated offerings across satellite manufacturing, AI-enabled data platforms, and defense-focused hardware solutions. This integration supports a diversified business model spanning multiple revenue streams, including LizzieSat® satellite platforms, Fortis™ VPX rugged compute architectures, and FeatherEdge™ AI/ML payload processing systems. The business update highlights momentum in developing next-generation products aligned to high-growth military and commercial applications. The Company’s technology pipeline is further supported by continued investment in R&D, intellectual property filings, and manufacturing capability. These initiatives reinforce Sidus’ positioning as both a space hardware supplier and data-driven analytics provider.This comprehensive capability base enhances Sidus’ scalability and long-term revenue potential as commercialization continues.
- Expanding Strategic Partnerships and Contract Engagements: The Company reported continued execution across existing contracts, along with strategic expansion activities that enhance its commercial footprint. Highlights include new partnerships such as the integration of the Lonestar Commercial Pathfinder Mission on LizzieSat-5, and continued engagement with both commercial and government customers. These relationships strengthen Sidus’ market relevance across defense, intelligence, maritime tracking, and satcom-linked applications. Board-level and executive leadership appointments further support this strategic growth agenda. By adding experienced business development leadership and industry experts, the Company is enhancing its go-to-market execution capability and strengthening governance oversight. These initiatives demonstrate tangible business traction despite early-stage commercialization dynamics.
- Solid Capital Access Supporting Ongoing Investment: Despite operating losses, Sidus Space has demonstrated consistent access to capital through equity raises and secured lending. During the period, the Company completed multiple financings supporting technology development and broader operating liquidity. This enabled continued execution of core business programs while building out infrastructure required for long-term growth. As of September 30, 2025, the Company reported a cash balance of USD 12.7 million, providing near-term funding stability. This follows meaningful capital inflow during the period through share issuances and debt capacity utilization. Capital availability is strategically important given the Company’s growth-investment phase.
Growth Challenges
- Revenue Contraction and Gross Margin Deterioration: Sidus Space reported a 31% decline in revenue in Q3 FY2025 to USD 1.3 million vs USD 1.9 million in Q3 FY2024, driven largely by a pivot away from legacy services toward new recurring-revenue models. While strategically aligned to long-term goals, the transition has negatively impacted near-term performance. Gross margin performance deteriorated sharply. The Company recorded a gross loss of USD 1.3 million in Q3 FY2025 versus a gross profit of USD 38k in Q3 FY2024, reflecting higher satellite depreciation and reduced contribution from previously higher-margin activities. This creates near-term earnings pressure during a critical scaling phase.
- Escalating Operating Losses and Cash Burn: Operating costs increased meaningfully in support of growth initiatives. Selling, general and administrative expenses rose to USD 4.3 million in Q3 FY2025 from USD 3.2 million in Q3 FY2024, reflecting headcount expansion, launch rescheduling expenses, and operational scaling. As a result, net loss widened to USD 6.0 million in Q3 FY2025 vs USD 3.9 million in Q3 FY2024, and Adjusted EBITDA loss expanded to USD 4.0 million from USD 2.5 million. This demonstrates persistent negative operating leverage. Sustained cash burn heightens execution risk if revenue conversion timelines extend further.
- Dependence on External Financing and Leveraged Balance Sheet: Sidus Space remains dependent on equity issuance and secured loan capacity to fund operations. During the nine-month period, financing inflows totaled USD 16.9 million, materially offsetting operating and investing cash outflows. This creates dilution risk for equity holders and long-term sustainability concerns if capital markets conditions tighten. Asset-based borrowing increased significantly, with the loan balance rising to USD 9.1 million as of September 30, 2025 compared with USD 6.9 million at December 2024. Related borrowing costs drove USD 1.2 million in loan expense year-to-date.
Technical Observation (on the daily chart):
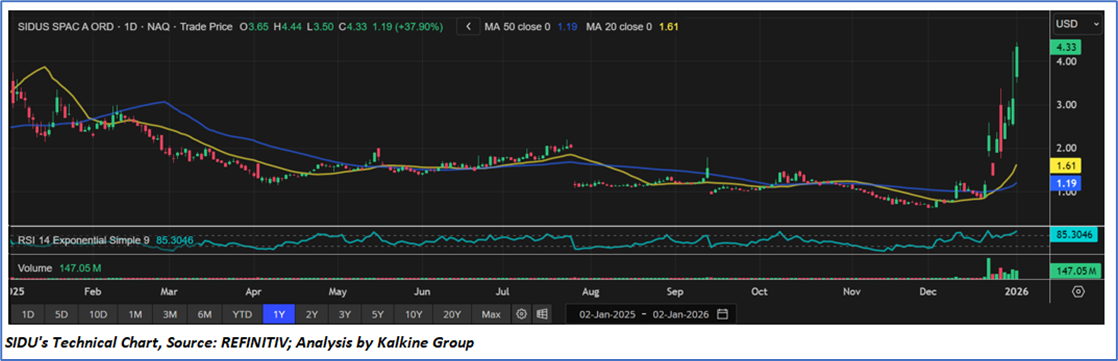
Sidus Space’s share price has broken out strongly after a long period of quiet trading, rising rapidly from around USD 1.00 to above USD 4.00 with a surge in volume that signals strong bullish momentum. The stock is now well above its key moving averages, confirming an uptrend, but the RSI above 85 shows it is extremely overbought, suggesting the risk of near-term pullbacks or consolidation even though the broader trend remains positive.
On the positive side, the Company is strengthening its vertically integrated space and defense platform, advancing its LizzieSat® program, expanding AI-enabled product lines, and building strategic partnerships that position it for future recurring revenue opportunities. However, near-term financial performance remains challenging, with Q3 FY2025 revenue declining 31% year-on-year, gross margin shifting to a loss due to higher depreciation, and net loss widening to USD 6.0 million. Operating expenses and cash burn remain elevated, and the business continues to rely on external financing and asset-based lending for liquidity. Overall, while Sidus offers meaningful long-term growth potential in emerging space-tech markets, execution risk remains high until revenue scale and operating leverage improve
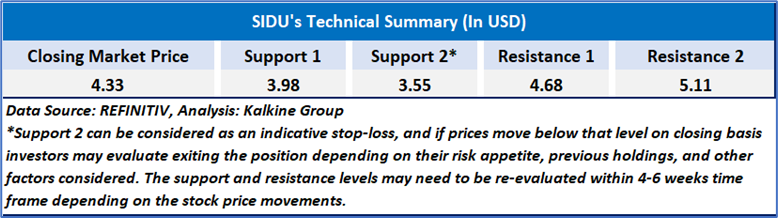
As per the above-mentioned price action, recent key business and financial updates, momentum in the stock over the last month, and technical indicators analysis, a ‘Watch’ rating has been given Sidus Space, Inc (NASDAQ: SIDU) at the closing market price of USD 4.33 as of Jan 02,2026.
Individuals can evaluate the stock based on the support and resistance levels provided in the report in case of keen interest taking into consideration the risk-reward scenario.
Markets are trading in a highly volatile zone currently due to certain macro-economic issues and prevailing geopolitical tensions. Therefore, it is prudent to follow a cautious approach while investing.
Related Risk: This report may be looked at from a high-risk perspective and a recommendation is provided for a short duration. This report is solely based on technical parameters, and the fundamental performance of the stocks has not been considered in the decision-making process. Other factors which could impact the stock prices include market risks, regulatory risks, interest rates risks, currency risks, social and political instability risks etc.
Note 1: Past performance is not a reliable indicator of future performance.
Note 2: The reference date for all price data, currency, technical indicators, support, and resistance level is January 02,2026. The reference data in this report has been partly sourced from REFINITIV.
Note 3: Investment decisions should be made depending on an individual's appetite for upside potential, risks, holding duration, and any previous holdings. An 'Exit' from the stock can be considered if the Target Price mentioned as per the Valuation and or the technical levels provided has been achieved and is subject to the factors discussed above.
Note 4: Target Price refers to a price level that the stock is expected to reach as per the relative valuation method and or technical analysis taking into consideration both short-term and long-term scenarios.
Note 5: ‘Kalkine reports are prepared based on the stock prices captured either from the New York Stock Exchange (NYSE), NASDAQ Capital Markets (NASDAQ), and or REFINITIV. Typically, all sources (NYSE, NASDAQ, or REFINITIV) may reflect stock prices with a delay which could be a lag of 15-20 minutes. There can be no assurance that future results or events will be consistent with the information provided in the report. The information is subject to change without any prior notice.

 CA
 NZ
 UK
 US
 IND

 AU

 Please wait processing your request...