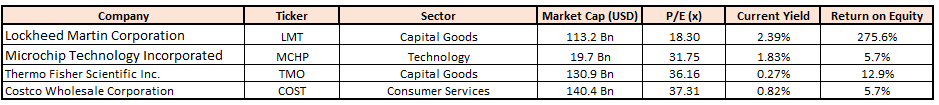
Stocks’ Details
Lockheed Martin Corporation
LMT Gets $168M Deal for LRASM Program: One of the biggest defense global contractor, Lockheed Martin Corporation (NYSE: LMT) is mainly focused on areas such as defense, intelligence, homeland security and information technology. On April 8, 2020, the company’s Missiles and Fire Control unit won a $167.5-million contract for obtaining 48 long-range anti-ship missiles (LRASM). The contract was awarded by the Air Force Life Cycle Management Center, Eglin, Air Force Base, FL. Notably, LMT is set to report its first quarter FY20 results on 21 April 2020.
COVID-19 Update: On 9th April 2020, LMT took necessary measures and is working closely with the U.S. Department of Defense (DOD) to curb the spread of COVID-19.In doing so, the company offered corporate jet fleet as donation to the federal government's COVID-19 relief efforts and estimates more than $450 million accelerated payments to supply chain partners. The company is also donating $10 million in charitable contributions for COVID-19 relief and recovery efforts and has distributed $6 million equally among Project HOPE, American Red Cross and the CDC Foundation All of Us.
4QFY19 Financial Highlights for the Period ended 31 December 2019: During, the quarter, the company reported earnings of $5.29 per share, up from $4.39 reported in the year-ago quarter.Net sales in 4QFY19, stood at $15.88 billion, which went up from $14.41 billion reported in the year-ago period. Notably, during the quarter all segments reported year-over-year sales growth. LMT reported an operating profit of $1.64 billion, up from $1.51 billion reported in the year-ago period.
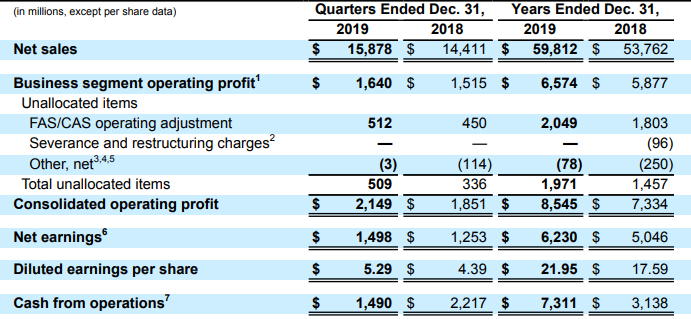
Key Financial Highlight (Source: Company Reports)
Outlook: For FY20, the company expects revenue in the range of $62.75-$64.25 billion. whereas, earnings per share is expected to be in the range of $23.65-$23.95. The company predicts cash from operations to be greater than or equal to $7.6 billion for the same time period.
Valuation Methodology: P/E Multiple Based Relative Valuation
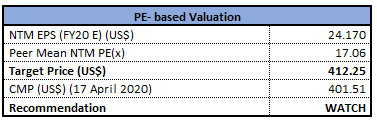
P/E Based Valuation (Source: Thomson Reuters)
Note: All forecasted figures have been taken from Thomson Reuters, NTM: Next Twelve Months
Stock Recommendation: The stock of LMT closed at $401.51 with a market capitalization of ~$113.2 billion. The stock made a 52-week low and high of $266.11 and $442.53 and is currently quoting at the upper band of its trading range. Thestock witnessed positive returns of 25.93% and 29.31% in the last one month and one year, respectively. Considering the operational excellence, focused execution, outlook and current trading level, we have valued the stock using P/E multiple based illustrative relative valuation method and arrived at a target price with a limited upside (in % terms). For the purpose, we have considered peers like General Dynamics Corp (NYSE: GD), Boeing Co (NYSE: BA), and Northrop Grumman Corp (NYSE: NOC), to name few. Hence, we have a watch stance on the stock at the current market price of $401.51, up 6.25% as on 17 April 2020.
Microchip Technology Incorporated
MCHP Updates Outlook Amid COVID-19 Crisis: Microchip Technology Incorporated (NASDAQ: MCHP) is engaged in developing and manufacturing microcontrollers, memory and analog and interface products designed to perform particular tasks. On April 8, 2020, the company updated its 4QFY20 revenues outlook. MCHP now expects fourth-quarter net sales to increase 3% sequentially compared with the previously revised outlook of flat sequential growth, provided on March 2. Notably, MCHP also notes that backlog for 1QFY21 increased 9% compared with 4QFY20. Additionally, MCHP anticipates reducing capital expenditure to $50-$70 million for FY21, owing to maintenance of capital and to boost the release of new products. Notably, MCHP is set to report its fourth quarter FY20 results on 7 May 2020.
3QFY20 Financial Highlights for the Period ended 31 December 2019: During the quarter, the company reported non-GAAP earnings of $1.32 per share. Net sales for the quarter stood at $1.287 billion, down 6.4% year over year. Management noted slow demand across communication and appliance end-markets. During the quarter, non-GAAP gross margin came in at 61.5%, which was above the high end of its most recent guidance range. Non-GAAP operating margin came in at 35.1%.
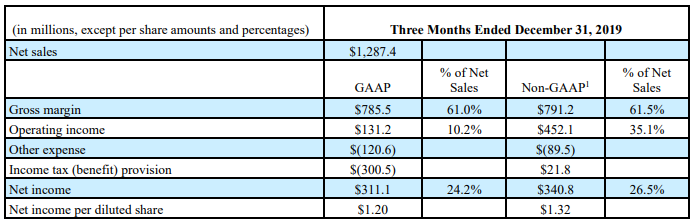
Key Financial Highlight (Source: Company Reports)
Balance Sheet & Cash Flow:The company exited the period with cash and short-term investments of $402.3 million, whereas total debt amounted to $9.58 billion. Cash flow from operating activities stood at $395.5 million during the quarter.
Valuation Methodology: P/E multiple based relative valuation (Illustrative)

P/E Based Valuation (Source: Thomson Reuters)
Note: All forecasted figures have been taken from Thomson Reuters, NTM: Next Twelve Months
Stock Recommendation: The stock of MCHP closed at $80.34 with a market capitalization of ~$19.7 billion. The stock made a 52-week low and high of $53.15 and $112.47 and is currently quoting close to the average of the range. Thestock witnessed a sharp correction of 26.57% and 19.07% in the three months and one year, respectively. Considering the operational excellence, focused execution, outlook and current trading level, we have valued the stock using P/E multiple based illustrative relative valuation method and arrived at a target price of lower double-digit upside (in % terms). For the purpose, we have considered peers like Texas Instruments Inc (NYSE: TXN), NXP Semiconductors NV (NASDAQ: NXPI), and Intel Corp (NASDAQ: INTC). Hence, we see potential in the stock and recommend a "Buy" rating at the closing price of $80.34, up 3.8% on 17 April 2020.
Thermo Fisher Scientific Inc.
COVID-19 Update: Thermo Fisher Scientific Inc. (NYSE: TMO) is engaged in manufacturing scientific instruments and is a global leader in serving science. On 6 April 2020, the company stated that it withdrew its previously announced outlook for FY20 due to the evolving impact of COVID-19 pandemic. Given the current scenario, the company witnessed reduction in customer activity by the end of March. In another update, the company announced the accessibility of the newest quality-control product, AcroMetrix Coronavirus 2019 (COVID-19) RNA Control. The latest product is utilized to examine and authenticate COVID-19 molecular diagnostic tests. Additionally, Thermo Fisher obtained the CE mark in the European Union to test and detect nucleic acid from SARS-CoV-2. Notably TMO is set to report its first quarter FY20 results on 22 April 2020.
4QFY19 Financial Highlights for the Period ended 31 December 2019: During the quarter, the company reported adjusted EPS of $3.55, up ~9% year over year. The company reported revenues of$6.83 billion, up 5% from the prior corresponding period. Organic revenues for the quarter increased 5% year over year. Nevertheless, currency translation negatively impacted total revenues by a slight 1%. The company exited the period with a cash balance of $2.34 billion.
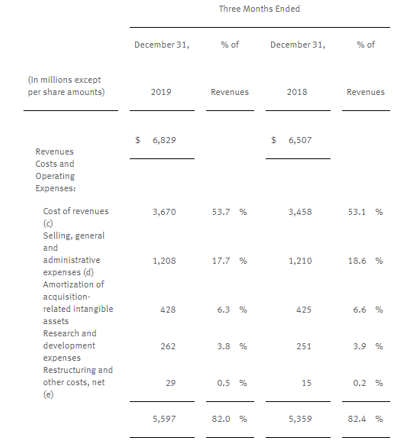
Revenue Details (Source: Company Reports)
Valuation Methodology: P/E multiple based relative valuation method (Illustrative)
.JPG)
P/E Based Valuation (Source: Thomson Reuters)
Note: All forecasted figures have been taken from Thomson Reuters, NTM: Next Twelve Months
Stock Recommendation: The stock of TMO closed at $331.58 with a market capitalization of ~$130.9 billion. The stock made a 52-week low and high of $250.21 and $342.26 and is currently quoting at the upper band of its trading range. Thestock witnessed positive returns of 11.9% and 28.76% in the last one month and one year, respectively. The company remains on track to expand its production capacity at North America and Europe facilities to benefit from the robust demand for biologics and gene therapies. However, decline in gross margin in the fourth quarter remains a headwind .Considering the operational excellence, focused execution, outlook and current trading level, we have valued the company using P/E multiple based illustrative relative valuation method and arrived at a target price with a correction of lower single-digit (in % terms). For the purpose, we have considered peers like Waters Corp (NYSE: WAT), Agilent Technologies Inc (NYSE: A), and Danaher Corp (NYSE: DHR). Hence, we give an “Expensive” rating on the stock at the closing price of $331.58 (up 0.83% on 17 April 2020) and suggest investors should wait for better entry levels.
Costco Wholesale Corporation
COST Declares $4 Billion Senior Notes Offering: Costco Wholesale Corporation (NASDAQ: COST) is engaged in selling high volumes of foods and general merchandise at reduced prices via membership warehouses. It is one of the biggest warehouse club operators in the US. On 16th April 2020, the company announced the pricing of its senior notes offering worth $4 billion aggregate principal amount. The company plans to use the net proceeds from the offering to repay its $1 billion and $500 million aggregate principal amounts of senior notes due, along with utilizing the remaining amount for general corporate purposes. Notably, COST is set to report its FY20 fourth quarter results on 6 May 2020.
Key Highlights for March Quarter Sales: Recently, the company announced that it has reported net sales of $15.49 billion for the month of March, for the five weeks ended April 5, 2020. The figure soared 11.7% from $13.87 billion reported in the previous year. Further, for the thirty-one weeks ended April 5, 2020, COST reported net sales of $96.25 billion, up 9% year over year.
Other Recent Updates: In another update, the company announced that it has completed the acquisition of Innovel Solutions for a consideration of $1 billion, which was funded from its current cash balances.
3QFY20 Financial Highlights for the Period ended 16 February 2020: During the quarter, the company reported earnings of $2.10 per share, up 4.5% from the year-ago quarter figure. Total revenues for the quarter stood at $39,072 million, an increase 10.4% year over year. The company exited the quarter with cash and cash equivalents of $7,786 million and long-term debt amounted to $5,099 million.
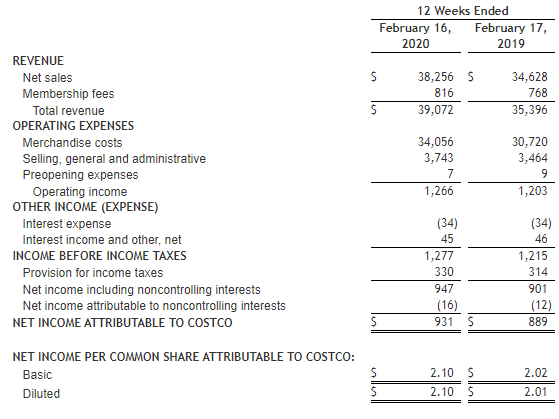
Key Financial Highlight (Source: Company Reports)
Valuation Methodology: P/E Multiple Based Valuation
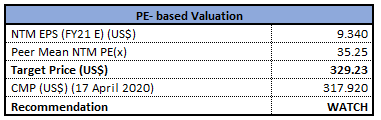
P/E Based Valuation (Source: Thomson Reuters)
Note: All forecasted figures have been taken from Thomson Reuters, NTM: Next Twelve Months
Stock Recommendation: The stock of COST closed at $317.92 with a market capitalization of ~$140.4 billion. The stock made a 52-week low and high of $233.05 and $325.26 and is currently quoting at the upper band of its trading range. Thestock witnessed positive returns of 3.56% and 29.47% in the last one month and one year, respectively. Considering the operational excellence, focused execution, outlook and current trading level, we have valued the stock using P/E multiple based illustrative relative valuation method and arrived at a target price of limited upside (in % terms). For the purpose, we have considered peers like Walmart Inc (NYSE: WMT), Target Corp (NYSE: TGT), and Dollar General Corp (NYSE: DG). Hence, we have a watch stance on the stock at the current market price of $317.92, down 1.13% as on 17 April 2020.
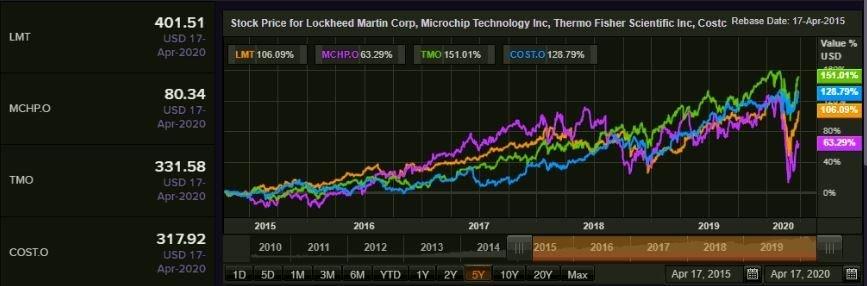
Comparative Price Chart (Source: Thomson Reuters)
Disclaimer
The advice given by Kalkine Pty Ltd and provided on this website is general information only and it does not take into account your investment objectives, financial situation or needs. You should therefore consider whether the advice is appropriate to your investment objectives, financial situation and needs before acting upon it. You should seek advice from a financial adviser, stockbroker or other professional (including taxation and legal advice) as necessary before acting on any advice. Not all investments are appropriate for all people. Kalkine.com.au and associated pages are published by Kalkine Pty Ltd ABN 34 154 808 312 (Australian Financial Services License Number 425376). The information on this website has been prepared from a wide variety of sources, which Kalkine Pty Ltd, to the best of its knowledge and belief, considers accurate. You should make your own enquiries about any investments and we strongly suggest you seek advice before acting upon any recommendation. Kalkine Pty Ltd has made every effort to ensure the reliability of information contained in its newsletters and websites. All information represents our views at the date of publication and may change without notice. To the extent permitted by law, Kalkine Pty Ltd excludes all liability for any loss or damage arising from the use of this website and any information published (including any indirect or consequential loss, any data loss or data corruption). If the law prohibits this exclusion, Kalkine Pty Ltd hereby limits its liability, to the extent permitted by law to the resupply of services. There may be a product disclosure statement or other offer document for the securities and financial products we write about in Kalkine Reports. You should obtain a copy of the product disclosure statement or offer document before making any decision about whether to acquire the security or product. The link to our Terms & Conditions has been provided please go through them and also have a read of the Financial Services Guide. On the date of publishing this report (mentioned on the website), employees and/or associates of Kalkine Pty Ltd do not hold positions in any of the stocks covered on the website. These stocks can change any time and readers of the reports should not consider these stocks as personalised advice.
 AU
AU

 Please wait processing your request...