Lyft, Inc.
.png)
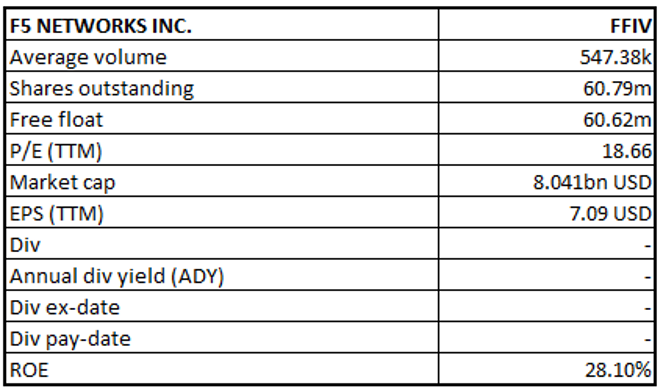
LYFT Details
Reported Robust Top-line Growth:Lyft, Inc. (NASDAQ: LYFT) operates within the transportation services business and provides affordable rental car facilities to the riders.
Q3FY19 Financial Highlights for the Period ended 30 September 2019:LYFT announced its quarterly results, wherein the company reported revenue of $955.59 million, as compared to $584.95 million. Active Riders came in at 22.314 million, up 28% from Q3FY18. Revenue per active rider stood at $42.82 as compared to $33.63 in previous corresponding period. The company reported a net loss of $463.5 million as compared to a net loss of $249.2 million in previous corresponding period. Research and development expenses during the quarter stood at $288.27 million as compared to $77.17 million in previous corresponding period. The increase was on the back of higher stock-based compensation expense driven by costs related with RSUs.General and administrative expense stood at $263.820 million as compared to $120.348 million in Q3FY18. The company exited the quarter with cash and cash equivalents of $543.871 million.
.png)
Q3FY19 Income Statement Highlights (Source: Company Reports)
Outlook:For Q4FY19 guidance, the company forecasts its revenue in the range of $975 million to $985 million, which represents a growth of 46% and 47% on y-o-y basis. The management expects adjusted EBITDA loss to be between $160 million to $170 million. FY19 revenue is expected in the range of $3.57 billion and $3.58 billion, representing a growth of ~66% from FY18.
Valuation Methodology: Enterprise Value to Sales Multiple Approach
.png)
Enterprise Value to Sales Based Valuation (Source: Thomson Reuters)
Note: All forecasted figures and peers have been taken from Thomson Reuters, NTM-Next Twelve Months
Stock Recommendation: The stock is quoting at $47.47 with a market capitalization of ~$14.131 billion. Currently, the stock is trading below its 52-week low-high of $37.07 and $88.60. The company reported stellar third-quarter results, driven by robust growth across active riders and revenue per active rider.Considering, the current trading levels, improved guidance, increase in average revenue per user, and business prospects, we have valued the stock using one relative valuation method, i.e., Enterprise Value to Sales based approach. For this, we have taken peers like Uber Technologies Inc (NASDAQ: UBER), Amazon.com Inc (NASDAQ: AMZN), Alphabet Inc (NASDAQ: GOOGL), etc., and arrived at a target price of lower double-digit upside (in percentage terms). Hence, we recommend a ‘Buy’ rating on the stock at the current market price of $47.47, down 1.06% as on 22 January 2020.
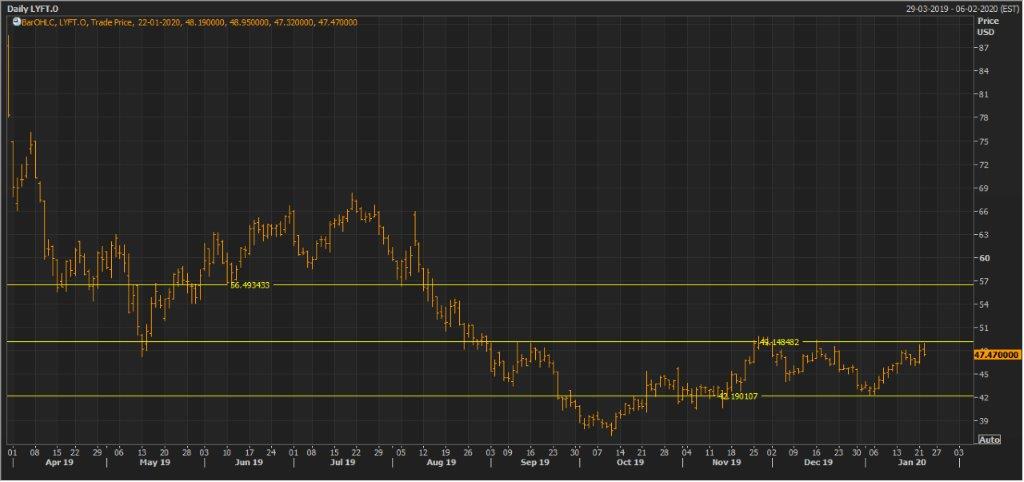
LYFT Daily Price Chart (Source: Thomson Reuters)
Dropbox, Inc.
DBX Details
Growing Subscribers to Aid Business Prospects: Dropbox, Inc. (NASDAQ: DBX) provides smart workplace services by using cloud-based technology where customers can store their necessary files and folders. The company has its operations in more than 180 countries with over 600 million registered users.
Q3FY19 Operational Highlights for the Period ended 30 September:DBX declared its quarterly results, wherein the company reported total revenue of $428.2 million, as compared to $360.3 million in previous corresponding period. Total paying users stood at 14.0 million as of September 30, 2019 as compared to 12.3 million at the end previous corresponding period. Average revenue per user stood at $123.15 as compared to $118.60 in Q3FY18. Gross margin on non-GAAP basis came in at 76.7% as compared to 75.9% reported in Q3FY18. Research & development expenses (R&D) came in at $172.8 million as compared to $133.2 million in previous corresponding period. As a percentage of revenue, R&D expense stood at 40.4% in Q3FY19, higher from 37% reported in Q3FY18. Sales and marketing expenses stood at $108.2 million, as compared to $95 million reported in 3QFY18. DBX reported a net loss of $17.0 million as compared to $5.8 million in Q3FY18. The company existed the quarter with cash and cash equivalent of $443.2 million and total assets of $2,486.6 million.
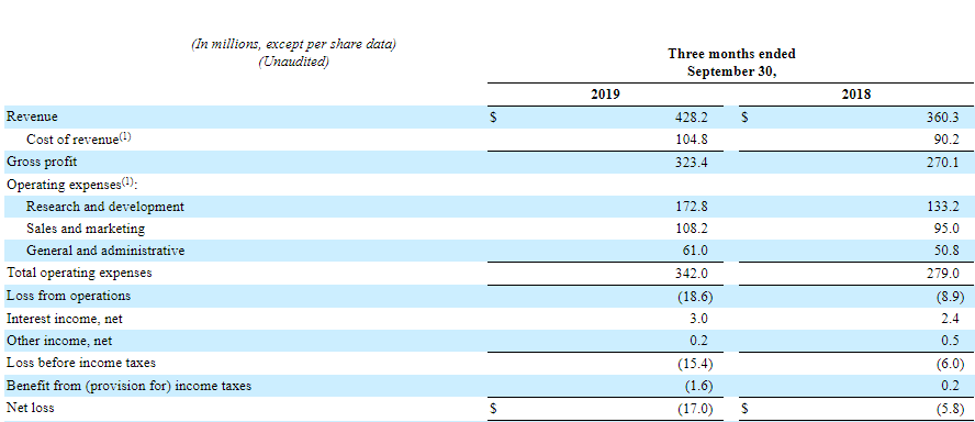
Q3FY19 Income Statement highlights (Source: Company Reports)
Guidance:In the coming quarter, the company expects revenue in the range of 442 million to $444 million, while the non-GAAP operating margin is expected within the range of 14% to 15%. The business anticipates FY19 revenue to be between $1,657 million to $1,659 million. Non-GAAP operating margin is forecasted at around ~12% for FY19. The company expects its capital expenditure within the range of $65 million to $75 million in FY19. Free cash flow is anticipated within the range of $375 million to $385 million for FY19.
Valuation Methodology: Price to Earnings Multiple Approach
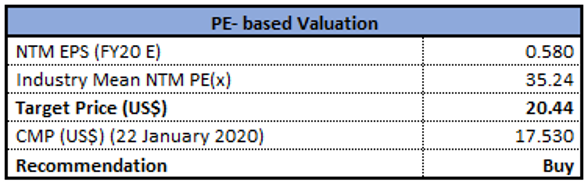
Price to Earnings Based Valuation (Source: Thomson Reuters)
Note: All forecasted figures and peers have been taken from Thomson Reuters, NTM-Next Twelve Months
Stock Recommendation:The stock of DBX is quoting at $17.53 with a market capitalization of $7.280 billion. The stock is trading at the lower band of its 52-week trading range of $16.08 to $26.49. The quarter was marked by strong growth within the new desktop application segment. The company witnessed robust revenue growth and margin expansions in 3QFY19. The company is focusing to build first cloud-based workplace application, which would enable its subscribers to store files and folders. Considering the above factors, we have valued the stock using one relative valuation method, i.e., Price to Book multiple. and arrived at a target price with lower double-digit upside in % terms. For the above valuation, we have taken the peer group – Salesforce.com (NASDAQ: CRM), Microsoft Corp. (NASDAQ: MSFT), Oracle Corp (NASDAQ: ORCL), etc., and arrived at a target price with lower double-digit upside in % terms. Hence, we give a “Buy” rating on the stock at the current market price of $17.53 per share, down 0.62% on 22 January 2020.
.jpg)
DBX Daily Price Chart (Source: Thomson Reuters)
F5 Networks, Inc.
FFIV Details
Acquisition of Shape Security to Aid Business Growth: F5 Networks, Inc. (NASDAQ: FFIV)powers applications from development through their entire lifecycle, across any multi-cloud environment, to provide customers with differentiated, high-performing, and secure digital experiences. Recently, the company announced that it will purchase all outstanding shares of Shape Security for a total enterprise value of ~$1 billion.
FY19 Operational Highlights for the Period ended 30 September 2019: FFIV announced its full year results, wherein the company reported revenue at $2,242.447 million as compared to $2,161.407 million in FY18. Gross profit was reported at $1,885.87 million as compared to $1,799.926 million in previous financial year. Sales and marketing expense stood at $748.619 million as compared to $664.135 million in FY18. The company reported net income at $427.734 million as compared to $453.689 million in FY18. The company exited FY19 with a cash balance of $599.219 million and a total asset of $3,390.275 million.
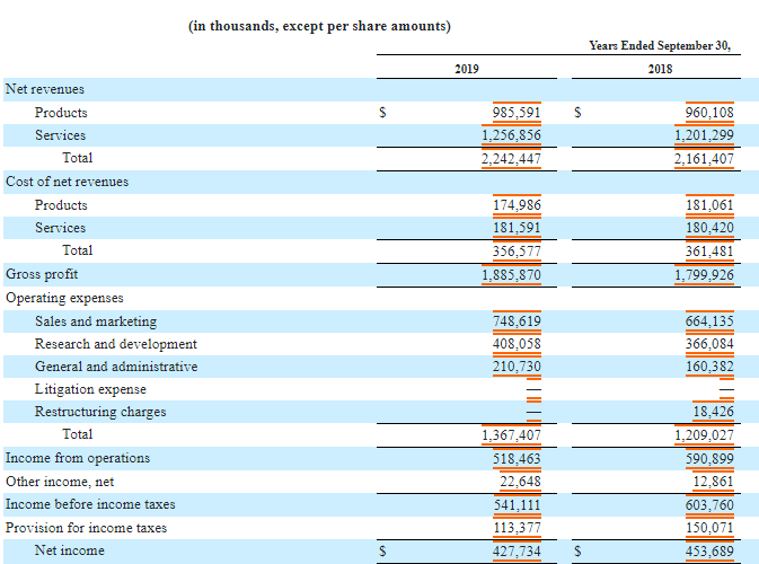
FY19 Income Statement Highlights (Source: Company Reports)
Valuation Methodology: Price to Earnings Multiple Approach

Price to Earnings Based Valuation (Source: Thomson Reuters)
Note: All forecasted figures and peers have been taken from Thomson Reuters, NTM-Next Twelve Months
Stock Recommendation:The stock of FFIV is quoting at $132.28 with a market capitalization of $8.041 billion. The stock is trading at the lower band of its 52-week trading range of $121.36 to $173.44. The acquisition of Shape will aid F5 Networks to save billions of dollars from fraud, reputational damage and disruptions to critical online services by strengthening its application security capabilities. Considering the above factors, we have valued the stock using one relative valuation method, i.e., Price to Earnings multiple. For the above valuation, we have taken the peer group – Cisco Systems Inc (NASDAQ: CSCO), VMware Inc (NASDAQ: VMW), Akamai Technologies Inc (NASDAQ: AKAMA), etc., and arrived at a target price with lower double-digit upside in % terms. Hence, we give a “Buy” rating on the stock at the current market price of $132.28 per share, down 2.04% on 22 January 2020.
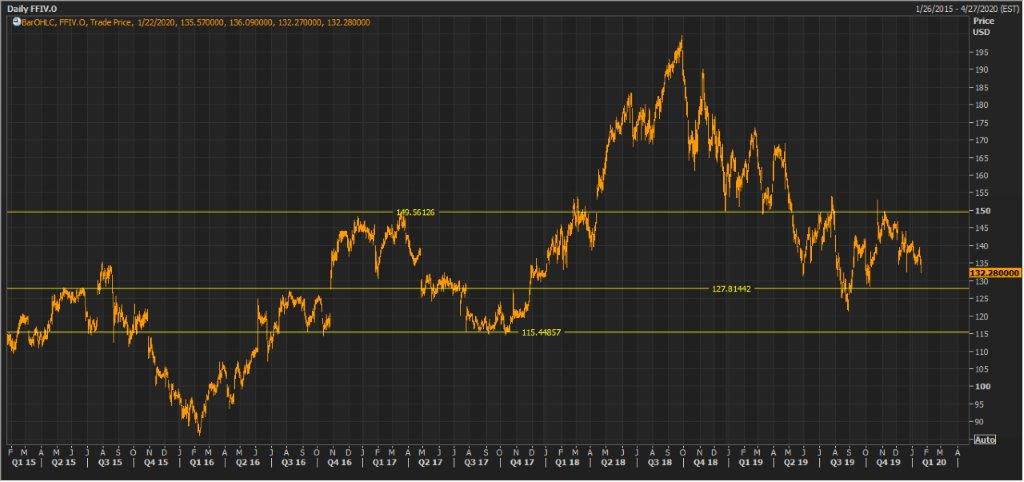
FFIV Daily Price Chart (Source: Thomson Reuters)
Disclaimer
The advice given by Kalkine Pty Ltd and provided on this website is general information only and it does not take into account your investment objectives, financial situation or needs. You should therefore consider whether the advice is appropriate to your investment objectives, financial situation and needs before acting upon it. You should seek advice from a financial adviser, stockbroker or other professional (including taxation and legal advice) as necessary before acting on any advice. Not all investments are appropriate for all people. Kalkine.com.au and associated pages are published by Kalkine Pty Ltd ABN 34 154 808 312 (Australian Financial Services License Number 425376). The information on this website has been prepared from a wide variety of sources, which Kalkine Pty Ltd, to the best of its knowledge and belief, considers accurate. You should make your own enquiries about any investments and we strongly suggest you seek advice before acting upon any recommendation. Kalkine Pty Ltd has made every effort to ensure the reliability of information contained in its newsletters and websites. All information represents our views at the date of publication and may change without notice. To the extent permitted by law, Kalkine Pty Ltd excludes all liability for any loss or damage arising from the use of this website and any information published (including any indirect or consequential loss, any data loss or data corruption). If the law prohibits this exclusion, Kalkine Pty Ltd hereby limits its liability, to the extent permitted by law to the resupply of services. There may be a product disclosure statement or other offer document for the securities and financial products we write about in Kalkine Reports. You should obtain a copy of the product disclosure statement or offer document before making any decision about whether to acquire the security or product. The link to our Terms & Conditions has been provided please go through them and also have a read of the Financial Services Guide. On the date of publishing this report (mentioned on the website), employees and/or associates of Kalkine Pty Ltd do not hold positions in any of the stocks covered on the website. These stocks can change any time and readers of the reports should not consider these stocks as advice or recommendations.
 AU
AU

 Please wait processing your request...