.png)
Stocks’ Details
Integrated Research Limited
Revenues up 6% Year over Year: Integrated Research Limited (ASX: IRI) is involved in the development, designing, execution and sale of systems and applications management computer software. Recently, the company announced that it will distribute a dividend of $0.03500000per share on the security, IRI - ORDINARY FULLY PAID, with an ex-date of February 27, 2020 and payment date of April 21, 2020.
1HFY20 Key Highlights for the Period Ended 31st December 2019: Revenue for 1HFY20 came in at $53.2 million, rising 6% year over year and came within the management guided range of $52.5 million to $53.5 million. EBITDA for the year came in at $20.6 million, decreasing slightly 1% in comparison to the previous year. Net profit after tax stood at $11.8 million, representing growth of 1% on the previous year and came within the management guided range of $11.5 million to $12.0 million. This was mainly due to a strong performance in new licence sales, which grew by 7% to $33.4 million. The company returned a decent amount to its shareholders, in the form of a fully franked interim dividend amounting to 3.5 cents per share. The company also reported a strong balance sheet with total cash of $7.6 million and no debt at the end of the quarter.
.png)
1HFY20 Key Metrics (Source: Company Reports)
What to Expect: For FY20, the company expects profit growth in underlying operational performance amid fluctuations in currency exchange rates. The company has large contracts in place that will be key catalysts for future growth. Also, new customers win along with further renewal opportunities adds to the positives.
Valuation Methodology: P/CF Based Valuation
.png)
P/CF Based Valuation (Source: Thomson Reuters)
Note: All the forecasted figures are taken from Thomson Reuters, NTM: Next Twelve Months
Stock Recommendation: As per ASX, the stock of IRI gave a return of ~15% in the past six months. During FY19, ROE stood at 34.2%, higher than the industry median of 12.6%. In the same time span, net margin of the company stood at 21.7% as compared to the industry median of 14.2%. This indicates that the company is managing its costs well and is capable of converting its revenue into profits. Considering the returns, positive outlook and higher ROE, we have valued the stock using P/CF based relative valuation method and arrived at a target upside of lower double-digit (in percentage terms). For the said purposes, we have considered Infomedia Ltd (ASX: IFM), Webjet Ltd (ASX: WEB), and Gentrack Group Ltd (ASX: GTK) as peers. Hence, we recommend a “Buy” rating on the stock at the current market price of $2.94, down 0.339% as on 20 February 2020.
Bravura Solutions Limited
Growth in Funds Administration Segment a Key Positive: Bravura Solutions Limited (ASX: BVS) is involved in the business of software-based products and services used in the wealth management and funds administration.Recently, the company announced a dividend of $0.05500000per share with an ex-date of March 3, 2020 and payment date of March 27, 2020.
1HFY20 Key Highlights for the Period Ended 31st December 2019: BVS declared its half-year results, wherein the company reported revenue of $135.1 million, depicting a growth of 6% on y-o-y basis. EBITDA came in at $25.5 million, up 7% from 1HFY19. EBITDA margin stood at 18.8% as compared to 18.6% in 1HFY19. The company reported NPAT at $19.8 million, up 21% year over year. NPAT margin improved to 14.6% from 12.8% in 1HFY19. Revenue from Wealth Management segment grew by 1% to $91 million during the period. Funds Administration revenue grew by 19% on y-o-y basis followed by an EBITDA growth of 44% as compared to pcp.
.png)
1HFY20 Income Statement Highlights (Source: Company Reports)
Outlook: As per the Management guidance for FY20, the business expects the sales pipeline to remain strong and NPAT to grow at the mid-teens. Acquisitions are expected to make a further contribution of approximately $3 million of FY20 NPAT.
Valuation Methodology: Price to Earnings Based Valuation
.png)
Price to Earnings Based Valuation (Source: Thomson Reuters)
Note: All forecasted figures and peers have been taken from Thomson Reuters, NTM-Next Twelve Months
Stock Recommendation: The stock of BVS is trading at $5.78 per share with a market capitalization of ~$1.32 billion. At the current market price, the stock is quoting at the upper band of its 52-week trading range of $3.730 to $6.270. The stock has generated positive return of ~17% in the last six months. The company’s ongoing investment in product development, deep market knowledge and expertise, sound business model, are the key positives. Considering the aforesaid facts, we have valued the stock using Price to Earnings based relative valuation model. For the matter, we have taken the peer group - Hub24 Ltd (ASX: HUB), Netwealth Group Ltd (ASX: NWL), TechnologyOne Ltd (ASX: TNE), to name few, and arrived at a target price of higher single-digit (in % terms). Hence, we recommend a “Hold” rating on the stock at the current market price of $5.78, up 7.037% as on 20 February 2020, on the back of robust 1HFY20 results.
Domain Holdings Australia Limited
Higher Investments & Cost Cutting Initiatives are Key Positives: Domain Holdings Australia Limited (ASX: DHG) is involved in the provision of real estate media and classified advertising services. Recently, the company announced that it will release 4,296,059 fully paid ordinary shares held under its voluntary escrow on 28 February 2020, in accordance with ASX Listing Rule3.10A.
1HFY20 Key Highlights for the Period Ended 31st December 2019: The company reported total revenue of $147 million, down 10.9% year over year. The company reported a net profit of $12.9 million as compared to $20.9 million in 1HFY19. EBIT during the period stood at $25 million, down 33.4% on y-o-y basis on account of higher depreciation and amortisation expenses. EBITDA for the period came in at $47 million, down 8.9% year over year. The company reported EPS of 2.22 cents per share, down 38.3% year over year. The company declared a dividend of 2 cents per share (100% franked).
.png)
1HFY20 Income Statement (Source: Company Reports)
Outlook: The company expects 2HFY20 operating costs to be flat to slightly up as compared to 2HFY19. The company remains on track to carry on with its cost cutting initiatives and invest in growth opportunities.
Valuation Methodology: Price to Cash Flow Based Valuation
.png)
Price to Cash Flow Based Valuation (Source: Thomson Reuters)
Note: All forecasted figures and peers have been taken from Thomson Reuters, NTM-Next Twelve Months
Stock Recommendation: The stock of DHG is trading at $3.55 with a market capitalization of ~$2.21 billion. At the current market price, the stock is quoting at the upper band of its 52-week trading range of $2.390 to $4.00. The stock has generated positive return of ~16.88% in the last six months. On the valuation front, the stock is trading at an EV/Sales multiple of 7.2x as compared to the industry average of 5.0x on TTM (Trailing Twelve Months) basis.Considering the latest results, valuation and aforesaid facts, we have a watch stance on the stock at the current market price of $3.55, down 6.332% on 20 February 2020, owing to tepid 1HFY20 results.
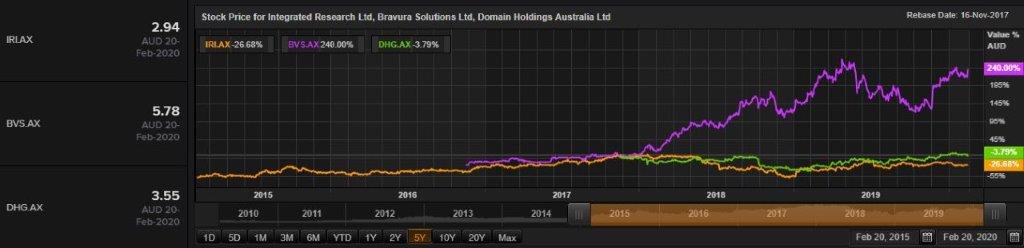
Comparative Price Chart (Source: Thomson Reuters)
Disclaimer
The advice given by Kalkine Pty Ltd and provided on this website is general information only and it does not take into account your investment objectives, financial situation or needs. You should therefore consider whether the advice is appropriate to your investment objectives, financial situation and needs before acting upon it. You should seek advice from a financial adviser, stockbroker or other professional (including taxation and legal advice) as necessary before acting on any advice. Not all investments are appropriate for all people. Kalkine.com.au and associated pages are published by Kalkine Pty Ltd ABN 34 154 808 312 (Australian Financial Services License Number 425376). The information on this website has been prepared from a wide variety of sources, which Kalkine Pty Ltd, to the best of its knowledge and belief, considers accurate. You should make your own enquiries about any investments and we strongly suggest you seek advice before acting upon any recommendation. Kalkine Pty Ltd has made every effort to ensure the reliability of information contained in its newsletters and websites. All information represents our views at the date of publication and may change without notice. To the extent permitted by law, Kalkine Pty Ltd excludes all liability for any loss or damage arising from the use of this website and any information published (including any indirect or consequential loss, any data loss or data corruption). If the law prohibits this exclusion, Kalkine Pty Ltd hereby limits its liability, to the extent permitted by law to the resupply of services. There may be a product disclosure statement or other offer document for the securities and financial products we write about in Kalkine Reports. You should obtain a copy of the product disclosure statement or offer document before making any decision about whether to acquire the security or product. The link to our Terms & Conditions has been provided please go through them and also have a read of the Financial Services Guide. On the date of publishing this report (mentioned on the website), employees and/or associates of Kalkine Pty Ltd do not hold positions in any of the stocks covered on the website. These stocks can change any time and readers of the reports should not consider these stocks as advice or recommendations.
 AU
AU
.jpg)
 Please wait processing your request...