.png)
Stocks’ Details
Ramsay Health Care Limited
Strong Operating Cash Flow to Deliver Improved Performance: Ramsay Health Care Limited (ASX: RHC) is engaged in the hospital business and provides a range of healthcare facilities across Australia, France, Indonesia, Malaysia and the United Kingdom.
H1FY20 Business Highlights for the Period ended 31st December 2019: RHC declared its half-yearly results, wherein the company reported operating revenue of $6,332.5 million, up 22.5%, driven by growth from all geographies. EBITDAR came in at $1.1 billion, depicted a growth of 17.4% on y-o-y basis, aided by lower operating lease expense. The period was marked by strong and consistent operating cash flow with cash conversion rate of 95%. The business continued good progress on changing its operating model in order to retain its margins.
.png)
Key Income Statement Highlights of H1FY20 (Source: Company Reports)
Outlook: For FY20, the company will continue to develop its hospital in the home strategy to provide community & home-based healthcare. The business is expected to deliver a brownfield program of ~$168 million in completed projects in FY20.
Valuation Methodology: Price to Earnings Multiple Based Relative Valuation
.png)
Price to Earnings Based Relative Valuation (Source: Thomson Reuters)
Note: All the forecasted figures are taken from Thomson Reuters, NTM: Next Twelve Months
Stock Recommendation:The stock of RHC is trading at $61.990 with a market capitalization of ~$13.26 billion. The stock made a 52-week low and high of $61.56 and $80.93 and is currently trading at the lower band of its 52-week trading range. The stock has generated positive returns of ~1.86% and ~3.13% in the last six months and one year, respectively. Thebusiness reported a strong balance sheet and is likely to focus on funding its pipeline of brownfield capacity expansion and future acquisitions. Considering the aforesaid facts, current trading levels and business prospects, we have valued the stock using Price to Earnings based relative valuation method. For the purpose, we have considered peers like CSL Ltd (ASX: CSL), Cochlear Ltd (ASX: COH), Resmed Inc (ASX: RMD), etc., and arrived at a target price with a lower double-digit upside (in % terms). Hence, we give a ‘Buy’ recommendation on the stock at the closing price of $61.990, down 5.561% as on 9th March 2020.
Ansell Limited
Improved Performance within EMEA Segment Resulted in Overall Growth: Ansell Limited (ASX: ANN) is a leading provider of superior health and safety protection solutions that enhanced human well-being. On 09th March 2020, the company informed that Ansell Limited has bought back a total of 1,085,243 ordinary shares at a consideration of $31,507,031.1.
H1FY20 Operational Highlights for the Period ended 31 December 2019: ANN came up with its half-yearly results, wherein the company reported sales of $753.3 million, up 3.9% on pcp terms, aided by 2.4% organic revenue growth on account of continued HGBU momentum of 3.4% and improved IGBU performance of 1.3% on pcp terms. Statutory EBIT stood at $91.8 million, up 51.2% on pcp. The business witnessed improvement in EBIT margins due to Gross Profit After Distribution Expenses (GPADE) benefits from Transformation program, sales mix and favorable raw material costs, which was offset by FX impacts and Selling General & Administrative costs.
.png)
H1FY20 Key Financial Highlights (Source: Company Reports)
Valuation Methodology: Price to Earnings Multiple Based Relative Valuation
.png)
Price to Earnings Based Relative Valuation (Source: Thomson Reuters)
Note: All the forecasted figures are taken from Thomson Reuters, NTM: Next Twelve Months
Stock Recommendation:The stock of ANN is trading at $27.09 with a market capitalization of ~$3.6 billion. The stock made a 52-week low and high of $24.34 and $33.43 and is currently trading at the lower band of its 52-week trading range. The stock has generated positive returns of ~0.58% and ~10.19% in the last six months and one year, respectively. Recovery within the industrial segment, primarily in EMEA along with solid performance from Healthcare has resulted in improved performance during H1FY20.Considering the aforesaid facts, current trading levels and growth within the EMEA segment, we have valued the stock using Price to Earnings based relative valuation method. For the purpose, we have considered peers like Cochlear Ltd (ASX: COH), Sonic Healthcare Ltd (ASX: SHL), Ramsay Health Care Ltd (ASX: RHC), etc., and arrived at a target price with a limited downside (in % terms). Hence, we have a wait and watch stance on the stock at the closing price of $27.09, down 2.132% as on 9th March 2020.
Medlab Clinical Limited
Advance Trial of NanaBis™ to Aid Business Prospects: Medlab Clinical Limited (ASX: MDC) is a medical life science company, developing therapeutic pathways for diagnosed chronic diseases. On 09th March 2020, the company informed that it has received the results from an Independent Reviewer for the NanaBis™ advanced cancer pain trial conducted at the Royal North Shore Hospital (RNSH).
Q2FY20 Operational Highlights for the Period ended 31 December 2019: MDC declared its half-yearly results, wherein the company reported a 400% growth in its sales on pcp terms coupled with 29% growth in collections, which stood at of $1.641 million. During the period, the company reported recruitment of 125 Australian Doctors and 250 patients. Product from NanaBis™ demonstrated revenue growth of 262% on y-o-y basis. The number of bottles dispensed for the quarter stood over 2,000 bottles.
.png)
Snapshot of NanaBis™ Volume (Source: Company Reports)
Outlook: For FY20, the company expects its sales performance to be enhanced further, on account of the recently announced production move to Tasmanian Alkaloids Pty Ltd.
Stock Recommendation:The stock of MDC is trading at $0.240 with a market capitalization of ~$53.64 million. The stock made a 52-week low and high of $0.205 and $0.560 and is currently trading at the lower band of its 52-week trading range. The stock has corrected ~36.11% and ~52.08% in the last three months and six months, respectively. The business met the primary and secondary regulatory endpoints for its upcoming drug NanaBis™, used for cancer patients, which is expected to generate significant commercial opportunities. Considering the aforesaid facts, current trading levels and business prospects, we recommend a ‘Speculative Buy’ rating on the stock at the closing price of $0.240, up 4.348% as on 9th March 2020, due to results from advance research trials for NanaBis™.
Zoono Group Limited
Lower Net Loss Driven by Higher Revenue and Lower Operating Expenses: Zoono Group Limited (ASX: ZNO) is engaged in the development and marketing of antimicrobial products across the globe. Recently the company informed that it has received a report for the laboratory tests undertaken against COVID-19. As per the results, the company’s Z-71 Microbe Shield is > 99.99% effective against COVOID-19.
1HFY20 Operational Highlights for the Period ended 31 December 2019: ZNO announced its half-yearly results, wherein the company posted its revenue of NZ$1.71 million, up by 144% year over year on the driven by higher orders received from current and new distributors. The company reportedGross Profit of NZ$893,443, up from NZ287,233 in pcp, driven by higher operating revenues and margins from bulk product sales.Net loss after tax for the period stood at NZ$0.73 million, as compared to a net loss of NZ$1.38 million in H1FY19. The period was marked by lower employee costs and director fees, along with higher selling and marketing expenses.
.png)
H1FY20 Income Statement Highlights (Source: Company Reports)
Stock Recommendation:The stock of ZNO is trading at $1.64 with a market capitalization of ~$316.83 million. The stock made a 52-week low and high of $0.063 and $2.440 and is currently trading at the upper band of its 52-week trading range. The stock has delivered exuberant returns of 708.33% and 2795.52% in the last three months and six-months, respectively. The business remains in a healthy cash position, driven by the increased demand for its products experienced in the current half year. Considering the aforesaid facts, current trading levels and business prospects, we have a watch stance on the stock at the closing price of $1.640, down 15.464% as on 9th March 2020.
Holista Colltech Limited
Significant Improvement in Net Loss:Holista Colltech Limited (ASX: HCT) is abio-industrial company dedicated to the development and marketing of food ingredients and ovine collagen for cosmetic and biomedical applications.
FY19 Operational Highlights for the Period ended 31st December 2019: HCT declared its full-year results, wherein the company posted revenue of $7,257,778, down 8.6% from FY18. The company has upgraded its operating capacity of the Group’s collagen plant in Collie, Perth, which resulted in a 114% increase in revenue for this segment to $460,750 in FY19 from $215,068 in FY18.The business reported a lower net loss of $785,908, depicting an improvement from a loss of $2,203,360 reported in FY18, driven by lower employment costs, other expenses and impairment recovery.
.png)
FY19 Income Statement Highlights (Source: Company Reports)
Stock Recommendation:The stock of HCT is trading at $0.130 with a market capitalization of ~$43.05 million. The stock has made a 52-week low and high of $0.037 and $0.235 and is currently trading close to the average of its 52-week trading range. The stock has delivered a robust return of 97.53% and 207.69% in the last three months and six-months, respectively. The company’s cosmetic-grade collagen reported strong traction and is expected to deliver higher value-added products through increasing specifications. Considering the above factors, we have a wait and watch stance on the stock at the closing price of $0.130, down 18.75% as on 9th March 2020.
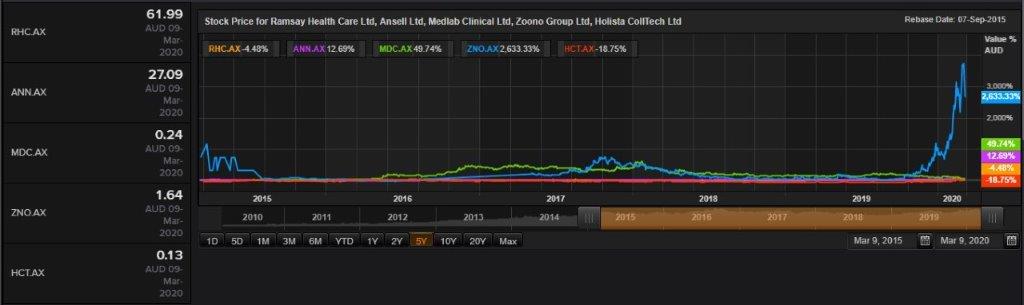
Comparative Price Chart (Source: Thomson Reuters)
Disclaimer
The advice given by Kalkine Pty Ltd and provided on this website is general information only and it does not take into account your investment objectives, financial situation or needs. You should therefore consider whether the advice is appropriate to your investment objectives, financial situation and needs before acting upon it. You should seek advice from a financial adviser, stockbroker or other professional (including taxation and legal advice) as necessary before acting on any advice. Not all investments are appropriate for all people. Kalkine.com.au and associated pages are published by Kalkine Pty Ltd ABN 34 154 808 312 (Australian Financial Services License Number 425376). The information on this website has been prepared from a wide variety of sources, which Kalkine Pty Ltd, to the best of its knowledge and belief, considers accurate. You should make your own enquiries about any investments and we strongly suggest you seek advice before acting upon any recommendation. Kalkine Pty Ltd has made every effort to ensure the reliability of information contained in its newsletters and websites. All information represents our views at the date of publication and may change without notice. To the extent permitted by law, Kalkine Pty Ltd excludes all liability for any loss or damage arising from the use of this website and any information published (including any indirect or consequential loss, any data loss or data corruption). If the law prohibits this exclusion, Kalkine Pty Ltd hereby limits its liability, to the extent permitted by law to the resupply of services. There may be a product disclosure statement or other offer document for the securities and financial products we write about in Kalkine Reports. You should obtain a copy of the product disclosure statement or offer document before making any decision about whether to acquire the security or product. The link to our Terms & Conditions has been provided please go through them and also have a read of the Financial Services Guide. On the date of publishing this report (mentioned on the website), employees and/or associates of Kalkine Pty Ltd do not hold positions in any of the stocks covered on the website. These stocks can change any time and readers of the reports should not consider these stocks as advice or recommendations.
 AU
AU

 Please wait processing your request...