National Australia Bank Limited
.png)
NAB Details
Focus on Technology Upgrade is a Key Positive: National Australia Bank Limited (ASX: NAB) is a leading bank in Australia, which has a market capitalisation of $76.31 Bn as on 28 February 2020. Recently, the company announced that post the successful completion of the Bookbuild, the NAB Capital Notes 4 Offer will rise from $750 million to a minimum of $1.95 billion.
First Quarter FY20 Trading Update:For Q1FY20, the company reported unaudited statutory net profit amounting to $1.70 billion with unaudited cash earnings of $1.65 billion. With respect to asset quality, the bank experienced a decline of 21% in credit impairment charges to $185 million.As at 31st December 2019, the CET1 ratio of the group stood at 10.6%, against 10.4% as at September 2019, which includes underwriting proceeds of $0.7 billion of 2H FY19, from the Dividend Reinvestment Plan.
.png)
1QFY20 Highlights (Source: Company Reports)
What to Expect: The company remains on track by continuing its work to refresh its strategy as well as to build a plan for the next five to ten years. Further, NAB is focusing on its frontline technology upgrades with an increased focus on tech foundations, processes and capabilities.
Valuation Methodology:P/BV Based Valuation
.png)
P/BV Based Valuation (Source: Thomson Reuters)
Note: All forecasted figures and peers have been taken from Thomson Reuters, NTM: Next Twelve Months
Stock Recommendation: The stock posted a positive return of ~5.37% on a year-to-date bias and is currently trading below the average of its 52-week low and high of $23.89 and $30.00, respectively. The stock has a price to earnings multiple of 15.36x and an annual dividend yield of 6.41%.We have valued the stock using the P/BV based relative valuation method and arrived at a target price, which is offering an upside of lower double-digit (in percentage terms). Therefore, taking the sound performance in Q1 FY20, focus for future and valuation parameters into account, we give a “Buy” recommendation on the stock at the current market price of $25.10 per share, down by 3.051% on 28 February 2020.
.jpg)
NAB Daily Technical Chart (Source: Thomson Reuters)
Nearmap Ltd
.png)
NEA Details
ACV up ~23% Year over Year in 1HFY20: Nearmap Ltd (ASX: NEA) is involved in the provisioning of geospatial map technology for enterprises, businesses, and government customers. Recently, the company stated thatSusan Marie Klose, one of the Directors of the company, has acquired 100,000 Fully Paid Ordinary Shares for the consideration of $184,703.40.
1HFY20 Key Highlights for the Period Ended 31 December 2019:For the period, the company experienced a rise of 23% in Annualised Contract Value (ACV), which amounted to $96.6 Mn. Statutory revenue rose by 31% year over year and stood at $46.3 million.
.png)
Annualised Contract Value (Source: Company Reports)
Revised Guidance for ACV: For FY20, the company is expecting ACV in the range of $102 Mn-$110 Mn as compared to the previous guidance range of $116Mn-$120 Mn. The company is optimistic that it would continue to deliver ACV growth of 20%-40% in the medium to long term.
Valuation Methodology:EV/Sales Based Valuation
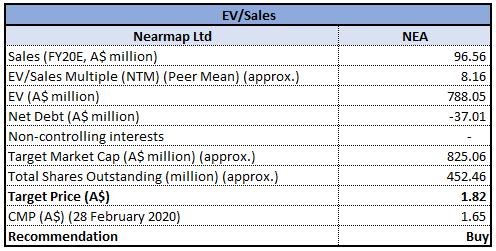
EV/Sales Based Valuation (Source: Thomson Reuters)
Note: All forecasted figures and peers have been taken from Thomson Reuters, NTM-Next Twelve Months
Stock Recommendation: The stock has a market capitalisation of $787.28 Mn as on 28 February 2020and is currently trading close to its 52-week low level of $1.600. On the TTM Basis, the stock of NEA is trading at an EV/Sales multiple of 8.6x, lower than the industry median (Software and IT Services) of 52.1x. Therefore, considering the decent growth in ACV and a rise in liquidity position, we give a “Buy” recommendation on the stock at the current market price of $1.645 per share, down 5.46% on 28 February 2020.
.jpg)
NEA Daily Technical Chart (Source: Thomson Reuters)
Pushpay Holdings Limited
.png)
PPH Details
Revenues up 30% Year over Year: Pushpay Holdings Limited (ASX: PPH) offers a donor management system to the trust sector, NPOs, and education providers. The company recently notified that Kabouter Management, LLC, a substantial shareholder of the company, has increased its voting power from 5.016% to 6.361%.
Half-Yearly Results for the Period Ended 30 September 2019: Total revenue for the period amounted to US$57.4 million, up by 30% year over year from revenue of US$44.0 million reported in the year-ago period. The increase was on the back of targeted implementation of strategy, investment into product design and development, and growing team capabilities and expertise. Gross margin for the period improved by eight percentage points y-o-y and stood at 65%. Total processing volume increased 45% year over year and the same is expected to grow further due to a large proportion of new, medium and large customers, increased operations in the US, and additional development of the product set to promote higher adoption and usage.
.png)
Income Statement (Source: Company Reports)
What to Expect: Operating revenue for the year ending 31 March 2020 is projected to be in the ambit of US$121.0 million – US$124.0 million, with a gross margin of more than 63%. EBITDAF is expected to be in the range of US$23.0 million – US$25.0 million. Total processing volume for the period is expected to be in the ambit of US$4.8 billion – US$5.0 billion. Going forward, the company is targeting to gain market share to maximise shareholder value. It is also eyeing for potential acquisitions that can enhance significant value to the current business.
Valuation Methodology:EV/Sales Based Valuation
.png)
EV/Sales Based Valuation (Source: Thomson Reuters)
Note: All forecasted figures and peers have been taken from Thomson Reuters, NTM-Next Twelve Months
Stock Recommendation:The stock of the company generated returns of ~25% in the past one year and is currently trading close to the average of its 52-week low and high of $2.785 and $4.740, respectively. The stock has a price to earnings multiple of 25.11x.The company reported decent results in the first half of FY20 and expects to deliver further growth for the second half, with an uplift in revenue, gross margin and total processing volume. We have valued the stock using EV/Sales based relative valuation method and arrived at a target price offering lower double-digit upside in % terms. Hence, we recommend a “Buy” rating on the stock at the current market price of $3.77, down 2.332% as on 28 February 2020.
.jpg)
PPH Daily Technical Chart (Source: Thomson Reuters)
Downer EDI Limited
.png)
DOW Details
Revenues up by 3.3% Year Over Year:Downer EDI Limited (ASX: DOW) is involved in designing infrastructure and facilities. The company recently stated that Sumitomo Mitsui Trust Holdings, Inc. and its subsidiaries, are now a substantial shareholder of the company with a voting power of 5.08%.
Interim Results for the Period Ended 31st December 2019: During the period, DOW reported total revenue of $6.8 billion, indicating a rise of 3.3% year over year. The company reported strong performance across the Road Services business in its key markets, increased contribution from transport projects, along with a positive contribution from the Rollingstock Services business. EBITA for the period stood at $214.8 million, a decline of 19.9% year over year. Statutory net profit after tax came in at $91.4 million, down 35.4% on pcp.
.png)
Financial Performance (Source: Company Reports)
Outlook: In FY20, the company expects NPATA of ~$300 million before minority interests. Forecast construction revenue has been reduced by ~$300 million and forecast earnings by ~$20 million in FY20. Further, DOW expects to report cash conversion of roughly 40-50% of EBITDA for FY20.
Valuation Methodology:P/CF Based Valuation
.png)
P/CF Based Valuation (Source: Thomson Reuters)
Note: All the forecasted figures are taken from Thomson Reuters, NTM: Next Twelve Months
Stock Recommendation: The stock of the company delivered negative returns of ~23% over a period of 6 months and is currently trading very close to its 52-week low level of $5.6. The company has a strong pipeline of opportunities and has a price to earnings multiple of 16.8x and an annual dividend yield of 4.76%.We have valued the stock using the P/CF based relative valuation method and as a result, we have arrived at a target price with an upside of lower double-digit (in percentage terms). Hence, we give a “Buy” recommendation on the stock at the current market price of $5.7, down 3.061% on 28 February 2020.
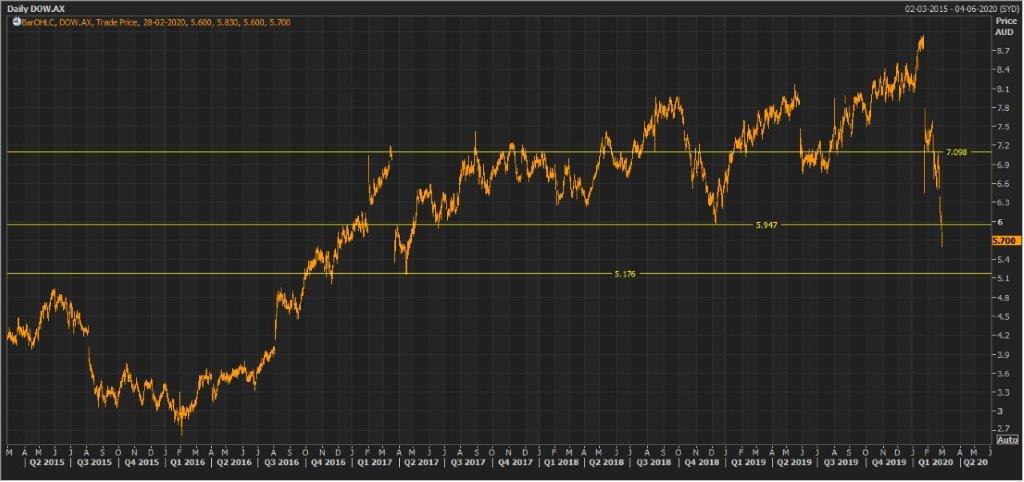
DOW Daily Technical Chart (Source: Thomson Reuters)
Super Retail Group Limited
.png)
SUL Details
Sales Increased ~3% Year Over Year in 1HFY20: Super Retail Group Limited (ASX: SUL) is involved in the operation of specialty retail stores in the tools, automotive, leisure and sports categories. The company recently stated that BlackRock Group has ceased to be a substantial shareholder of the company, effective from 26 February 2020.
H1FY20 Key Highlights for the Period Ended 29 December 2019: The company declared its half-yearly results, wherein its reported revenue increased 2.9% year over year and came in at $1,443.5 million. Total segment EBITDA came in at $159.8 million, down 3.9% on pcp. The period was marked by solid top-line growth across the Supercheap Auto (3.7%) and Rebel (3.6%) segments, which together contributed to 89% of brand EBIT. The company has declared a fully franked dividend of $0.21500 per share with a payment date of 2nd April 2020.
.png)
Key H1FY20 Highlights (Source: Company Reports)
What to Expect: The company is expecting normal weather conditions and predicts Macpac second half EBIT to be higher than the $5.5m delivered in the prior comparative period.Group also expects unallocated costs in the 2H to be lower as compared with the first half.
Valuation Methodology:Price to Earnings Based Valuation
.png)
Price to Earnings Based Valuation (Source: Thomson Reuters)
Note: All forecasted figures and peers have been taken from Thomson Reuters, NTM-Next Twelve Months
Stock Recommendation: The stock of SUL is trading at $8.11 with a market capitalisation of $1.71 billion. The stock is trading at the lower band of its 52-week trading range of $7.15 to $10.54. The stock has given a positive return of ~16.4% in the past one year. During the half, procurement and technology led business simplification projects delivered cost efficiencies. Considering the current trading levels and business prospects, we have valued the stock using Price to Earnings based relative valuation method and arrived at a target price of lower double-digit upside (in % terms). Hence, we recommend a “Buy” rating on the stock at the current market price of $8.11 per share, down 6.351% on 28 February 2020, on account of the mixed H1FY20 results.
.jpg)
SUL Daily Technical Chart (Source: Thomson Reuters)
Boral Limited
BLD Details
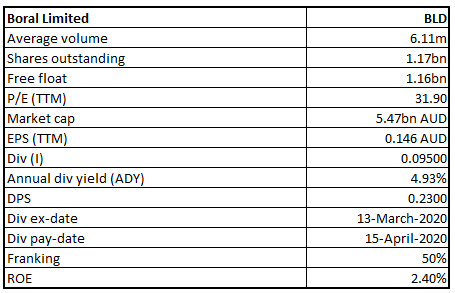
Re-activation of DRP: Boral Limited (ASX: BLD) is engaged in manufacturing and supplying of building and construction materials. As on 19 February 2020, the market capitalisation of the company stood at ~$5.47 billion. BLD has recently stated that it will reactivate the Dividend Reinvestment Plan (DRP) starting from 15 April 2020. A discount of 1.5% will be applied to the DRP for the interim dividend.
1HFY20 key Highlights for the Period Ended 31 December 2019: During the period, revenue of the company increased by 2% to $2,960 million, and EBITDA stood at $493 million, up from $470 million in 1HFY19. Statutory NPAT came in at $137 million, down 39% year over year. The company has declared a partially franked interim dividend of 9.5 cents per share which is to be paid on 15 April 2020. This represents a payout ratio of 71%.
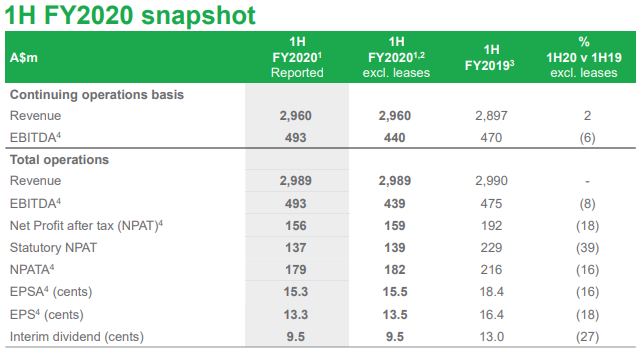
1H FY2020 Financial Highlights (Source: Company Reports)
Outlook: The company has provided guidance for FY20 and expects a decrease in FY20 EBITDA relative to FY19. It also anticipates NPAT to be between $320-$340 million, as compared to the restated FY2019 NPAT figure of $420 million.Further, in 2HFY20, conditions remain challenging owing to bushfires impact and extreme weather. Capital expenditure is likely to be around $400 million.
Valuation Methodology:Price to Cash Flow Based Valuation
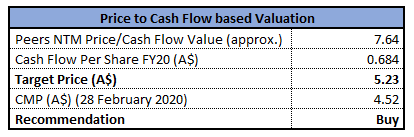
Price to Cash Flow Multiple (source: Thomson Reuters)
Note: All the forecasted figures are taken from Thomson Reuters, NTM: Next Twelve Months
Stock Recommendation: As per ASX, the stock of BLD gave a return of 14.74% in the past six months. The stock is trading close to the average of its 52-week low and high trading range of $3.93 to $5.735, respectively. The stock has a price to earnings multiple of 31.9x and an annual dividend yield of 4.93%.Considering the returns, and current trading level, we have valued the stock using the price to cash flow based relative valuation and have arrived at a target upside of lower double-digit (in percentage terms). Hence, we recommend a “Buy” rating on the stock at the current market price of $4.52, down by 3.212% on 28 February 2020.
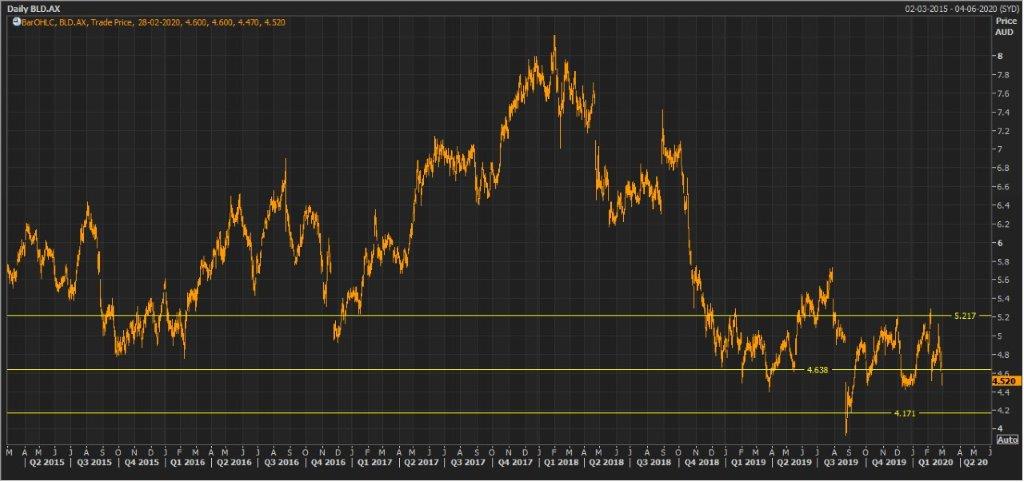
BLD Daily Technical Chart (Source: Thomson Reuters)
Bapcor Limited
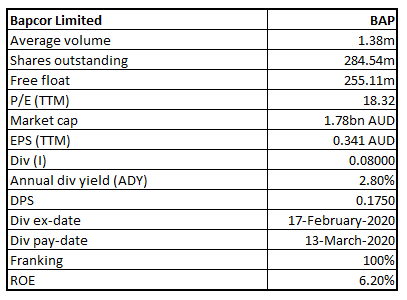
BAP Details
Sneak Peek at 1HFY20 Financial Results: Bapcor Limited (ASX: BAP) is involved in the sale and distribution of motor vehicle aftermarket parts, accessories and servicing. The company has recently released its 1HFY20 results for the period ended 31 December 2019, wherein it achieved record results across all key measures. During the period, BAP’s revenues increased 10.4% year over year to $702.5 million. In the same time period, NPAT witnessed a growth of 5.1% and stood at $45.3 million. EPS increased by 4.0% to 15.94 cps. The company has also declared a fully franked dividend of 8 cents per share.
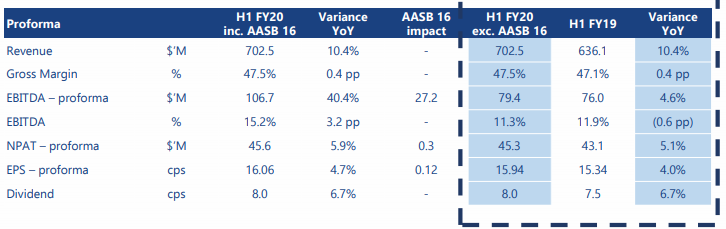
Key Performance Indicators (Source: Company Reports)
Outlook: The company anticipates FY20 pro-forma NPAT to grow by middle single-digit (in % terms) as compared to FY19. The addition of the commercial vehicle business of Truckline is likely to enhance the performance in the coming years and achieve an ROI of at least 15% in FY21.
Valuation Methodology:EV/Sales Based Valuation
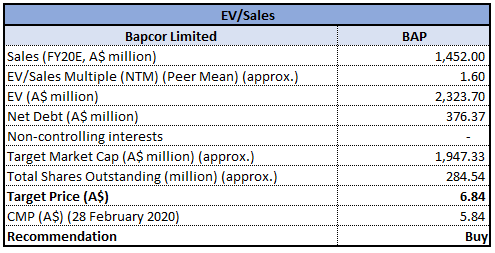
EV/Sales Based Valuation (source: Thomson Reuters)
Note: All the forecasted figures are taken from Thomson Reuters, NTM: Next Twelve Months
Stock Recommendation: As per ASX, the stock of BAP gave a return of 3.3% in the past one year. The stock is trading close to its 52-week low level of $5.32. The company has a market cap of $1.78 billion as on 28 February 2020. The company has a price to earnings multiple of 18.32x and an annual dividend yield of 2.8%. Considering the returns, current trading levels, improvement in margins and decent outlook, we have valued the stock using EV/Sales based relative valuation method and arrived at a target price of lower double-digit upside (in % terms). Hence, we give a “Buy” recommendation on the stock at the current market price of $5.84, down by 6.56% as on 28 February 2020.
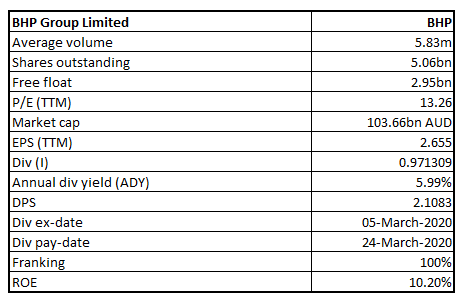
BAP Daily Technical Chart (Source: Thomson Reuters)
BHP Group Limited
BHP Details
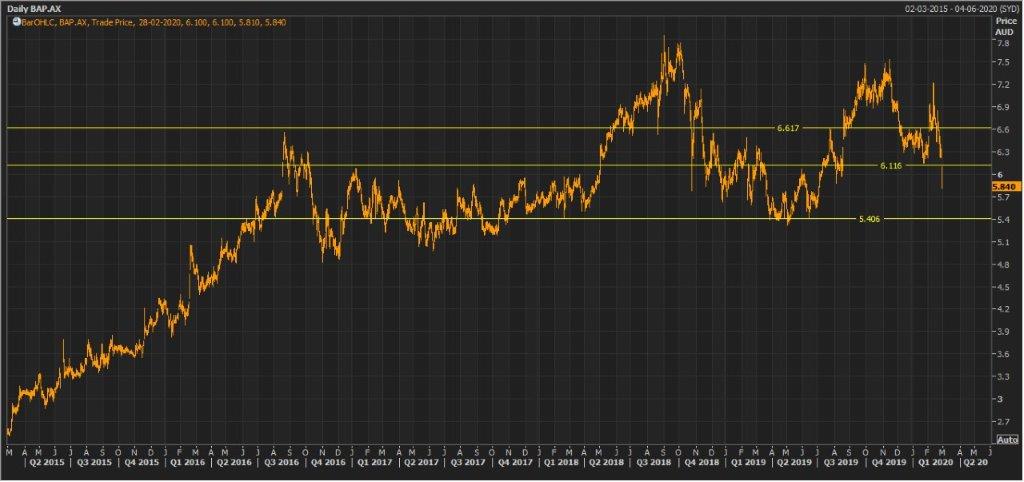
Digging in the Details of 1HFY20 Results: BHP Group Limited (ASX: BHP) is involved in the production, exploration and processing of minerals. The company recently reported its half-yearly results for the period ended 31st December 2019, wherein total revenues increased by 3% year over year to US$22,294 Mn. Underlying EBITDA for the period stood at US$12,084 million, up 15% year over year. For 1HFY20, copper production of the group increased by 7% to 885 kt of total production. The company declared an interim dividend of 65 US cps during the period, up 18% year over year.
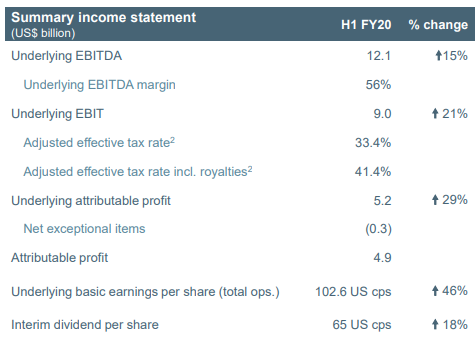
Operational Performance (Source: Company Reports)
Outlook: For FY20, the company is expecting total petroleum production in the band of 110 and 116 MMboe, and total copper production is expected to be in the range of 1,705kt and 1,820 kt. The company remains well positioned to capitalise on the growth opportunity on the back of population growth and better living standards.
Valuation Methodology:P/E Based Valuation
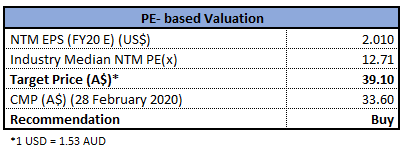
P/E Based Valuation (Source: Thomson Reuters)
Note: All forecasted figures have been taken from Thomson Reuters, NTM: Next Twelve Months
Stock Recommendation: As per ASX, the stock is trading close to its 52-week low level of $33.5. The company has a market cap of $103.66 billion as on 28 February 2020. The stock is available at a price to earnings multiple of 13.26x, and an annual dividend yield of 5.99%. We have valued the stock using P/E based relative valuation method and arrived at a target price offering an upside of lower-double digit (in percentage terms). Hence, considering the aforesaid facts and current trading levels, we give a “Buy” recommendation on the stock at the current market price of $33.60 per share, down 4.518% on 28 February 2020.
.jpg)
BHP Daily Technical Chart (Source: Thomson Reuters)
Disclaimer
The advice given by Kalkine Pty Ltd and provided on this website is general information only and it does not take into account your investment objectives, financial situation or needs. You should therefore consider whether the advice is appropriate to your investment objectives, financial situation and needs before acting upon it. You should seek advice from a financial adviser, stockbroker or other professional (including taxation and legal advice) as necessary before acting on any advice. Not all investments are appropriate for all people. Kalkine.com.au and associated pages are published by Kalkine Pty Ltd ABN 34 154 808 312 (Australian Financial Services License Number 425376). The information on this website has been prepared from a wide variety of sources, which Kalkine Pty Ltd, to the best of its knowledge and belief, considers accurate. You should make your own enquiries about any investments and we strongly suggest you seek advice before acting upon any recommendation. Kalkine Pty Ltd has made every effort to ensure the reliability of information contained in its newsletters and websites. All information represents our views at the date of publication and may change without notice. To the extent permitted by law, Kalkine Pty Ltd excludes all liability for any loss or damage arising from the use of this website and any information published (including any indirect or consequential loss, any data loss or data corruption). If the law prohibits this exclusion, Kalkine Pty Ltd hereby limits its liability, to the extent permitted by law to the resupply of services. There may be a product disclosure statement or other offer document for the securities and financial products we write about in Kalkine Reports. You should obtain a copy of the product disclosure statement or offer document before making any decision about whether to acquire the security or product. The link to our Terms & Conditions has been provided please go through them and also have a read of the Financial Services Guide. On the date of publishing this report (mentioned on the website), employees and/or associates of Kalkine Pty Ltd do not hold positions in any of the stocks covered on the website. These stocks can change any time and readers of the reports should not consider these stocks as advice or recommendations.
 AU
AU

 Please wait processing your request...