St Barbara Limited
.png)
SBM Details
Appointment of MD and CEO: St Barbara Limited (ASX: SBM) is an explorer and producer of gold, and the market capitalisation of the company stood at A$1.89 Bn as on 31st December 2019. The company recently announced that it has ceased to be a substantial holder in Prodigy Gold NL on 13th December 2019. The company, via a release dated 6th December 2019 announced that Bob Vassie would step down from the role of Managing Director and CEO in 2020. However, the company has appointed Craig Jetson as the MD and CEO of the company, whose role would commence from 3rd February 2020.
During Q1 FY20, the company reported an operational cash contribution of $43 million, and at the end of the quarter, the Total Recordable Injury Frequency Rate (TRIFR) stood at 5.0.
.png)
TRIFR (Source: Company Reports)
Production Guidance: With respect to Gwalia production and cost profile for FY20, the company expects production to be in the range of 175 koz to 190 koz with AISC expected between A$1,390/oz and A$1,450/oz. The sustaining capital expenditure is anticipated in the ambit of A$60 million to A$65 million and growth capital expenditure in the vicinity of A$32 million to $38 million.
Valuation Methodology:Price to Earnings Multiple Approach
.png)
Price to Earnings Based Valuation (Source: Thomson Reuters)
Note: All forecasted figures and peers have been taken from Thomson Reuters, NTM-Next Twelve Months
Stock Recommendation: The company is expecting consolidated production for FY20 in the range of 380 koz to 420 koz with AISC in the ambit of A$1,240/oz to A$1,330/oz. At the end of Q1FY20, the company possessed a cash balance of A$76 million, with debt amounting to A$112 million. The stock provided a return of 4.23% in the last one month, and as per ASX, the stock is currently trading close to its 52-week low of A$2.430, proffering opportunity for accumulation. We have valued the stock using the P/E based relative valuation approach and arrived at a target price with an upside of higher single-digit (in percentage terms). Thus, considering the decent performance in Q1FY20, favorable outlook and current trading levels, we give a “Buy” recommendation on the stock at the current market price of $2.720 per share, up 0.369% on 31st December 2019.
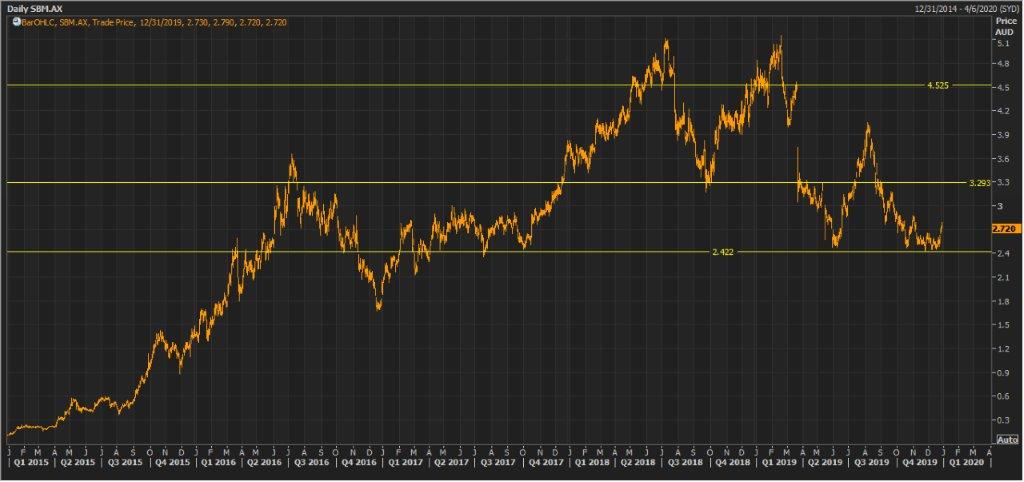
SBM Daily Technical Chart (Source: Thomson Reuters)
Aurelia Metals Limited
.png)
AMI Details
Strong Results in FY19: Aurelia Metals Limited (ASX: AMI) is engaged in the mining and exploration of gold and base metals in New South Wales. The market capitalisation of the company stood at $349.37 Mn as on 31st December 2019. The company recently announced that Van Eck Associates Corporation and its associates have become an initial substantial holder in the company with the voting power of 5.01% on 27th December 2019. On the financial front, FY19 has been a year, where the company has reported a strong set of operating and financial results, with a rise of 56% to over A$104 million in cash balance. The company reported a full year of contribution from Peak Mines, which supported a rise of 21% in group gold production to 117,521 ounces. The following picture provides an idea of production for September 2019 quarter:
.png)
Production Sep 2019 Quarter (Source: Company Reports)
What to Expect: For FY20, the company is anticipating full-year production in the range of 85-95 koz with AISC between $1,050-1,250/oz. The company is expecting a reduction in growth capital expenditure in FY21 after the anticipated completion of the Peak Pb/Zn upgrade in Q3 FY20.
Valuation Methodology:Price to Earnings Multiple Approach
.png)
Price to Earnings Based Valuation (Source: Thomson Reuters)
Note: All forecasted figures and peers have been taken from Thomson Reuters, NTM-Next Twelve Months
Stock Recommendation: During Q1 FY20, the company reported a rise in the production to 29,307 oz. The sales revenue of the company stood at $92 million, 73% of which was derived from the sale of precious metals, along with 27% from copper, lead and zinc sales. Return on Equity of the company stood at 17.8% in FY19 as compared to the industry median of 12.3%. This implies that the company has provided better returns to shareholders as compared to the broader industry. We have valued the stock using PE-based valuation approach and arrived at a target price with an upside of lower single-digit (in percentage terms). Therefore, considering the favorable valuations, company’s focus on investing in the development of its existing operations and a debt-free position, we give a “Buy” recommendation on the stock at the current market price of $0.435 per share, up 8.75% on 31st December 2019.
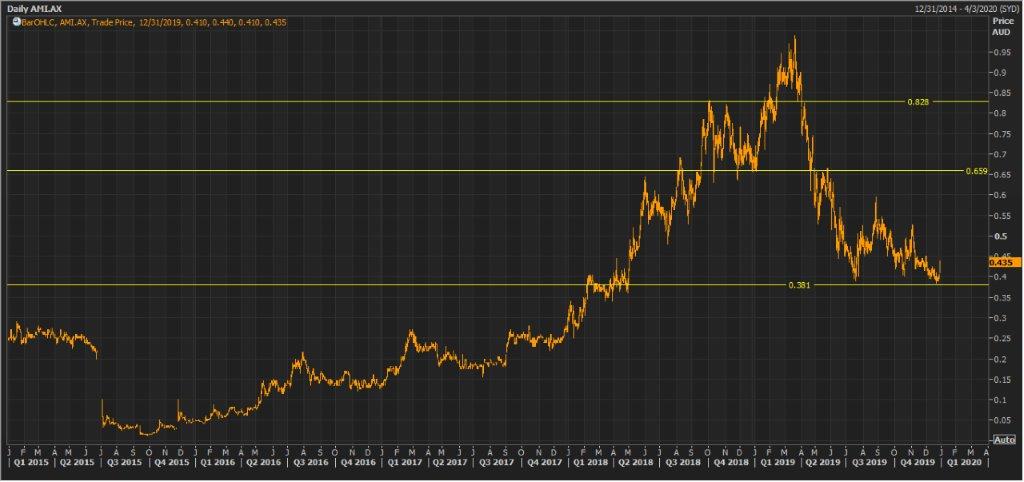
AMI Daily Technical Chart (Source: Thomson Reuters)
Over the Wire Holdings Limited
.jpg)
OTW Details
Revenue CAGR at 49% over 2015-2019: Over the Wire Holdings Limited (ASX: OTW) is involved in the provisioning of telecommunications, cloud and IT solutions to business clients. The market capitalisation of the company stood at A$237.54 Mn as on 31st December 2019. The company reported a rise of 49% in total revenue and the figure stood at $79.6 million in FY19. The Board of the company declared a fully franked final dividend amounting to 2.00 cps for FY19. The Group continued to remain a strong converter of EBITDA into positive operating cashflows and possessed $10.3 million in cash and cash equivalents in FY19.
.png)
Total Revenue (Source: Company Reports)
Future Aspects: The business performance of the company is well aligned with its strategy and it continues to generate positive operational cash flow while maintaining a strong balance sheet. Also, the company seems well placed to deliver organic growth and pursue further accretive acquisitions.
Valuation Methodology:EV to EBITDA Multiple Approach
.png)
EV/EBITDA Based Valuation (Source: Thomson Reuters)
Note: All forecasted figures and peers have been taken from Thomson Reuters, NTM-Next Twelve Months
Stock Recommendation: The stock of the company gave negative returns of 7.07% over a period of 6 months. The company is optimistic that it would make strong growth in FY20 and continue to deliver sustainable profit growth for shareholders. Net margin of the company stood at 12.7% in FY19, reflecting YoY growth of 2.4%. This reflects that the company has improved its position to convert its top-line into the bottom-line. We have valued the stock using EV to EBITDA multiple based relative valuation approach and arrived at a target price with an upside of lower single-digit (in percentage terms). Hence, in the light of 49% CAGR in total revenue during FY15-FY19, focus on delivering organic growth and other factors, we give a “Buy” recommendation on the stock at the current market price of $4.600 per share on 31st December 2019.
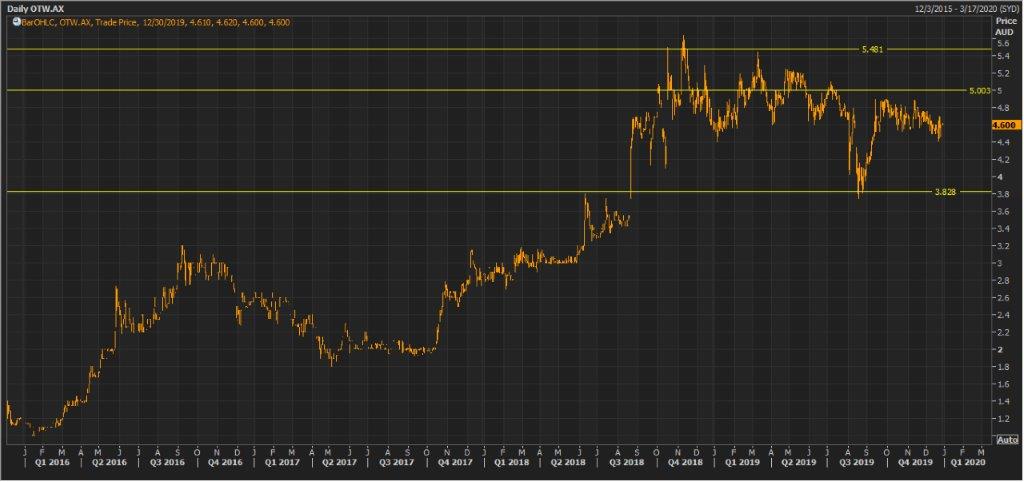
OTW Daily Technical Chart (Source: Thomson Reuters)
ELMO Software Limited
.png)
ELO Details
Record Cash Receipts in Q1FY20: ELMO Software Limited (ASX: ELO) provides software-as-a-service (SaaS), cloud-based human resources and payroll solutions and the market capitalisation of the company stood at $461.57 million as on 31st December 2019. The company, through a release dated 2nd December 2019 announced an investment in Hero Brands Pty Limited, which is a software development house headquartered in Melbourne. The investment of ELO consists of a capital injection of $1.18 million in exchange for 50% equity ownership, with an additional contingent payment of $0.5 million payable upon meeting performance hurdles. The company reported cash receipts of $12.0 million in Q1 FY20 with a rise of 17% as compared to Q1 FY19, which represents the largest Q1 cash receipts in the history of the company.
.png)
Customers Receipts (Source: Company Reports)
Targeting Further Investment: The company is anticipating strong ARR growth in the range of $61 million -63 million, revenue growth of between $53-$55 million. The company would continue to aim for further investment to deliver long-term, sustainable growth.
Valuation Methodology:EV to Sales Multiple Approach
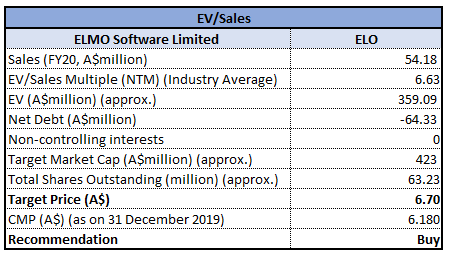
EV/Sales Based Valuation (Source: Thomson Reuters)
Note: All forecasted figures and peers have been taken from Thomson Reuters, NTM-Next Twelve Months
Stock Recommendation: The company has successfully wrapped up an institutional placement as well as the Share Purchase Plan in order to raise new capital. The company would be utilising these new funds diligently for building its position and drive long-term sustainable growth. Considering the above factors, we have valued the stock using EV to Sales based relative valuation approach and arrived at a target price with an upside of higher single-digit (in percentage terms). Therefore, taking into account the announcement of a strategic partnership with the University of Technology Sydney, increase in cash receipts in Q1 FY20 and decent outlook, we give a “Buy” recommendation on the stock at the current market price of A$6.180 per share, up 0.325% on 31st December 2019.
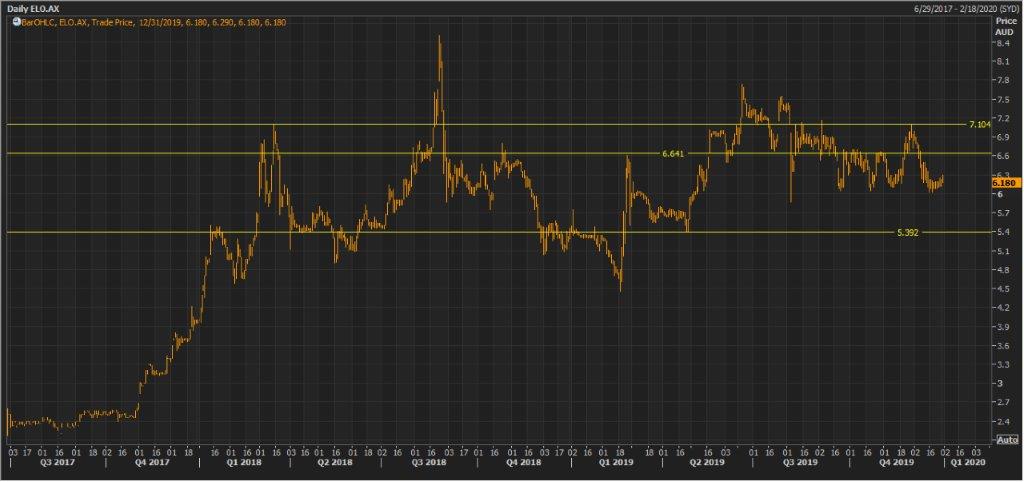
ELO Daily Technical Chart (Source: Thomson Reuters)
Tabcorp Holdings Limited
TAH Details
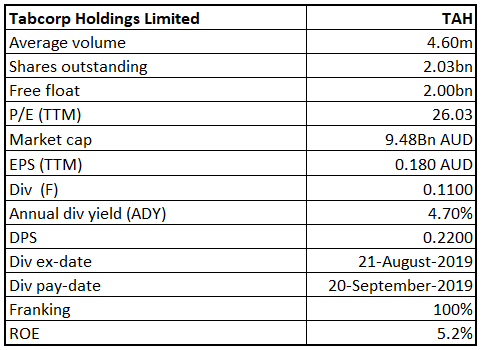
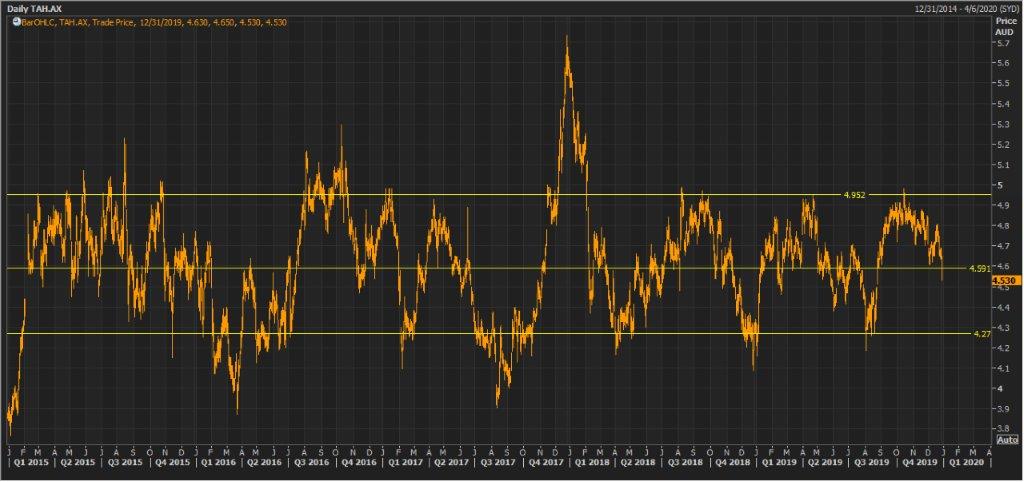
Decent FY19 Revenue Growth: Tabcorp Holdings Limited (ASX: TAH) provides gambling and other entertainment services and has three operating business units, being Lotteries and Keno, Wagering and Media, and Gaming Services. For the year ended 30 June 2019, revenue of the company went up by 45.9% to $5,482.2 million, demonstrating the benefits of Tabcorp’s enhanced scale and business diversification following the combination with Tatts in FY18. Strong revenue growth, supported by the excellent progress in delivering the integration synergies, resulted in a profit before significant items of $362.5 million. The company has also paid fully franked full-year dividend of 22 cents per share.
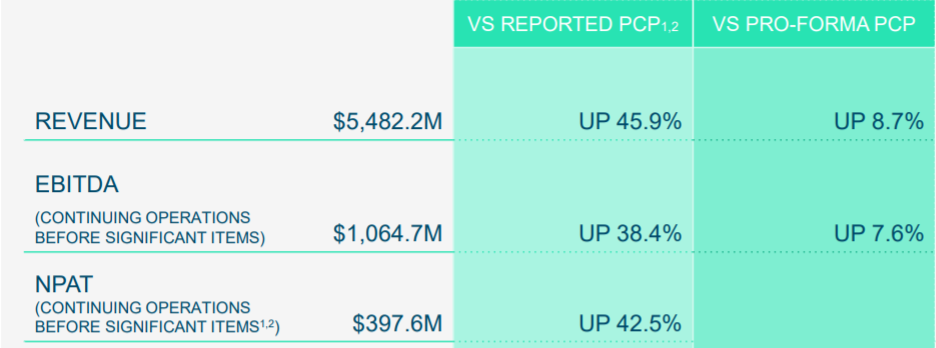
Financial Performance (Source: Company Reports)
Growth Opportunities: The company is confident in achieving FY21 synergy and business improvement targets and expects EBITDA to be in between $130 million to $145 million. Wagering & Media strategy is on track to integrate and transform the business through enhanced digital and data capability. The company also expects that TAB customers will enjoy access to more and better products and consistent experience by FY21.
Valuation Methodology: EV/Sales Multiple Approach
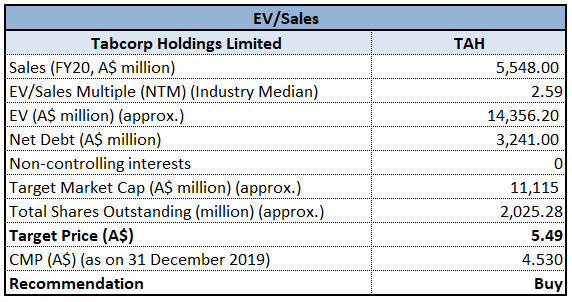
EV/Sales Based Valuation (Source: Thomson Reuters)
Note: All forecasted figures and peers have been taken from Thomson Reuters, NTM-Next Twelve Months
Stock Recommendation: As per ASX, the stock gave a return of 10.38% on YTD basis and a return of 4.46% in the last 6 months. The company is well-positioned for growth and has witnessed a CAGR of 19.53% in gross profit from FY15 to FY19. During FY19, Net margin and ROE saw an improvement and increased to 6.8% and 5.2% from 4% and 3.5%, respectively. Considering the returns, decent outlook and improving margins, we have valued the stock using EV/Sales based relative valuation method and arrived at a target upside of lower double-digit (in percentage terms). Hence, we recommend a “Buy” rating on the stock at the current market price of $4.530, down by 3.205% on December 31, 2019.
TAH Daily Technical Chart (Source: Thomson Reuters)
Nine Entertainment Co. Holdings Limited
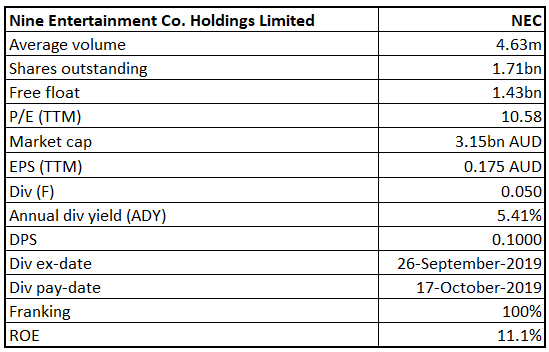
NEC Details
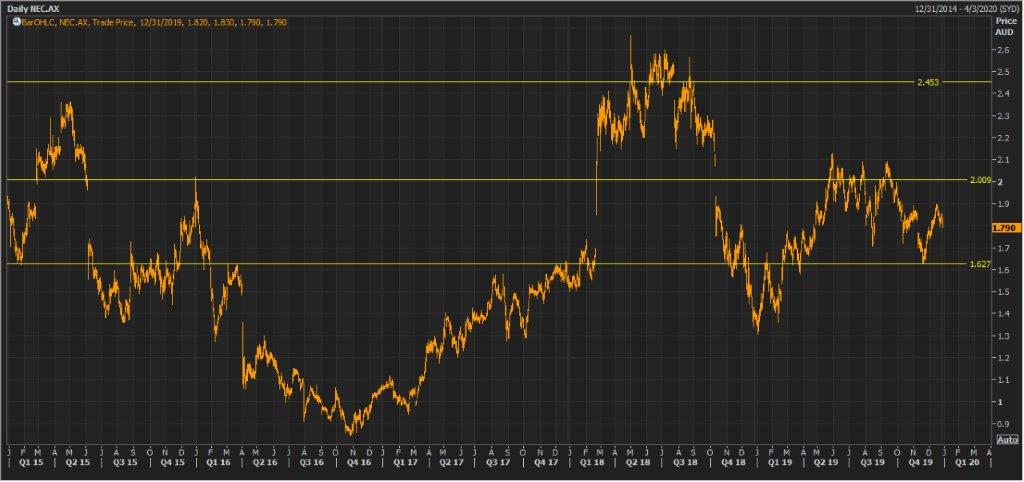
Decent Growth in EBITDA: Nine Entertainment Co. Holdings Limited (ASX: NEC) is a media and entertainment company, engaged in broadcasting and program production across free to air television and metropolitan radio networks, publishing newspapers and subscription video. The company has announced that it will release its H1 FY20 results on 26 February 2020. In the recently held AGM, the top management stated that revenue of the company stood at $2.3 billion with a group EBITDA of $424 million, up by 10% on FY18. The company has also paid fully franked dividends of 10 cents per share, up by 11% on FY18.
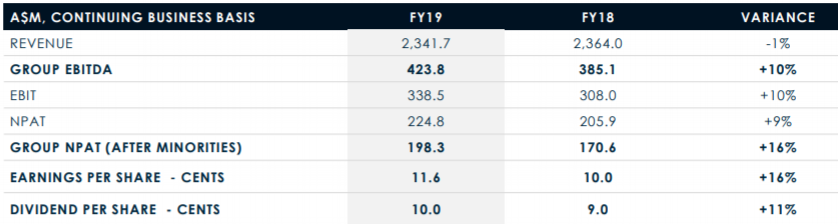
Financial Performance (Source: Company Reports)
What to Expect: The company remains confident about the share gain through the second half on the back of the performance of its audience and is on track to mitigate the impact of the weak start to the year. The company continues to invest in growth initiatives and is expecting a low single-digit growth in FY20 Pro Forma Group EBITDA prior to the impact of AASB16.
Valuation Methodology: EV/EBITDA Multiple Approach
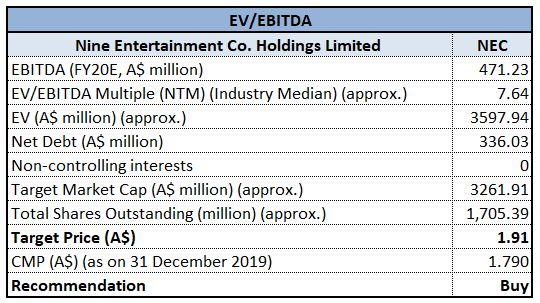
EV/EBITDA Based Valuation (Source: Thomson Reuters)
Note: All forecasted figures and peers have been taken from Thomson Reuters, NTM-Next Twelve Months
Stock Recommendation: As per ASX, the stock generated returns of 37.04% on YTD basis and a return of 3.35% in the past one month. Over the period of FY16 to FY19, the company witnessed a CAGR of 53.18% in gross profit. During the year, EBITDA margin improved in the previous year from 18.8% to 19.1% in FY19. Considering the returns, CAGR in gross profit, improvement in EBITDA margin and modest outlook, we have valued the company using EV/EBITDA relative valuation approach and have arrived at a target upside of higher single-digit (in percentage terms). Hence, we recommend a “Buy” rating on the stock at the current market price of $1.790, down by 3.243% on December 31, 2019.
NEC Daily Technical Chart (Source: Thomson Reuters)
Vicinity Centres
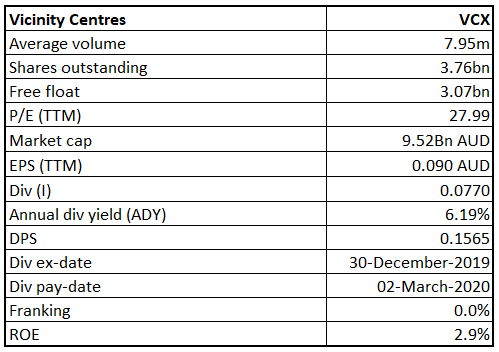
VCX Details
Uni Hill Acquisition and Lennox Village Divestment: Vicinity Centres (ASX: VCX) is engaged in property investment, property management, property development, leasing and funds management. As on 31 December 2019, the market capitalization of the company stood at $9.52 billion. The company has recently agreed to acquire a 50% interest in Uni Hill Factory Outlets from MAB Corporation for $67.8 million. It further announced the divestment of its 50% interest in Lennox Village with a book value of $31.5 million as at 30 June 2019.
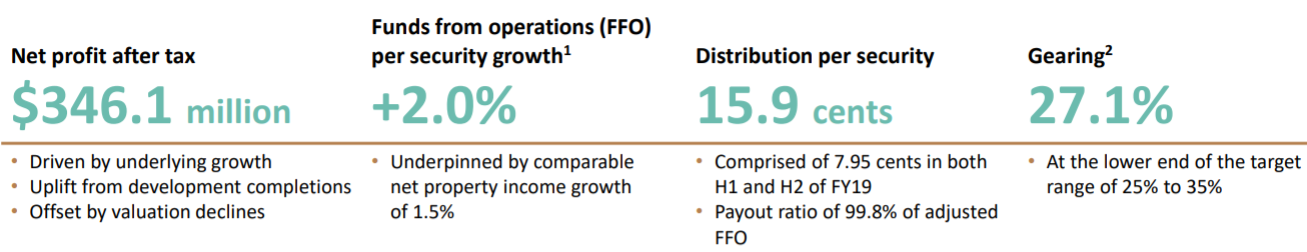
For FY19, VCX delivered a net profit of $346 million, driven by steady underlying growth and development completions offset by valuation declines, particularly in Western Australia. Specialty store and mini major combined MAT growth stood at 3%, with a growth of 6.2% in mini majors sales.
Financial Performance (Source: Company Reports)
Future Opportunities: Vicinity Centres is in a strong position to fund its portfolio-enhancing development pipeline. The company has given its FFO guidance for FY20 and expects it to be between 17.6 cents to 17.8 cents per security. The distribution payout ratio is expected to be at the upper end of the target range of 95% to 100% of adjusted FFO.
Valuation Methodology: EV/Sales Multiple Approach
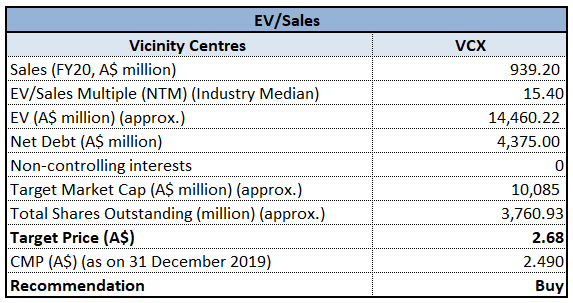
EV/Sales Based Valuation (Source: Thomson Reuters)
Note: All forecasted figures and peers have been taken from Thomson Reuters, NTM-Next Twelve Months
Stock Recommendation: As per ASX, the stock gave a return of 1.61% in the past 6 months. The stock is also inclined towards its 52-week low of $2.415, offering a decent opportunity for accumulation. In the time span of 4 years from FY15 to FY19, the company witnessed a CAGR of 9.66% in revenue. Considering the trading levels, CAGR in revenue and decent outlook, we valued the stock using EV/Sales based relative valuation approach and have arrived at a target upside of higher single-digit (in percentage terms). Hence, we recommend a “Buy” rating on the stock at the current market price of $2.490, down by 1.581% on December 31, 2019.
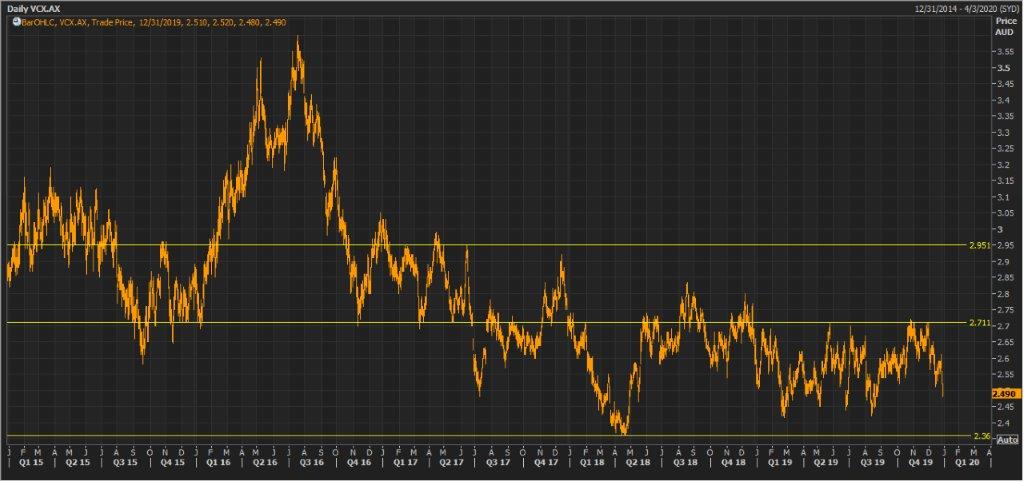
VCX Daily Technical Chart (Source: Thomson Reuters)
Scentre Group
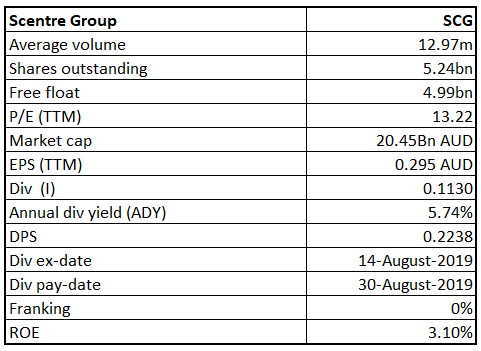
SCG Details
Scentre Group Acquires 50% Interest in Booragoon: Scentre Group (ASX: SCG) is engaged in property management and development and has the long-term ownership of shopping centres. As on 31 December 2019, the market capitalisation of the company stood at $20.45 billion. The company has recently acquired 50% interest in Garden City Booragoon for a consideration of $570 million. Greg Miles, the Chief Operating Officer informed his intention to retire in 2020. For the quarter ended 30 September 2019, total in-store sales went up by 2.4%, with total portfolio sales of over $24 billion.
.png)
Financial Performance (Source: Company Reports)
What to Expect: The transaction of Booragoon is expected to be marginally accretive to Scentre Group’s earnings from 2020 and will increase gearing to 31.7%. Scentre Group reconfirms its forecast Funds from Operations (FFO) growth per security for the full year 2019 to be 0.7% and distribution of 22.60c per security.
Valuation Methodology: Price to Cash Flow Multiple Approach
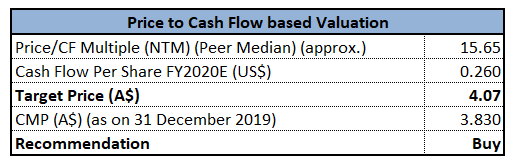
Price to Cash Flow Based Valuation (Source: Thomson Reuters)
Note: All forecasted figures and peers have been taken from Thomson Reuters, NTM-Next Twelve Months
Stock Recommendation: As per ASX, the stock gave a return of 1.56% on the YTD basis. During the half-year ended June 2019, EBITDA margin of the company stood at 67%, higher than the industry median of 61.8%. This indicates that the company is efficiently managing its costs and is able to convert its revenue into profits. Considering the improvement in EBITDA margin and decent outlook, we have valued the stock using Price to Cash Flow based relative valuation approach and arrived at a target upside of single-digit upside (in percentage terms). Hence, we recommend a “Buy” rating on the stock at the current market price of $3.830, down by 1.795% on December 31, 2019.
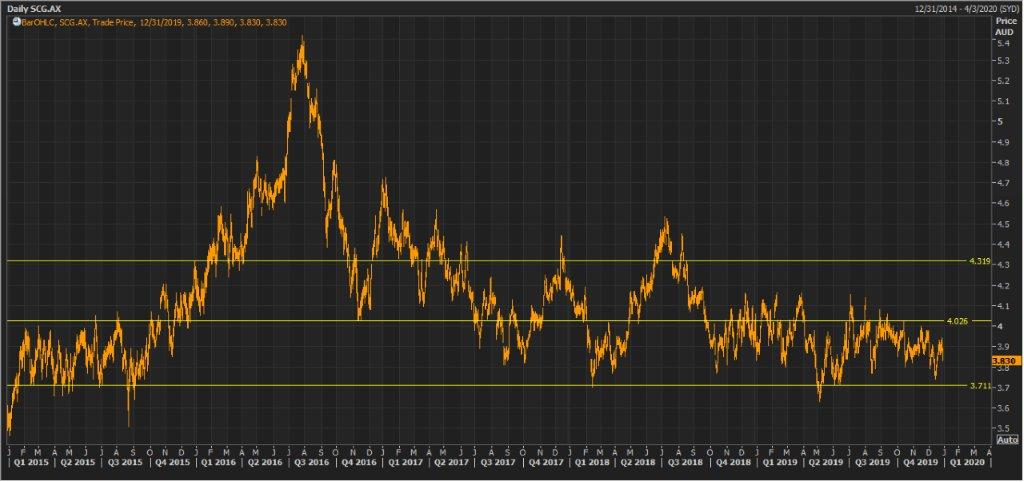
SCG Daily Technical Chart (Source: Thomson Reuters)
Disclaimer
The advice given by Kalkine Pty Ltd and provided on this website is general information only and it does not take into account your investment objectives, financial situation or needs. You should therefore consider whether the advice is appropriate to your investment objectives, financial situation and needs before acting upon it. You should seek advice from a financial adviser, stockbroker or other professional (including taxation and legal advice) as necessary before acting on any advice. Not all investments are appropriate for all people. Kalkine.com.au and associated pages are published by Kalkine Pty Ltd ABN 34 154 808 312 (Australian Financial Services License Number 425376). The information on this website has been prepared from a wide variety of sources, which Kalkine Pty Ltd, to the best of its knowledge and belief, considers accurate. You should make your own enquiries about any investments and we strongly suggest you seek advice before acting upon any recommendation. Kalkine Pty Ltd has made every effort to ensure the reliability of information contained in its newsletters and websites. All information represents our views at the date of publication and may change without notice. To the extent permitted by law, Kalkine Pty Ltd excludes all liability for any loss or damage arising from the use of this website and any information published (including any indirect or consequential loss, any data loss or data corruption). If the law prohibits this exclusion, Kalkine Pty Ltd hereby limits its liability, to the extent permitted by law to the resupply of services. There may be a product disclosure statement or other offer document for the securities and financial products we write about in Kalkine Reports. You should obtain a copy of the product disclosure statement or offer document before making any decision about whether to acquire the security or product. The link to our Terms & Conditions has been provided please go through them and also have a read of the Financial Services Guide. On the date of publishing this report (mentioned on the website), employees and/or associates of Kalkine Pty Ltd do not hold positions in any of the stocks covered on the website. These stocks can change any time and readers of the reports should not consider these stocks as advice or recommendations.
 AU
AU

 Please wait processing your request...