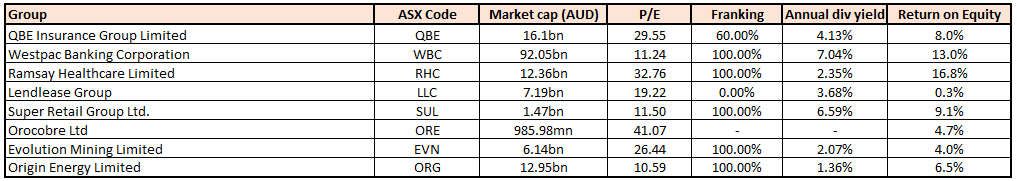
Stocks’ Details
QBE Insurance Group Limited
Significant Improvement Witnessed In 2018: QBE Insurance Group Limited (ASX: QBE) had posted cash profit after tax amounting to $715 million in 2018 reflecting substantial improvement YoY as in 2017 there was a cash loss of $262 million. The company’s NPAT amounted to $390 million as compared to the loss in the prior year of $1,249 million. The company’s management stated that improved 2018 performance demonstrates improvement in the attritional claims experience throughout the divisions along with a reduction in the catastrophe claims.
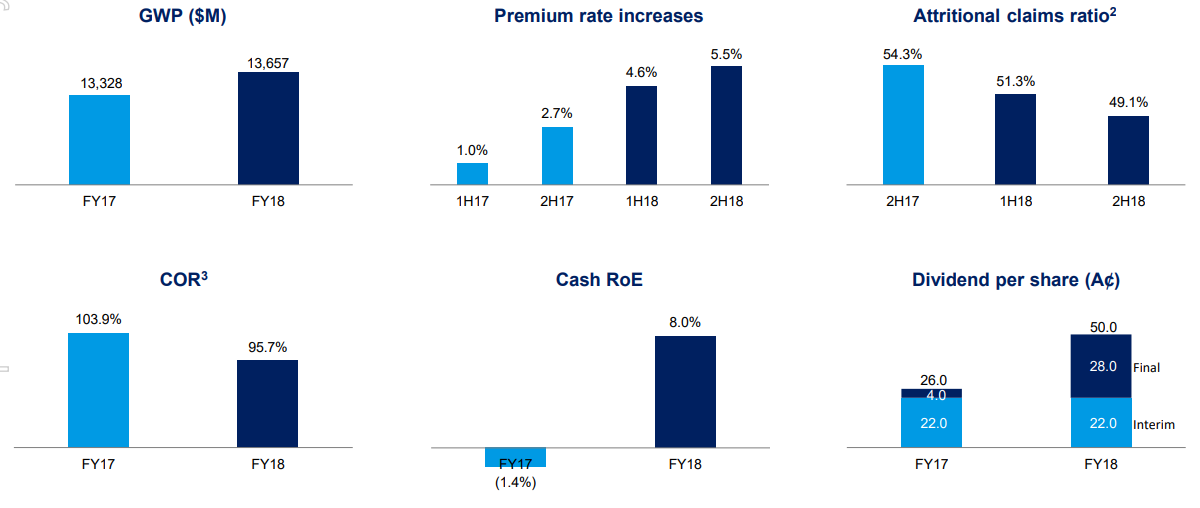
FY 2018 Results Snapshot (Source: Company Reports)
QBE Insurance Group has been targeting combined operating ratio in the range of 94.5%-96.5% and the net investment return of 3%-3.5% in 2019. Also, QBE would be focusing towards sustainability and positive contributions. It would also be inclined towards digital initiatives, enhancing the data and analytics capabilities and would be reducing the complexity.
Stock Recommendation: On the daily chart of QBE, Exponential Moving Average or EMA has been applied and default values were used for the purposes. It was seen that the stock price had crossed the EMA and moved upwards after crossover reflecting bullishness.
On the backdrop of above factors, we maintain our “Buy” rating on the stock at the current price of A$12.350 per share (up 1.898% on 28 February 2019).
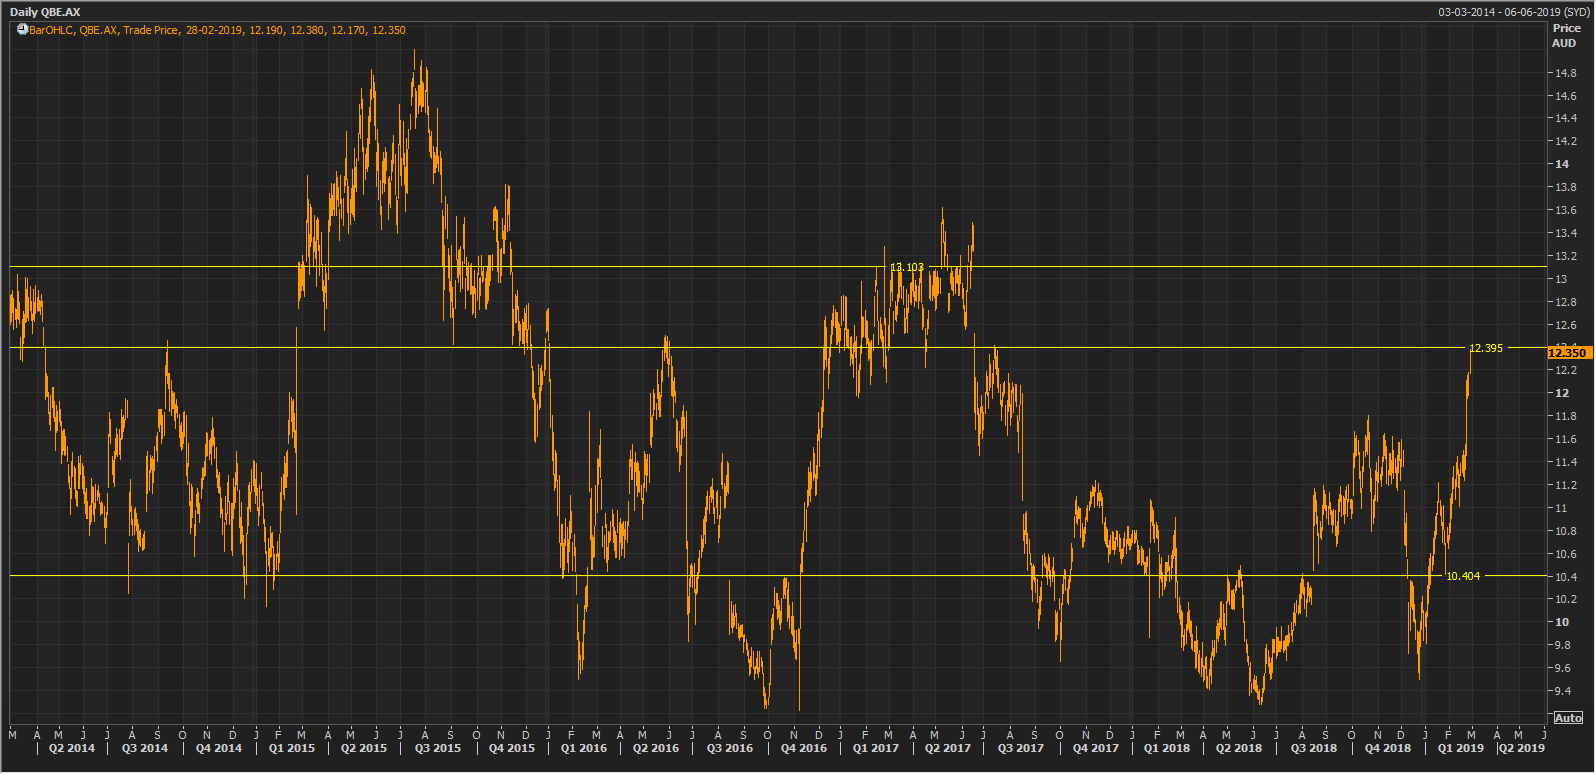
QBE Daily Chart (Source: Thomson Reuters)
Westpac Banking Corporation
Bank’s service led strategy to create shareholder’s wealth:Westpac Banking Corporation’s (ASX: WBC) management has view for FY19 that there are likely to be economic headwinds in 2019, with GDP growth expected to moderate to be around 2.7%. The management has lifted the group’s productivity target for next year to $400 million as the bank continue to simplify its products, digitise its business, and modernise its platforms.
The management is committed to invest in technology to improve the quality of services to customers and make it easier for them to do business with the bank. The management has a belief that its service-led strategy remains the best way to create value for the bank’s shareholders.
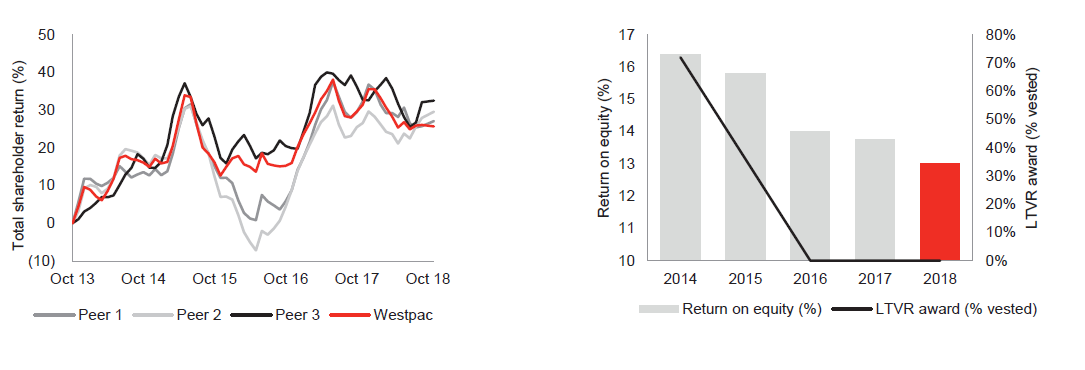
WBC’s Total shareholder return and ROE (Source: Company Reports)
The stock price has fallen by 3.82% over the past six months. Its P/E ratio stood at 11.240x which is lower than its peers like CBA, ANZ, NAB and MQG.
Hence, considering the robust outlook & strong dividend yield of around 7.04%, we maintain our “Buy” recommendation on the stock at the current market price of $26.960 (up 0.974% on 28 February 2019).
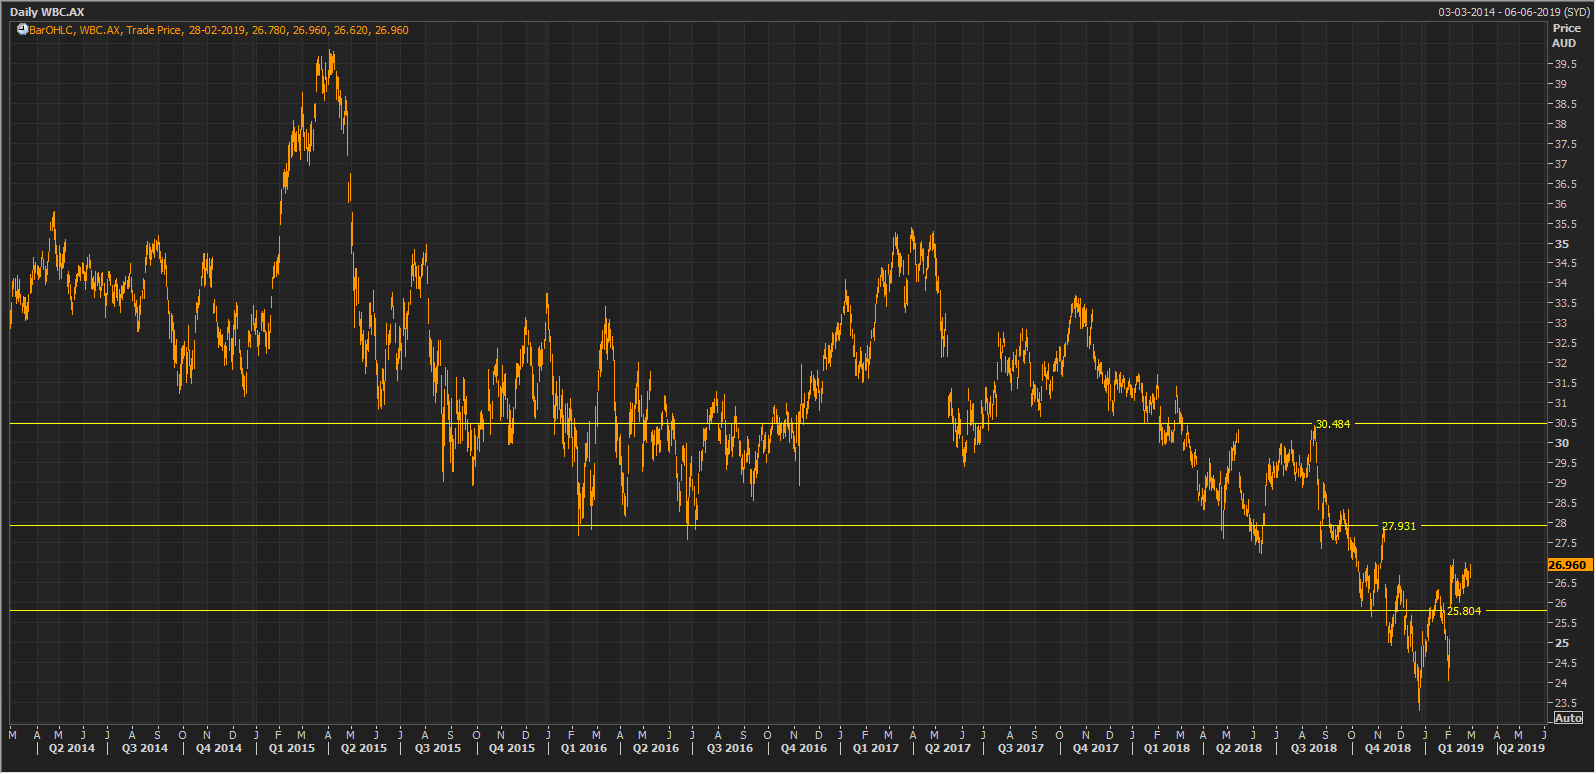
WBC Daily Chart (Source: Thomson Reuters)
Ramsay Healthcare Limited
Robust Australian demand- a growth catalyst:Ramsay Healthcare Limited (ASX: RHC) has declared an ordinary dividend of AUD 0.6, the record date for which shall be the March 7, 2019 & the Payment Date shall be March 29, 2019.
For 1H FY 2019, the company reported a Core NPAT up 1.0% to reach at $290.8 million & also the EBITDA was up 9.8% to reach at $728.6 million. This growth was achieved on the back of volume growth and sustained focus on achieving operational efficiencies.
What to Expect From RHC: With respect to Australia, moving forward, the company is committed to investing in the brownfield programme which is expected to deliver $242 million in completed projects in FY19.Also, the company continues to target core EPS growth of up to 2% in FY 2019 (including Capio).
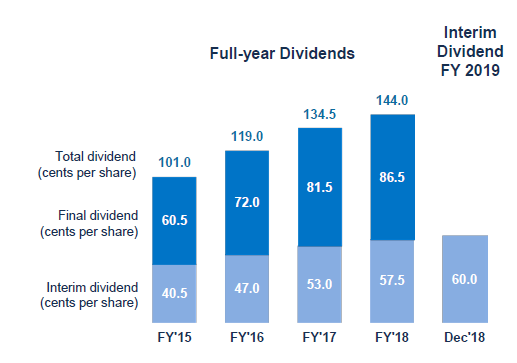
RHC’s Dividend Payments (Source: Company Reports)
The company’s ROE stands at 16.8% in FY18 which is decent enough considering the concerned industry median of 15.8%. Also, the stock price has gained over the past six months by 7.24%. Thus, considering a better than Industry ROE and a decent outlook, we, therefore, maintain our “Buy” rating on the stock at the current market price of $64.780 per share (up 5.902% on 28 February 2019).
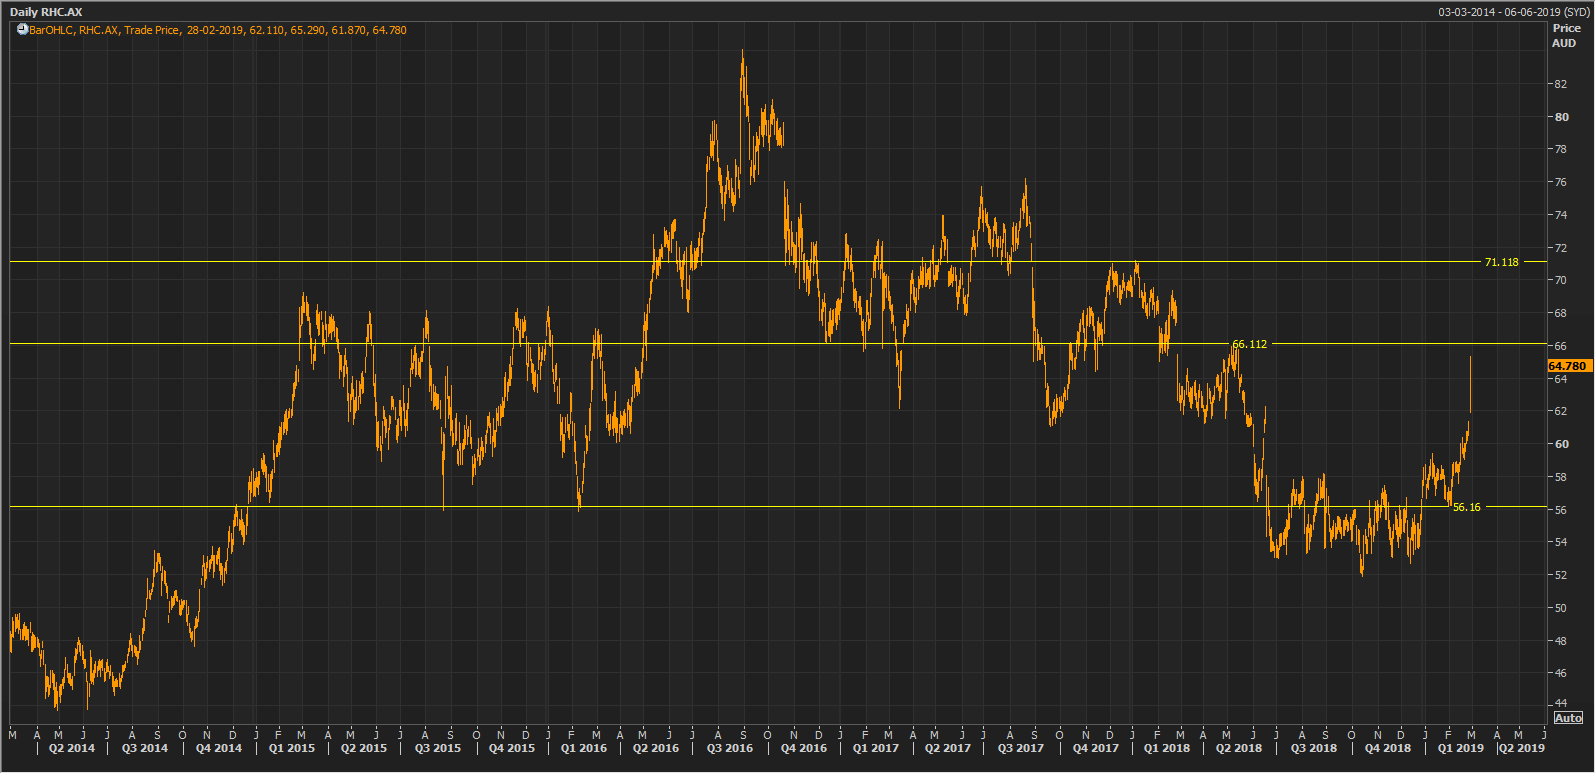
RHC Daily Chart (Source: Thomson Reuters)
Lendlease Group
Conversion of Origination Opportunities Amidst Challenges: Lendlease Group (ASX: LLC) had reported the half year results in which it managed to convert the origination opportunities in global gateway cities i.e. there has been growth in the development pipeline and there was successful execution of key initiatives with the capital partners. The company’s profit after tax amounted to $15.7 million in the half year while in the same period of the prior year the PAT was $425.7 million.
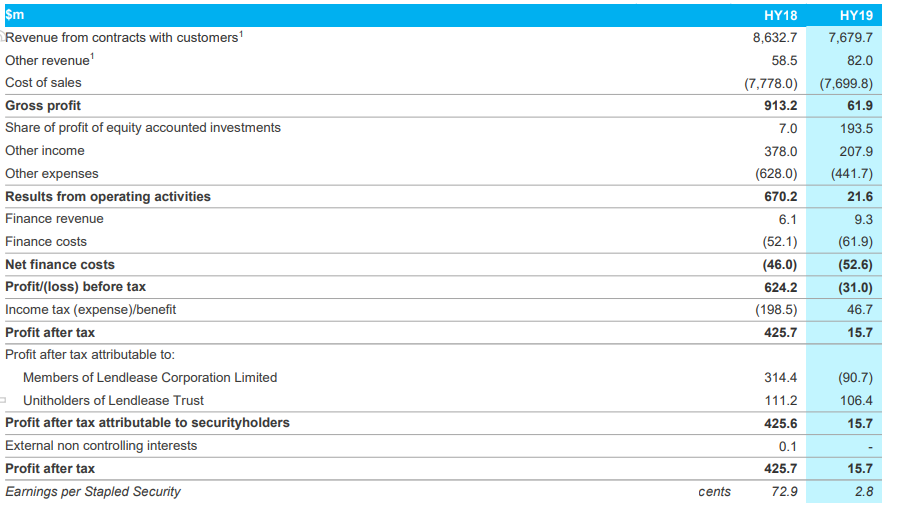
Income Statement (Source: Company Reports)
Robust Financial Position Might Support: Lendlease Group happens to be in a strong financial position as it has gearing at mid-point of 10%-20% target range and has available liquidity amounting to $2.1 billion even though there was underperformance from engineering. The decision that engineering and services are non-core is made so that the security holder value can be maximised over long-term by focusing towards proven integrated capabilities across development, construction as well as investments.
The company’s portfolio of 20 major urbanisation projects across 10 cities delivers LLC’s objective of diversifying to the targeted international gateway cities. These long-dated projects give strong visibility of future earnings. Moreover, the company’s stock price is trading slightly towards the lower levels, thus, providing an opportunity to make an entry. Hence, we maintain our “Buy” recommendation on the stock at the current market price of A$12.880 per share.
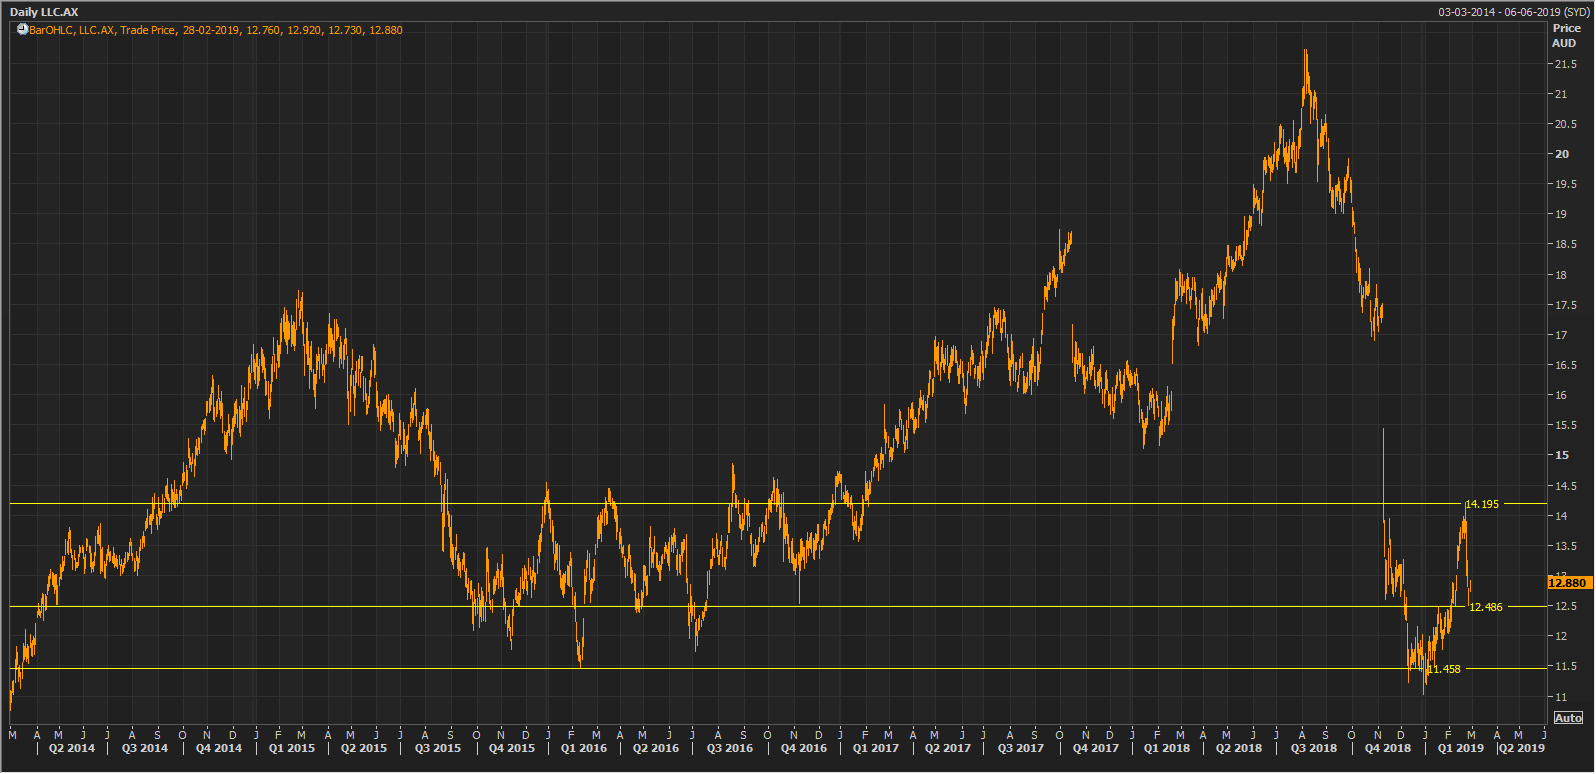
LLC Daily Chart (Source: Thomson Reuters)
Super Retail Group Ltd.
Expanding online presence: Super Retail Group Ltd (ASX: SUL) has, for 1H FY 2019, stated that the Total Sales increased 6.0% on pcp & thus came in at $1,403.2 Mn. The operating cash flow came in at $235.4 Mn reflecting the fall of 58.3%.
The company’s strategy is focused upon growing the businesses in high involvement categories, engaging capable team members to share customers’ passions as well as building world-class Omni-retail organization.
With respect to SCA, Rebel and BCF, for coming 3 years, there are expectations for revenue growth of between 4%-6% per annum and, the company stated that there would be an improvement of 10-30 basis points in EBIT margin per annum.
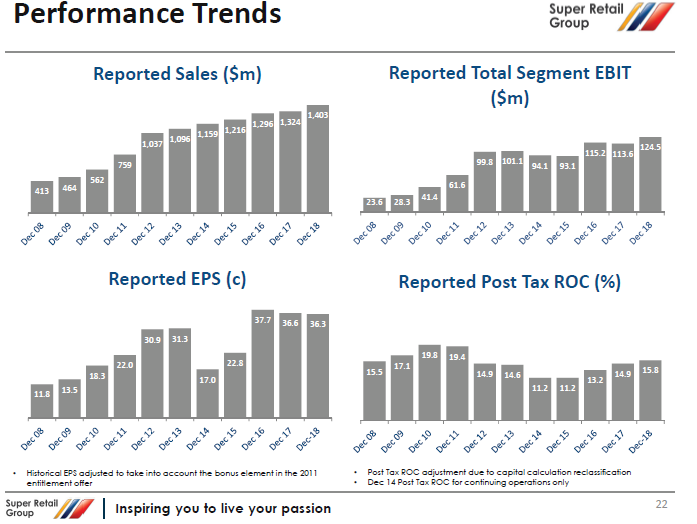
Performance Trend (Source: Company Reports)
If we look at the past six months’ performance, the stock has receded by 24.08% and trading at reasonable PE multiple of 11.50x. By considering decent outlook and expanding online presence across the market, we maintain our “Buy” recommendation on the stock at the current market price of $7.410 per share (down 0.403% on 28 February 2019).

SUL Daily Chart (Source: Thomson Reuters)
Orocobre Ltd
Olaroz- One of The Lowest Cost Producers Of Lithium Globally: Orocobre Ltd (ASX: ORE), for 1H FY 2019, reported a net profit after tax of US$24 Mn.The company has reported an improvement in its average price to US$12,295/tonne, up from US$11,415/tonne in PCP resulting in a 7.7% rise.
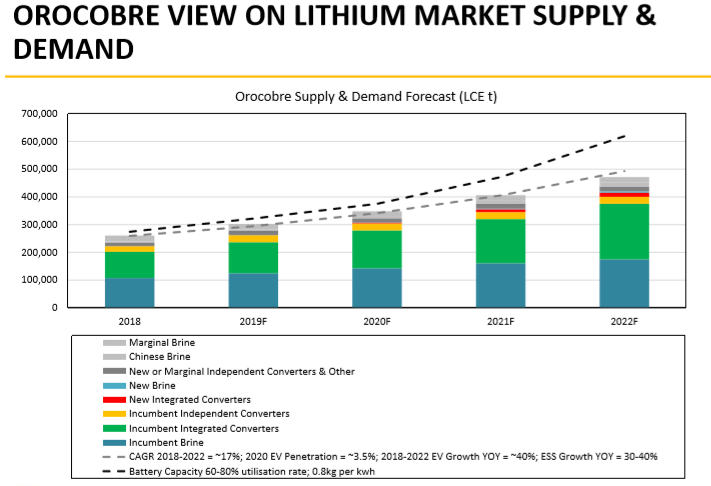
Orocobre Supply and Demand Forecast (Source: Company Reports)
The management is of a view that the demand for the battery is set to go up from 183kt LCE to 991kt LCE in the year 2028 and this should bode well for the lithium manufacturers. The company expects production for FY 2019 to be similar to FY 2018.
Meanwhile, the company’s stock price had delivered the return of 18.55% in the past one month & is trading close to the lower levels making it attractive for accumulation at this price level on the back of favourable outlook for the battery demand. We, therefore, maintain our “Buy” recommendation on the stock at the current market price of $3.840 per share (up 1.857% on 28 February 2019).
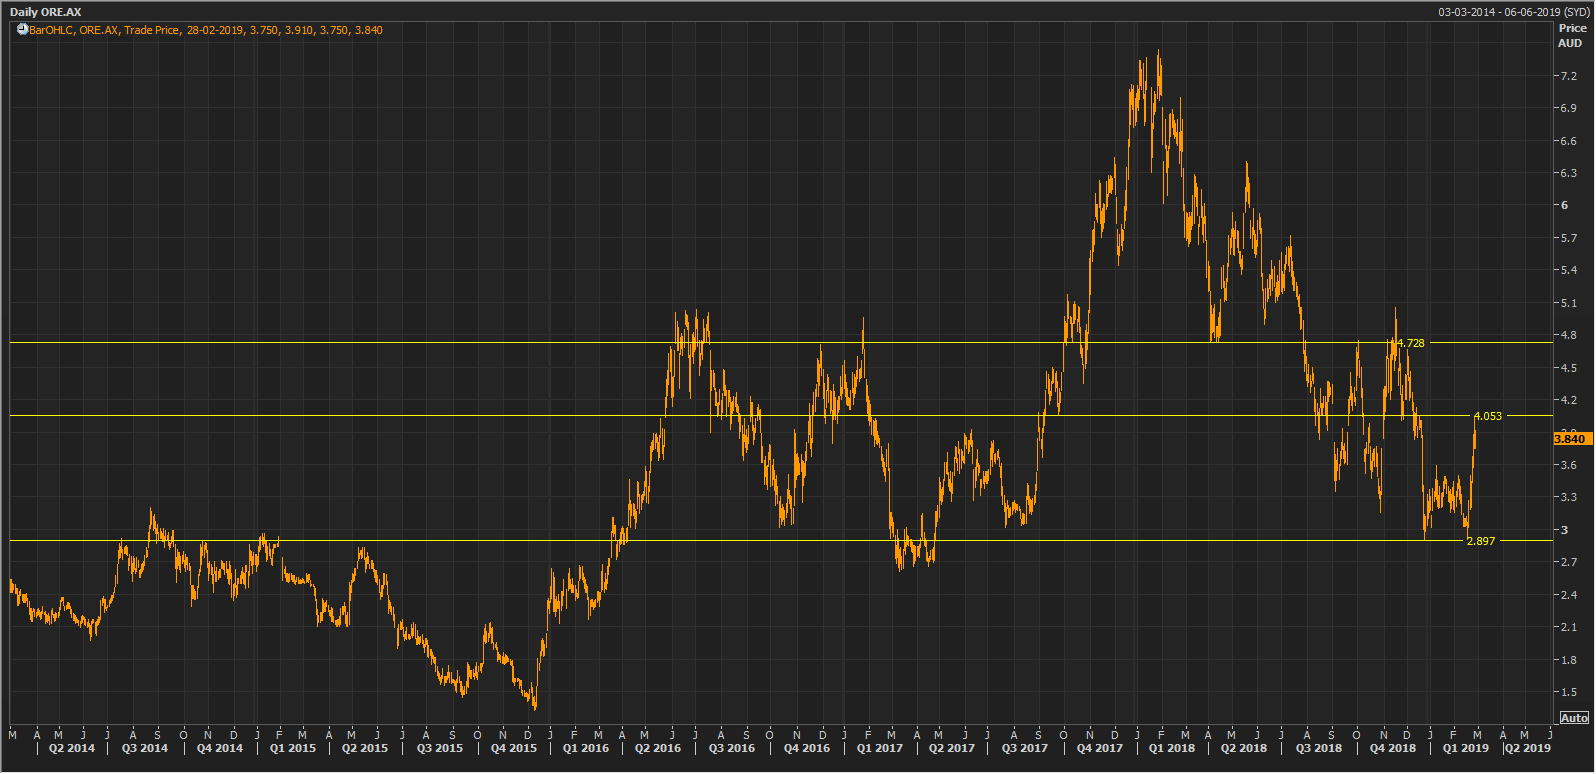
ORE Daily Chart (Source: Thomson Reuters)
Evolution Mining Limited
Strong operational performance expected: Evolution Mining Limited (ASX: EVN) has acquired 11.05 million shares, representing a 19.9% shareholding, in Tribune Resources Limited for a cash consideration of A$41.3 million.
For 1H FY19, the company reported an underlying net profit after tax of $92.2 million for the period to 31 December 2018 vis-à-vis $124.7 million reported for the pcp. The lower profit was driven predominantly by the impact of non-cash related items. The cash related items impacted A$11.3 million while non-cash items impacted profit by A$32.2 million.
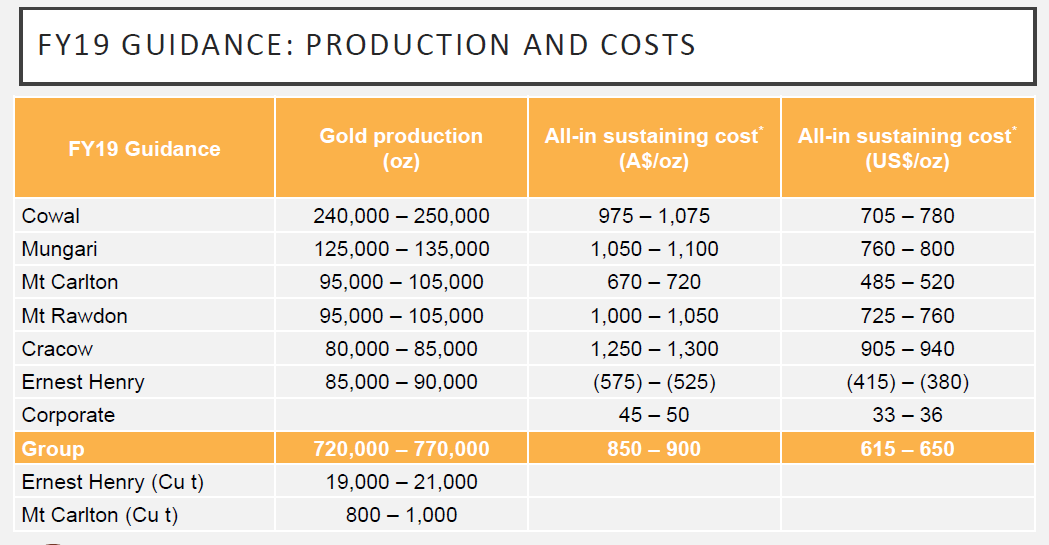
EVN’s Production & Cost Guidance (Source: Company Reports)
What to Expect From EVN: The management’s full-year production and cost guidance remains unchanged. This indicates a planned improved operational performance for the second half of the financial year.
If we look at the past six months’ performance, the stock has gained by 30.69%. Thus, considering decent outlook and the stock performance in the past three months, we maintain our “Buy” recommendation on the stock at the current market price of $3.610 per share.
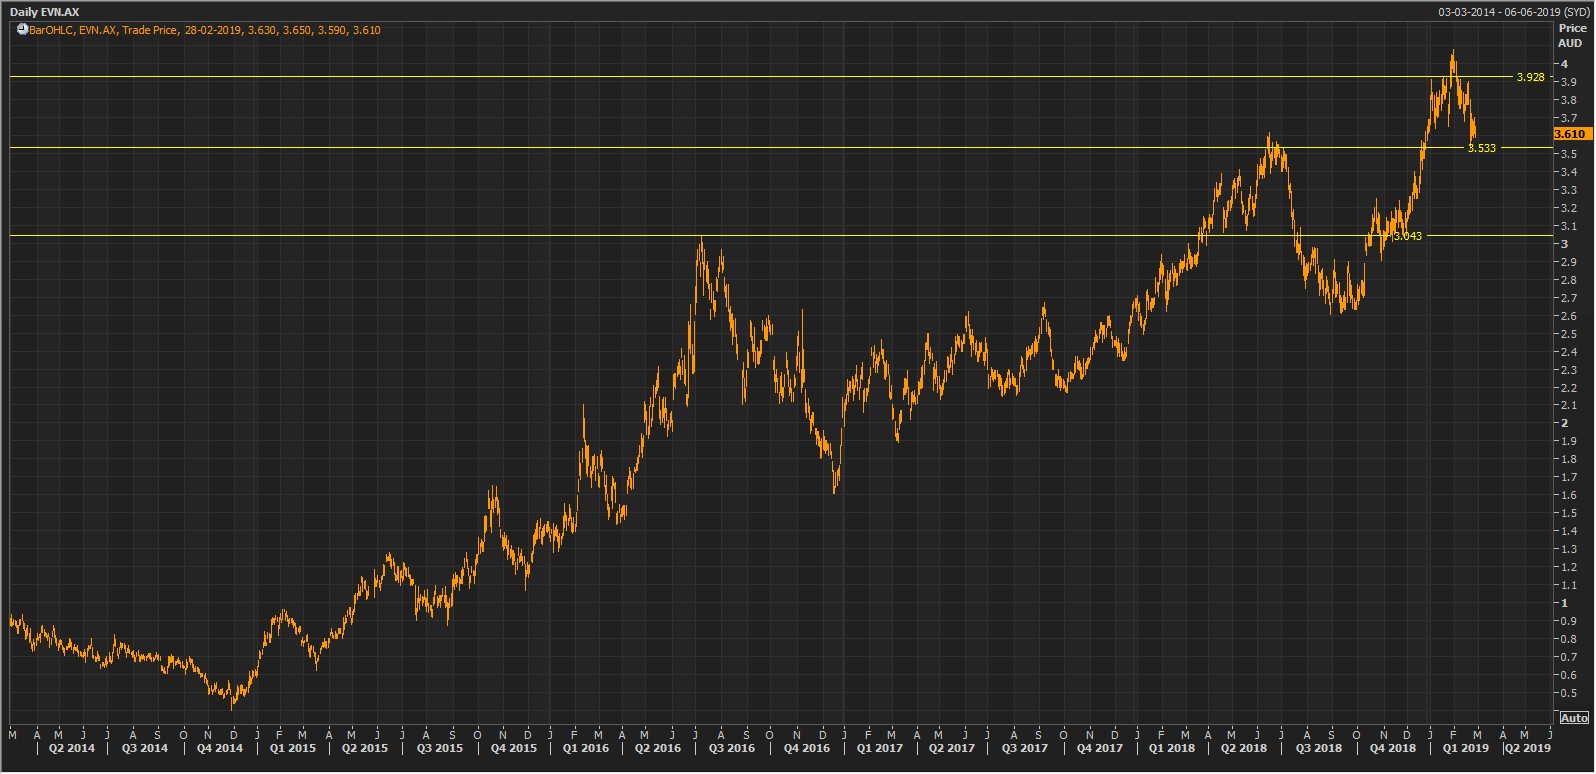
EVN Daily Chart (Source: Thomson Reuters)
Origin Energy Limited
Higher oil linked revenues:Origin Energy Limited (ASX: ORG) stated that the Australian Energy Regulator released its draft determination of a Default Market Offer (DMO) for customers on standing offers in New South Wales, Queensland and South Australia.The annual impact of this draft determination, from current tariffs, is estimated to be a $44 million reduction in pre-tax earnings from FY2020.
For 1H FY19, the company’s underlying EBITDA was $1,727 million, with an underlying Profit of $592 million, reflecting higher oil linked revenues in Integrated Gas and reduced financing costs from lower debt and a lower average interest rate.
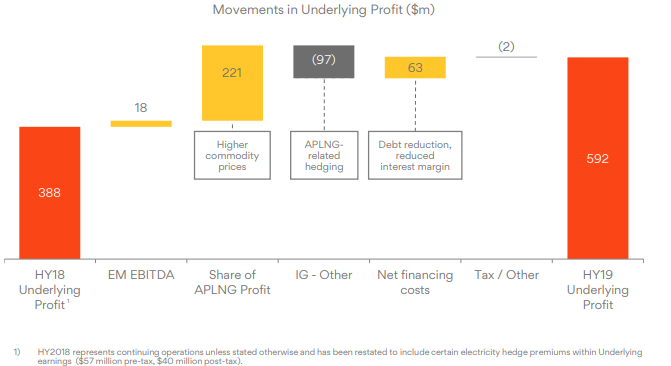
ORG’s Underlying Profit (Source: Company Reports)
What to Expect Moving Forward: For FY 2019, with respect to energy markets, the company expects that the Underlying EBITDA ranging between $1.5 - $1.6 billion.A Capex of $385-445 million, excluding APLNG capex and OC Energy acquisition. It also expects 10 cps fully franked final dividend. By considering a decent outlook and higher oil linked revenue, we maintain our “Buy” recommendation on the stock at the current market price of $7.360 per share.
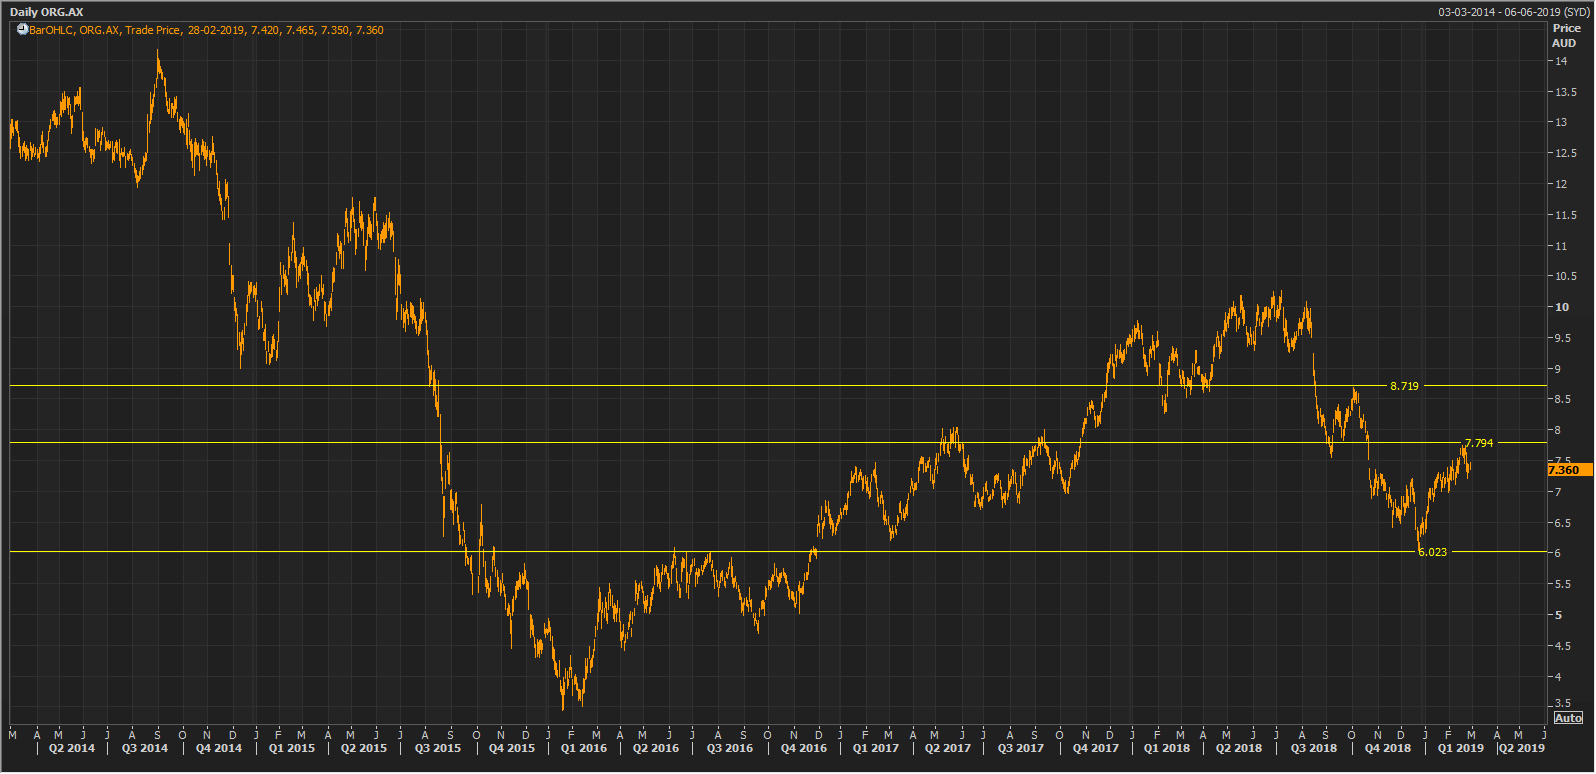
ORG Daily Chart (Source: Thomson Reuters)
Disclaimer
The advice given by Kalkine Pty Ltd and provided on this website is general information only and it does not take into account your investment objectives, financial situation or needs. You should therefore consider whether the advice is appropriate to your investment objectives, financial situation and needs before acting upon it. You should seek advice from a financial adviser, stockbroker or other professional (including taxation and legal advice) as necessary before acting on any advice. Not all investments are appropriate for all people. Kalkine.com.au and associated pages are published by Kalkine Pty Ltd ABN 34 154 808 312 (Australian Financial Services License Number 425376). The information on this website has been prepared from a wide variety of sources, which Kalkine Pty Ltd, to the best of its knowledge and belief, considers accurate. You should make your own enquiries about any investments and we strongly suggest you seek advice before acting upon any recommendation. Kalkine Pty Ltd has made every effort to ensure the reliability of information contained in its newsletters and websites. All information represents our views at the date of publication and may change without notice. To the extent permitted by law, Kalkine Pty Ltd excludes all liability for any loss or damage arising from the use of this website and any information published (including any indirect or consequential loss, any data loss or data corruption). If the law prohibits this exclusion, Kalkine Pty Ltd hereby limits its liability, to the extent permitted by law to the resupply of services. There may be a product disclosure statement or other offer document for the securities and financial products we write about in Kalkine Reports. You should obtain a copy of the product disclosure statement or offer document before making any decision about whether to acquire the security or product. The link to our Terms & Conditions has been provided please go through them and also have a read of the Financial Services Guide. On the date of publishing this report (mentioned on the website), employees and/or associates of Kalkine Pty Ltd do not hold positions in any of the stocks covered on the website. These stocks can change any time and readers of the reports should not consider these stocks as advice or recommendations.
 AU
AU

 Please wait processing your request...