Challenger Limited
.png)
CGF Details
Period of Strong Net Flows and Positive Investment Markets:Challenger Limited (ASX: CGF) provides its services under two operating segments, i.e., Life and Funds Management.
Q1FY20 Performance: During the quarter ended 30 September 2019, the company reported total assets under management at $84 billion, up 3% on the previous quarter.Total annuity sales for the quarter stood at $842 million, up 14% on the previous quarter. While annuity sales in Australia witnessed a downfall of 11%, Japanese annuity sales went up by $180 million. Life net book witnessed a growth of 5.2% at $766 million. Funds under management net flows were reported at $437 million, reflecting a strong demand for quality active managers with diverse product offerings.
.png)
Total Assets Under Management (Source: Company Reports)
Results of AGM: The company recently provided an update on the key resolutions during the 2019 AGM. Peter Polson and Masahiko Kobayashi were re-elected as Directors of the company. Under the Challenger Performance Plan, approval was given to the grant of long-term hurdled performance share rights to Richard Howes, Managing Director and CEO of the company.
Outlook: Normalised net profit before tax in FY20 is expected to be between $500 million - $550 million.
Stock Recommendation: The stock of the company generated returns of 6.11% and 11.71% over a period of 1 month and 3 months, respectively. During the first quarter of FY20, total assets under management were driven by strong net flows across the business and positive investment markets. Total Life book also witnessed a growth despite ongoing disruption in the Australian wealth industry. Japanese sales increased significantly as a result of an expanded strategic relationship with the MS&AD Group. The company believes that the investment market conditions, including base interest rate levels, are consistent with the assumptions underpinning the guidance for FY20. Considering the above factors, we give a “Buy” recommendation on the stock at the current market price of $7.960, up 1.79% on 31 October 2019.
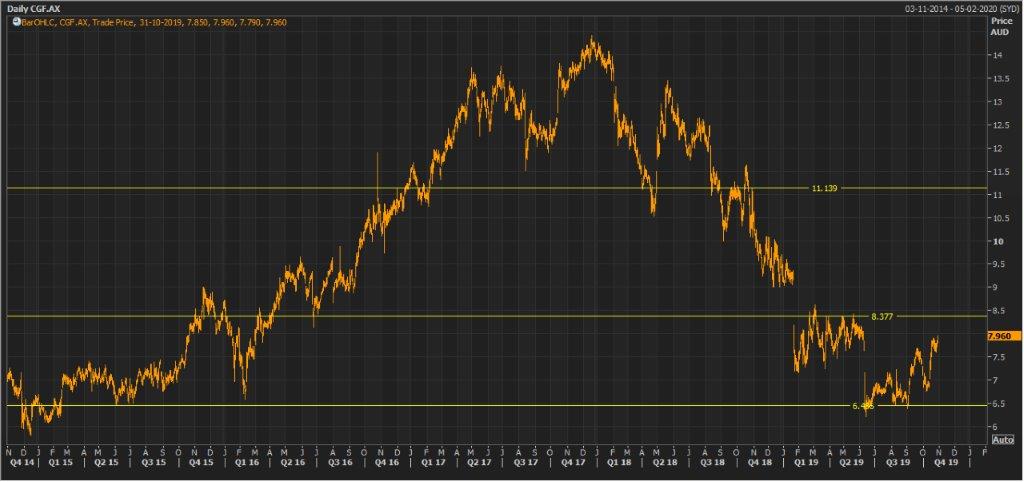
CGF Daily Technical Chart (Source: Thomson Reuters)
Viva Energy Group Limited
.png)
VEA Details
Improvement in Regional Refining Margins:Viva Energy Group Limited (ASX: VEA) is primarily engaged in the sale of fuel and speciality products through retail and commercial channels in Australia; management of a national supply, distribution and terminal network; and manufacturing activities at the Geelong oil refinery.
Quarterly Update: During the quarter ended 30 September 2019, the company reported a refining intake of 9.7 million barrels, as compared to 10.2 million barrels in the prior corresponding period.Geelong Refining Margin for the 3 months period stood at US$8.8/Barrel, supported by improved regional refining margins. In particular, the company witnessed an improvement in gasoline margins over levels achieved during the half year ended 30 June 2019.
.png)
Refining Segment Highlights (Source: Company Reports)
Under the retail segment, average sales volume for the Alliance channel was reported at 64.9 million litres per week through 3Q2019. This represented an increase of 1.4% on prior corresponding period and 9.1% on the average weekly sales volumes during 1H2019. Improved retail fuel pricing, loyalty program redemptions, and joint marketing campaigns with Coles, were some of the factors contributing to growth in Alliance volumes.
Stock Recommendation: The stock of the company generated negative returns of 14.71% and 8.14% over a period of 3 months and 6 months, respectively. During the September quarter, the company’s Geelong refining margin was impacted by higher crude premiums and planned maintenance of the Platformer in August 2019. The retail segment reported an improvement in Alliance volumes that is in-line with the strategy to initially stabilise volumes and then restore growth. The stock of the company is currently trading below the average of its 52-week trading range of $1.660 - $2.580. Given the backdrop of the above factors, we give a “Buy” recommendation on the stock at the current market price of $1.995, down 1.724% on 31 October 2019.
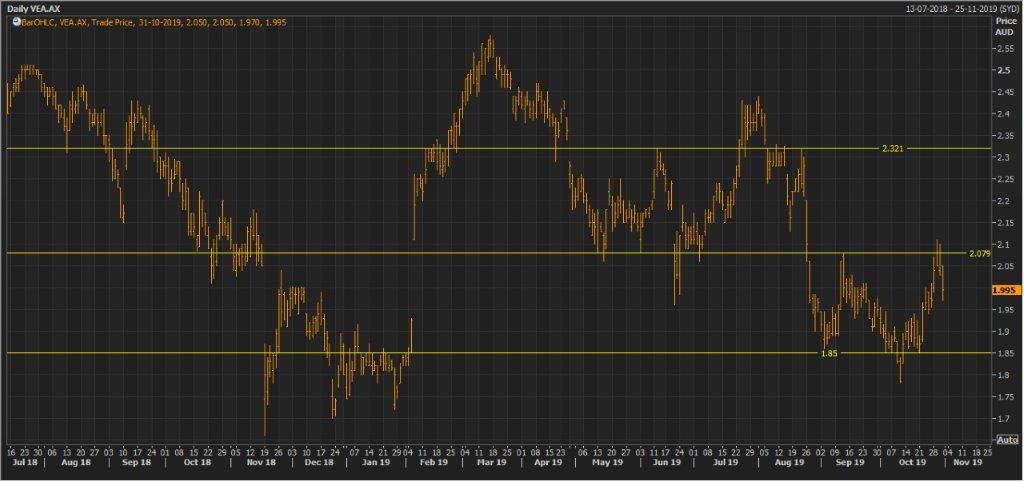
VEA Daily Technical Chart (Source: Thomson Reuters)
Nearmap Limited
.png)
NEA Details
Record Portfolio Growth in FY19: Nearmap Limited (ASX: NEA) is engaged in online aerial photomapping through its 100% owned subsidiaries, Nearmap Australia Pty Ltd, Nearmap Remote Sensing US, Inc., and Nearmap US, Inc. The company recently updated that Ian Morris, one of the Directors, acquired 400,000 shares for a consideration in the form of Director Options worth $158,000.
FY19 Key Highlights: During the year ended 30 June 2019, the company reported group annualised contract value of $90.2 million, up 36% on prior corresponding period. Statutory revenue for the period stood at $77.6 million, up 45% on prior corresponding period revenue of $53.6 million. Global subscriptions increased to 9,800, representing a growth rate of 11%. Group average revenue per subscription increased by 23% to $9,208, as compared to $7,473 in pcp.
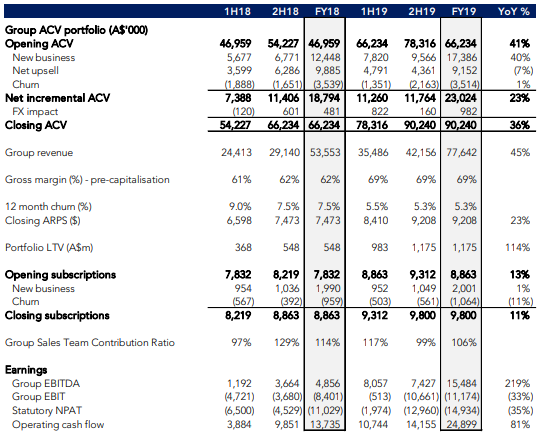
FY19 Performance (Source: Company Reports)
Outlook: In FY20, the company expects growth on the back of positive contribution from Nearmap 3D, the beta release of the Artificial Intelligence content and increased investment into people and technology.
Stock Recommendation: Over a period of 3 months, the stock generated negative returns of 18.79% and has a market capitalisation of $1.21 billion. In FY19, the company witnessed record growth in its portfolio, backed by expansion in product offering in the form of Nearmap 3D and beta release of the Artificial Intelligence content. In FY19, the company had an EBITDA margin of 21.3% as compared to 9.4% in FY18. Going forward, the company expects the above catalysts to promote decent growth in FY20. Considering the above factors, we give a “Buy” recommendation on the stock at the current market price of $2.680 on 31 October 2019.
.jpg)
NEA Daily Technical Chart (Source: Thomson Reuters)
Appen Limited
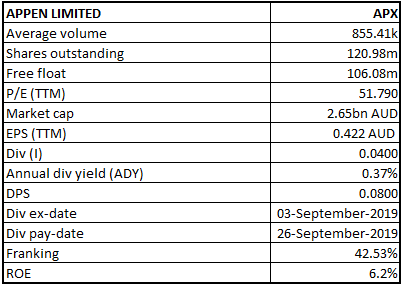
APX Details
NPAT for H1FY19 Increased By 32.5% on PCP:Appen Limited (ASX: APX) is involved in the provision of quality data solutions and services for machine learning and artificial intelligence applications for global technology companies, auto manufacturers and government agencies.
H1FY19 Key Highlights for the period ended June 30, 2019:Revenue increased by 60% in comparison to prior corresponding period to $245.1 million. Statutory NPAT increased at a rate of 33% to $18.6 million.The Board of Directors declared a final dividend of 4 cents per share, with record date and payment date on September 4, 2019 and September 26, 2019, respectively.
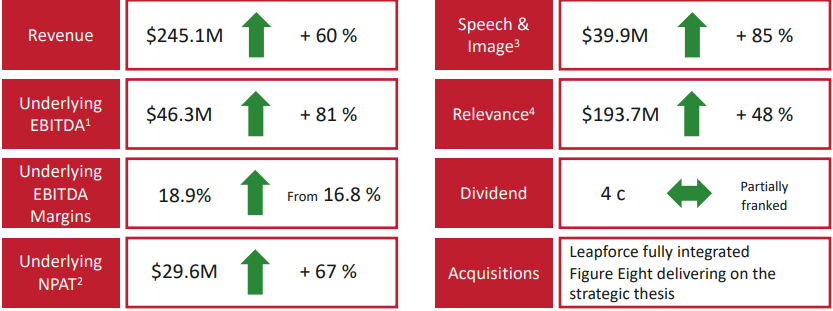
H1FY19 Key Metrics (Source: Company Reports)
What to Expect: Company’s underlying EBITDA for the year ending 31 December 2019 has been estimated to be at the upper end of the range $85 Mn - $90 Mn.
Stock Recommendation:Appen’s share generated a positive YTD return of 70.86%. Its gross margin and EBITDA margin for H1FY19 stood at 40.8% and 16.6%, better than the 1HFY18 results of 36.2% and 16.2%, respectively. Its debt to equity ratio for H1FY19 stood at 0.07x, lower than the industry median of 0.53x. Long term debt over total capital for H1FY19 stood at 6.9%, lower than the industry median of 23.5%. Hence, considering company’s decent first half top-line and bottom-line performance, promising EBITDA guidance and current trading levels, we recommend a “Buy” rating on the stock at the current market price of $21.870 on October 31, 2019.
.jpg)
APX Daily Technical Chart (Source: Thomson Reuters)
Scentre Group
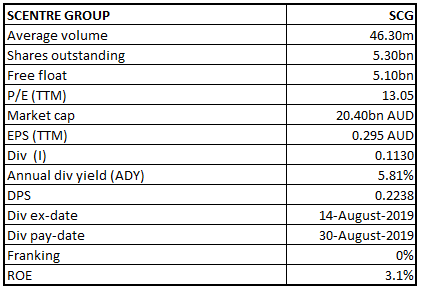
SCG Details
Visiting Customers in Sep’19 Quarter >535 Mn:Scentre Group (ASX: SCG) is involved in the development and management of property. On October 31, 2019, the company published its third quarter operating update, wherein it highlighted that its number of visiting customers grew above 535 Mn for the quarter. During the nine months ended 30 September 2019, the company completed 1,859 lease deals.
Growth in total in-store sales, specialty in-store sales, majors in-store sales for the quarter stood at 2.4%, 2.9% and -0.6%. An average specialty store in the company’s portfolio generated annual in-store sales of more than $1.52 Mn, which is expected to grow further. As per in-store business segment, top growth for the quarter was observed in Cinemas at 13.6%, followed by Retail Services at 8.2%; and Technology & Appliances at 6.0%.
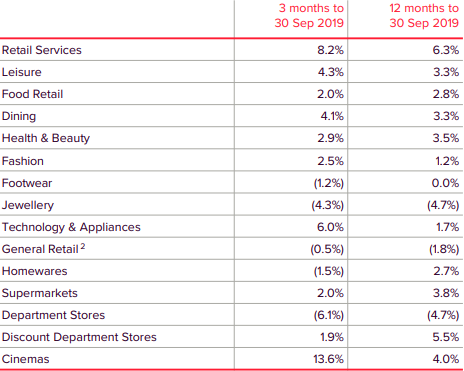
Comparable In-Store Sales Growth Data (Source: Company Reports)
In another update, the company informed that it bought back a total of 57,414,752 shares at $223,098,751.6, under its share buy-back program.
What to expect:As per the company’s half yearly report, forecasted growth in Funds from operations (FFO) growth per security stands at 0.7%, excluding the impact of an $800 Mn security buy-back program. The company has reconfirmed the distribution forecast for 2019 at 22.60 cents per security, an increase of 2%.
Stock Recommendation:SCG’s share generated a positive YTD return of 0.26%. Its gross margin and EBITDA margin for H1FY19 stood at 70.3% and 67.0%, better than the H1FY18 results of 68.4% and 65.1%, respectively. Its current ratio for H1FY19 stood at 0.43x, better than H1FY18 result of 0.22x. On the valuation front, its EV/EBITDA and Price to Cash Flow multiples on TTM basis stand at 17.4x and 15.6x, lower than the industry median of 20.5x and 19.6x, respectively, indicating undervalued position at the current juncture. Hence, considering the company’s decent third quarter operational performance, positive FFO and distribution forecast and current trading levels, we recommend a “Buy” rating on the stock at the current market price of $3.830, down 0.519% on October 31, 2019.
.jpg)
SCG Daily Technical Chart (Source: Thomson Reuters)
OOH! Media Limited
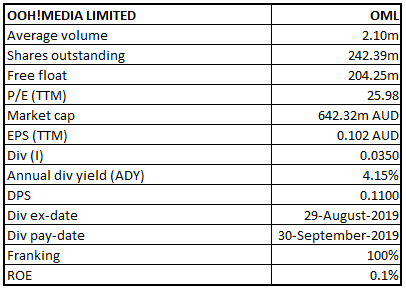
OML Details
Growth in Key Portfolio Products: OOH! Media Limited (ASX: OML) is a media company, offering advertisers the ability to create deep engagement between people and brands across one of the largest and most diverse out of home location-based portfolios in Australia and New Zealand. Recently, Perennial Value Management Limited ceased to be a substantial holder in the company, effective from October 24, 2019. In another update, OML announced appointment of David Wiadrowski as an independent Non-Executive Director, with effect from November 29, 2019.
H1FY19 Financial Highlights:During the half year ended 30 June 2019, pro-forma revenue increased by 5% on pcp to $304.9 Mn. Underlying Net Profit After Tax (NPAT) decreased by 24% on pcp to $9 Mn.
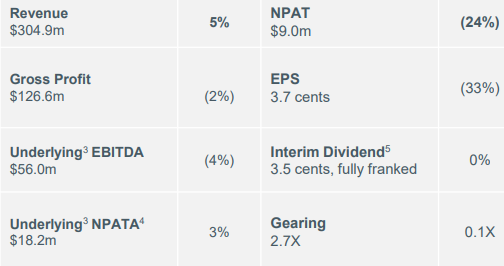
H1FY19 Key Financial Metrics (Source: Company Reports)
What to expect:Underlying EBITDA guidance for FY19 has been estimated in the range of $125 Mn and $135 Mn, excluding integration costs and the impact of AASB16, revised from the previous guidance of $152 Mn and $162 Mn.
Stock Recommendation:OML’s share generated a negative YTD return of 22.06% and is currently trading below the average of 52-week high and low level of $4.800 and $2.290, respectively. Its gross margin and EBITDA margin for H1FY19 stood at 68.5% and 46.5%, better than the H1FY18 results of 45.6% and 19.7%, respectively. On the valuation front, its price to cash flow and price to book value multiples on NTM basis, stand at 4.0x and 0.9x, lower than the industry median of 6.3x and 1.1x, respectively, indicating undervalued position at the current juncture. Hence, considering the company’s decent top-line performance, valuation, and current trading levels, we recommend a “Speculative Buy” rating on the stock at the current market price of $2.760, up 4.151% on October 31, 2019.
.jpg)
OML Daily Technical Chart (Source: Thomson Reuters)
Sandfire Resources NL
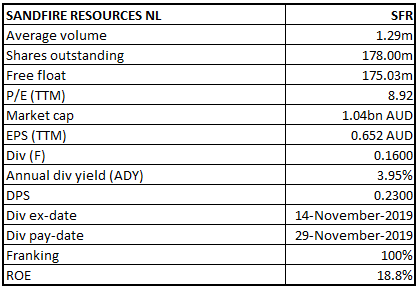
SFR Details
SFR’s American Subsidiary Provided Update on Black Butte Copper Project:Sandfire Resources NL (ASX: SFR) is involved in the production and sale of copper concentrate, containing gold and silver by-products from the Group’s 100% owned DeGrussa Operations in Western Australia. Recently, company’s 85% owned subsidiary, Sandfire Resources America Inc. announced update on NI 43-101 Mineral Resource Estimate for the Johnny Lee Deposit, the cornerstone deposit of the Black Butte Copper Project in Montana, USA. It reported a Measured and Indicated Mineral Resource of 10.9 million tonnes at an average copper grade of 2.9% Cu for 311,000 tonnes of contained copper at a 1.0% Cu cutoff grade; and Inferred Mineral Resource of 2.7 Mt at an average copper grade of 3.0% Cu for 80 kt of contained copper at a 1.0% Cu cut-off grade.
September’19 Quarter Key Highlights:During the quarter, the company completed an acquisition of 100% of MOD Resources Limited, strengthening its global copper exploration and development pipeline. Net profit after tax attributable to members was reported at $106.5 Mn for FY19 on the total sales revenue of $592.2 Mn.
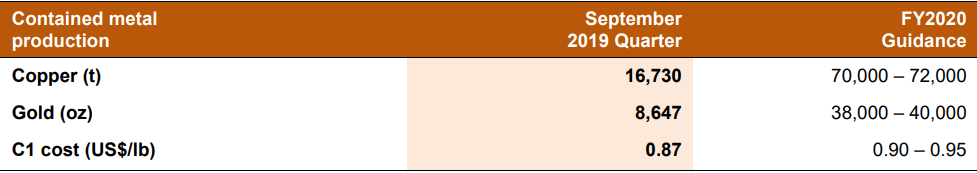
September’19 Quarter Key Metrics (Source: Company Reports)
FY20 Guidance:Production guidance for FY20 has been refined to 70,000 – 72,000 tonnes of contained copper metal with gold production between 38,000 – 40,000 ounces of contained gold.Headline C1 cash operating costs are expected to be within the range of US$0.90-0.95/lb with the impact of lower expected production offset by the reduced currency exchange rate.
Stock Recommendation:SFR’s share generated a negative YTD return of 9.06%. Its gross margin, EBITDA margin and net margin for FY19 stood at 67.1%, 49.6% and 17.6%, better than industry median of 42.0%, 29.1% and 11.0%, respectively, implying decent fundamentals for the company. Its ROE for FY19 stood at 18.8%, better than the industry median of 12.3%. Its current ratio for FY19 stood at 4.99x, better than the industry median of 1.75x. Currently, the stock is trading below the average of its 52-week high and low of $8.340 - $5.510. Hence, considering the aforesaid facts and current trading levels, we recommend a “Buy” rating on the stock at the current market price of $5.810, down 0.172% on October 31, 2019.
.jpg)
SFR Daily Technical Chart (Source: Thomson Reuters)
Disclaimer
The advice given by Kalkine Pty Ltd and provided on this website is general information only and it does not take into account your investment objectives, financial situation or needs. You should therefore consider whether the advice is appropriate to your investment objectives, financial situation and needs before acting upon it. You should seek advice from a financial adviser, stockbroker or other professional (including taxation and legal advice) as necessary before acting on any advice. Not all investments are appropriate for all people. Kalkine.com.au and associated pages are published by Kalkine Pty Ltd ABN 34 154 808 312 (Australian Financial Services License Number 425376). The information on this website has been prepared from a wide variety of sources, which Kalkine Pty Ltd, to the best of its knowledge and belief, considers accurate. You should make your own enquiries about any investments and we strongly suggest you seek advice before acting upon any recommendation. Kalkine Pty Ltd has made every effort to ensure the reliability of information contained in its newsletters and websites. All information represents our views at the date of publication and may change without notice. To the extent permitted by law, Kalkine Pty Ltd excludes all liability for any loss or damage arising from the use of this website and any information published (including any indirect or consequential loss, any data loss or data corruption). If the law prohibits this exclusion, Kalkine Pty Ltd hereby limits its liability, to the extent permitted by law to the resupply of services. There may be a product disclosure statement or other offer document for the securities and financial products we write about in Kalkine Reports. You should obtain a copy of the product disclosure statement or offer document before making any decision about whether to acquire the security or product. The link to our Terms & Conditions has been provided please go through them and also have a read of the Financial Services Guide. On the date of publishing this report (mentioned on the website), employees and/or associates of Kalkine Pty Ltd do not hold positions in any of the stocks covered on the website. These stocks can change any time and readers of the reports should not consider these stocks as advice or recommendations.
 AU
AU

 Please wait processing your request...