Scentre Group
.png)
SCG Details
Decent Growth in FFO:Scentre Group (ASX: SCG) is in the management and development of property with a market capitalisation of A$20.93 Bn as on 30th September 2019. Recently, the company has bought back a total of 15,632,116 shares via on-market trade for the total consideration of A $61,539,376.87. The group intends to buy back shares with an aggregate total consideration of up to $800 Mn. The company has recently published its half-year results to 30 June 2019, wherein, it reported funds from operations amounting to $676.2 Mn, and on a per security basis, the FFO stood at 12.75 cents.
.png)
Half Year Results (Source: Company Reports)
What to Expect:With respect to Westfield Carindale, the company announced that Kmart would be introduced and will be located on the second level of the existing David Jones store. The fitout of the latest format David Jones store is progressing well and is on track to open in the month of October 2019. SCG anticipates FFO growth per security of around 0.7%, which includes the impact of the transactions announced in the 1H. However, this guidance does not consider the anticipated positive earnings impact of the up to $800 million security buy-back program.
Stock Recommendation:The Group reiterates the distribution forecast for 2019 of 22.60 cents per security, reflecting a rise of 2%. %. On the analysis front, SCG looks decent with Net Margin at 87.1% in FY19 as compared to industry median of 85.4%. Return to the shareholders has also been good with ROE coming in at 9.8%, which is higher than the industry median of 9.7%. On a YTD basis, the stock produced a return of 2.60%. Currently, the stock is available at a price to earnings ratio of 13.35x, which is lower than the industry median of 18.2x (Residential & Commercial REITs). Hence, considering the aforesaid facts and decent outlook in the long run, we give a “Buy” recommendation on the stock at the current market price of A$3.930 per share (down 0.254% on 30th September 2019).

SCG Daily Technical Chart (Source: Thomson Reuters)
Pendal Group Limited
.png)
PDL Details
FY19 results to be released on 6th November 2019:Pendal Group Limited (ASX: PDL) is into the provisioning of investment management services. The market capitalisation of the company stood at ~A$2.37 Bn as on 30th September 2019. The company recently announced that it has become an initial substantial holder of Rural Funds Group on 24th September 2019 with the voting power of 5.03%. For the quarter ended 30th June 2019, Pendal Australia experienced net outflows of -$2.0 Bn primarily as a result of the previously announced Westpac redemption of $1.5 Bn which comprised $2.1 billion redeemed from legacy book partially offset by $0.6 billion coming into Westpac other book, all part of one transaction. The company will be announcing its full-year results on 6th November 2019.
.png)
Funds Under Management (Source: Company Reports)
Future Aspects:As per the half-year results, the company is well-placed to take advantage of opportunities to expand its capabilities and global presence, in accordance with its focused strategy around growth and diversification, besides the more difficult trading conditions.The company also possesses a strong balance sheet with no debt and good cash flow, which could prove beneficial.It remains focused on expanding its investment and distribution capabilities, maintaining a disciplined approach to managing capacity as well as providing ongoing support to its investment talent through its investment-led culture and business model.
Stock Recommendation:When it comes to the past performance, the stock produced returns of 12.21% and 2.65% in the time period of one month and three months, respectively. As per ASX, the stock is trading below its 52-week low-high average. It can be said that current trading levels are decent for accumulation. During 1HFY19, the company reported decent margins as compared to the concerned industry. It reported Gross and Net margin of 100.0% and 28.6%, which were higher than the industry median of 94.8% and 27.0%, respectively. Further, the returns generated for the shareholders are higher than the industry as the ROE was reported at 7.9% in 1HFY19 as compared to the industry median of 3.9%. It has a favourable capital structure with a current ratio of 1.53x with nil debt in 1HFY19. Thus, considering the above-stated facts and current trading levels, we give a “Buy” recommendation on the stock at the current market price of A$7.390 per share (up 0.544% on 30th September 2019).
.png)
PDL Daily Technical Chart (Source: Thomson Reuters)
Alumina Limited
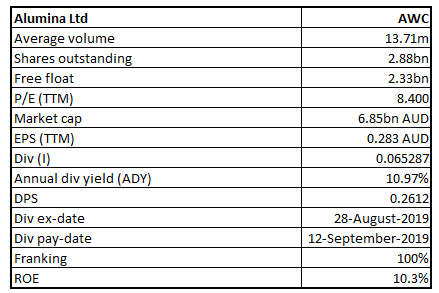
AWC Details
New Operating Model of Alcoa:Alumina Limited (ASX: AWC) has a joint venture interest in bauxite mining, alumina refining, alumina-based chemicals and aluminium smelting via its 40 per cent interest in the series of operating entities of Alcoa World Alumina & Chemicals (AWAC). The market capitalisation of the company stood at ~$6.85 billion as on 30th September 2019. The global leader in bauxite, alumina and aluminium products, Alcoa Corporation, announced that from 1st November 2019, it will implement a new operating model that will result in a leaner, more integrated, operator-centric, organisation that will accelerate the company’s strategic priorities.
Alcoa will eliminate its business unit structure and consolidate sales, procurement and other commercial capabilities at an enterprise level. This new structure will reduce overhead, promote operational and commercial excellence, increase connectivity between the Company’s plants and leadership, ensure a continued focus on safety as its highest priority and position Alcoa for sustainable profitability.

AWAC Joint Venture (Source: Company Reports)
Stock Performance:On the stock’s performance front, it produced returns of 10.19% and 0.42% in the last one month and three months, respectively. Currently, the stock is trading slightly below the average of 52 weeks high and low of $3.20 and 2.07, respectively, indicating a decent opportunity for accumulation. During 1HFY19, the company reported a net margin of 9,586.4%, which was well above the industry median of 15.9%. Moreover,ROE of 10.3% was also above the industry median of 6.2%.Hence, in view of aforesaid parameters, decent outlook and current trading levels, we give a “Buy” recommendation on the stock at the current market price of A$2.370 per share (down 0.42% on 30th September 2019).
.png)
AWC Daily Technical Chart (Source: Thomson Reuters)
Collection House Limited
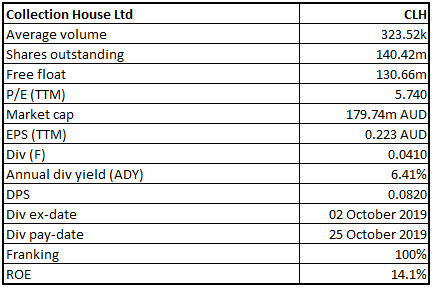
CLH Details
Annual General Meeting to be held on 1 November 2019: Collection House Limited (ASX: CLH) is Australia’s leading end-to-end receivables management company. It provides solutions to organisations and individuals that span the entire credit management lifecycle and beyond. The market capitalisation of the company stood at ~$179.74 million as on 30th September 2019. Recently, the Group announced that the Annual General Meeting will be held on 1st November 2019 at Hotel Pullman.
FY19 Result Highlights: The group reported a total revenue of $161.1 million up by 12% on the previous corresponding period and consolidated Net Profit after Tax of $30.7 million up by 18%.Several factors caused the business to deliver slightly lower than expected underlying cash results for the year. However, the impact of these factors has eased and the underlying cash performance since the start of FY20 has significantly improved.
Segmental Performance: The Purchase Debt Ledger (PDL) segment reported revenue of $93.7 million, up 25% on FY18. This includes a $9.8 million pre-tax profit from the PEP transaction with Balbec previously announced. This transaction liberated capital from mature payment arrangements, lessening the company’s requirement for additional debt capital to fund investments in new PDL acquisitions to drive growth and improved financial returns.
Collection Services revenue was $67.6 million, down 2% on prior year. The shortfall was driven by short term external factors, being the timing of the federal election and the Financial Services Royal Commission, which both impacted client activity.As this was expected to be a short-term trading downturn, collection resources were maintained during the year. Management considers this a reasonable result during a period of significant market disruption for clients.
Outlook for FY20: The outlook for Collection House in FY20 is positive as it continues to grow its market share in Australia and New Zealand through the acquisition of debt portfolios at the right price.For the first time, the company has provided Cash Collection guidance for the PDL segment at $145-155 million, including PDL purchases of $80-100 million in FY20.
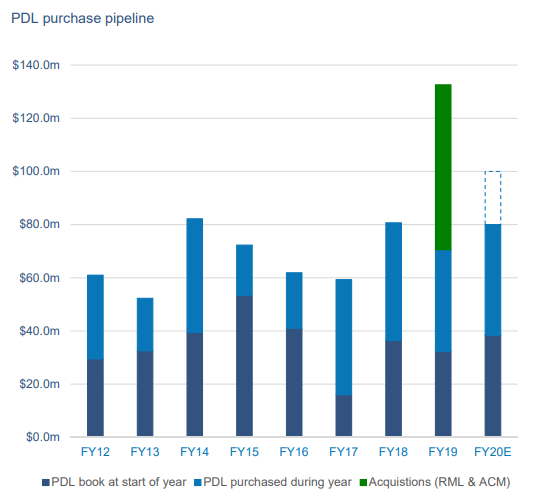
PDL Purchase Pipeline (Source: Company Reports)
Stock Performance:On the stock’s performance front, it produced returns of 18.52% and 5.79% in the last one month and three months, respectively. The company has declared a fully franked final dividend of 4.1 cents per share. The record date is 3rd October 2019 and payment date will be 25th October 2019. Hence, in view of aforesaid parameters, decent outlook and current trading levels, we give a “Buy” recommendation on the stock at the current market price of $1.290 per share (up 0.781% on 30th September 2019).
.png)
CLH Daily Technical Chart (Source: Thomson Reuters)
Pinnacle Investment Management Group Limited
PNI Details
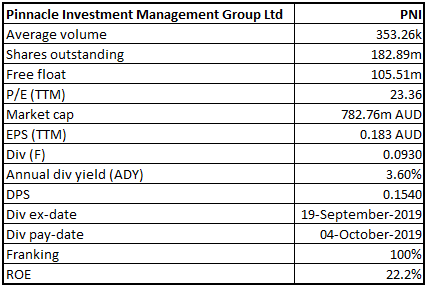
Final Dividend to be Paid on 4 October 2019:Pinnacle Investment Management Group Limited (ASX: PNI) is a leading Australia-based multi-affiliate investment management firm. It develops and operates investment management businesses and provides distribution services, business support and responsible entity services to the Pinnacle Affiliates. The market capitalisation of the company stood at ~$782.76 million as on 30th September 2019. The company has declared a fully franked final dividend of 9.3 cents per share. The record date was 20th September 2019 and payment date will be 4th October 2019.
Updates on FUM: The FUM (Funds Under Management) of PNI’s thirteen Affiliates on 30th June 2019 stood was $54.3 billion, reflecting an increase in FUM of $16.3 billion or 42.9% during FY19, comprising FUM acquired of $6.8 billion, net inflows of $6.5 billion and market movement/ investment performance of $3.0 billion. The FUM reported a CAGR growth of 28.5% p.a. over the last 10 years (26.8% excluding the acquired FUM) and 34.6% over the last five years (31% excluding acquired FUM).
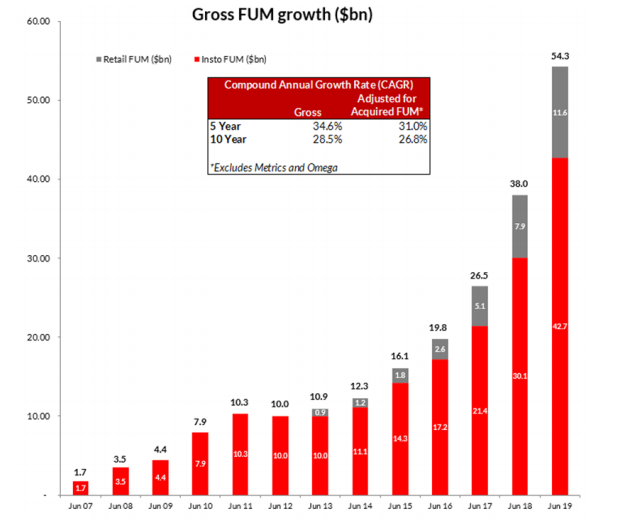
Gross FUM Growth (Source: Company Reports)
Stock Performance:On the stock’s performance front, it produced returns of -4.89% and -3.60% in the last one month and three months, respectively. Currently, the stock is trading close to its 52-week low price of $3.80 with PE multiple of 23.36x and an annual dividend yield of 3.6%. Hence, considering the aforesaid parameters and current trading levels, we give a “Buy” recommendation on the stock at the current market price of $4.400 per share (up 2.804% on 30th September 2019).
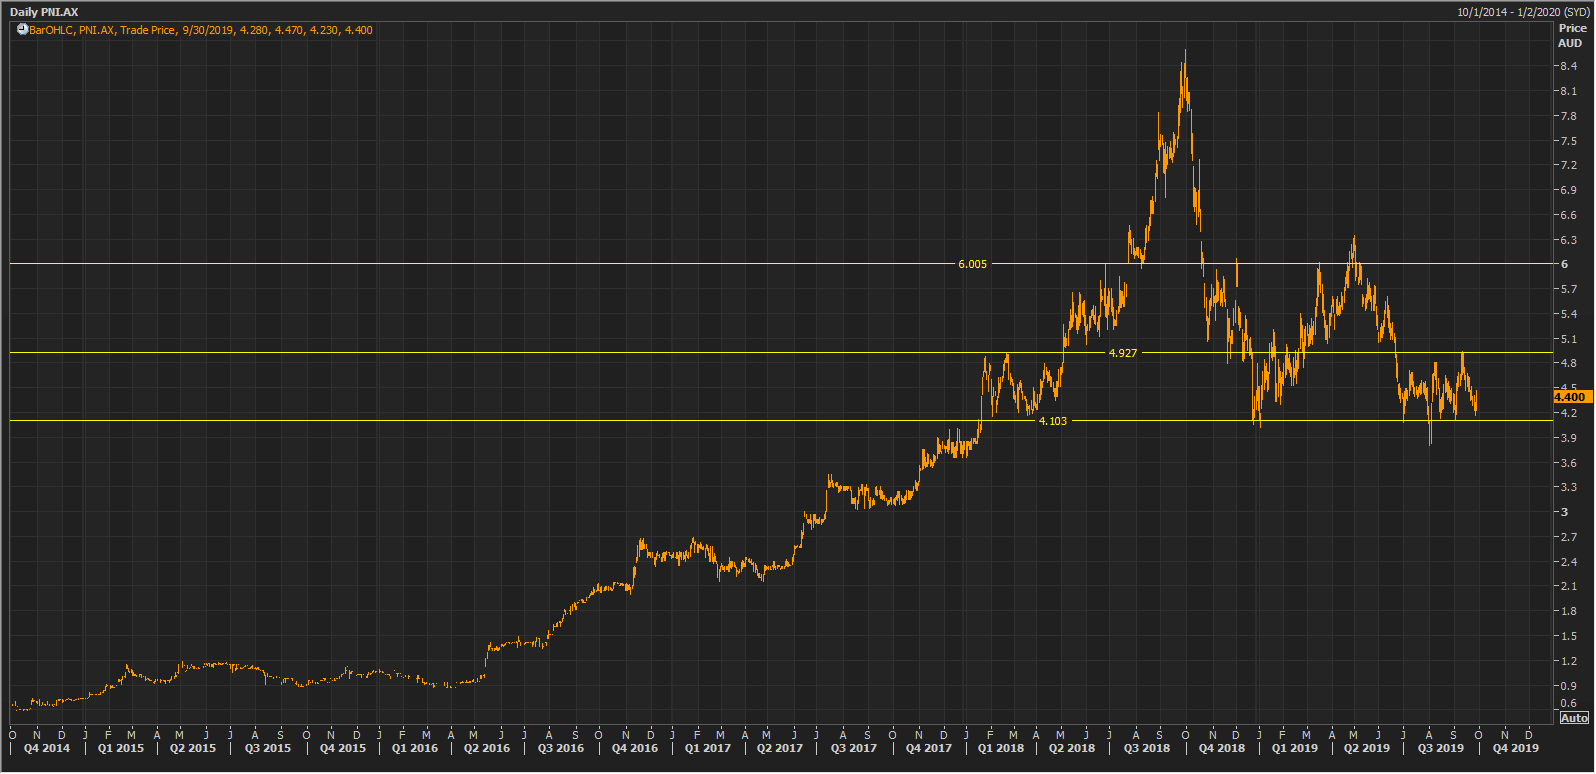
PNI Daily Technical Chart (Source: Thomson Reuters)
Macmahon Holdings Limited
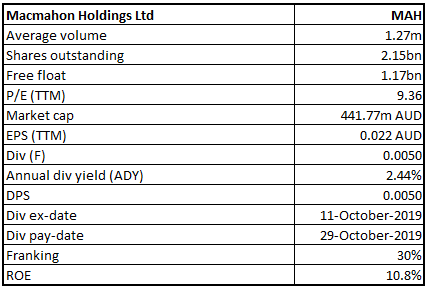
MAH Details
Appointment of Additional Directors: Macmahon Holdings Limited (ASX: MAH) offers the complete package of mining services to miners throughout Australia and Southeast Asia. It has extensive experience in both surface and underground mining.
Recently, the company has appointed Mr Bruce Munro and Mr Hamish Tyrwhitt as the independent non-executive directors of the company, effective from October 1, 2019. Both individuals have spent decades in the contracting industry in senior executive and director roles and will now bring the benefit of their industry knowledge, experience and networks to the Macmahon Board.
Outlook for FY20: The company is well-positioned for growth in FY20 with secured work in hand of $1.2 billion. The company expects FY20 revenue of $1.2-$1.3 billion and EBIT of $80-90 million.Over the past 12 months, the company has continued to position the business for growth, both organically and through the strategic acquisition of specialist underground contractor GBF Group.
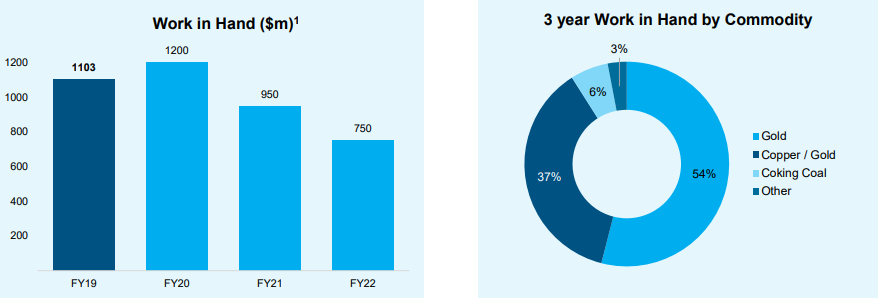
Work in Hand of Future Years (Source: Company Reports)
Stock Performance:On the stock performance front, it produced returns of 5.13% and -8.89% in the last three months and six months, respectively. Over the past five years, the margins of the company have improved but are still below the industry medians. During FY19, the company reported EBITDA and Net margin of 15.1% and 4.2% respectively as compared to the industry median of 29.1% and 11.0% respectively. Similarly, the returns to its shareholders have improved but are still less than its peers as its ROE of 10.8% was below the industry median of 12.3% in FY19. The top line of the company has improved over the past 5 years at a CAGR of 13.7%. The company enjoys decent balance sheet position with debt/equity ratio of 0.37x and current ratio of 1.45x as on 30 June 2019. Hence, in view of aforesaid parameters, decent outlook and current trading levels, we give a “Buy” recommendation on the stock at the current market price of $0.205 per share.
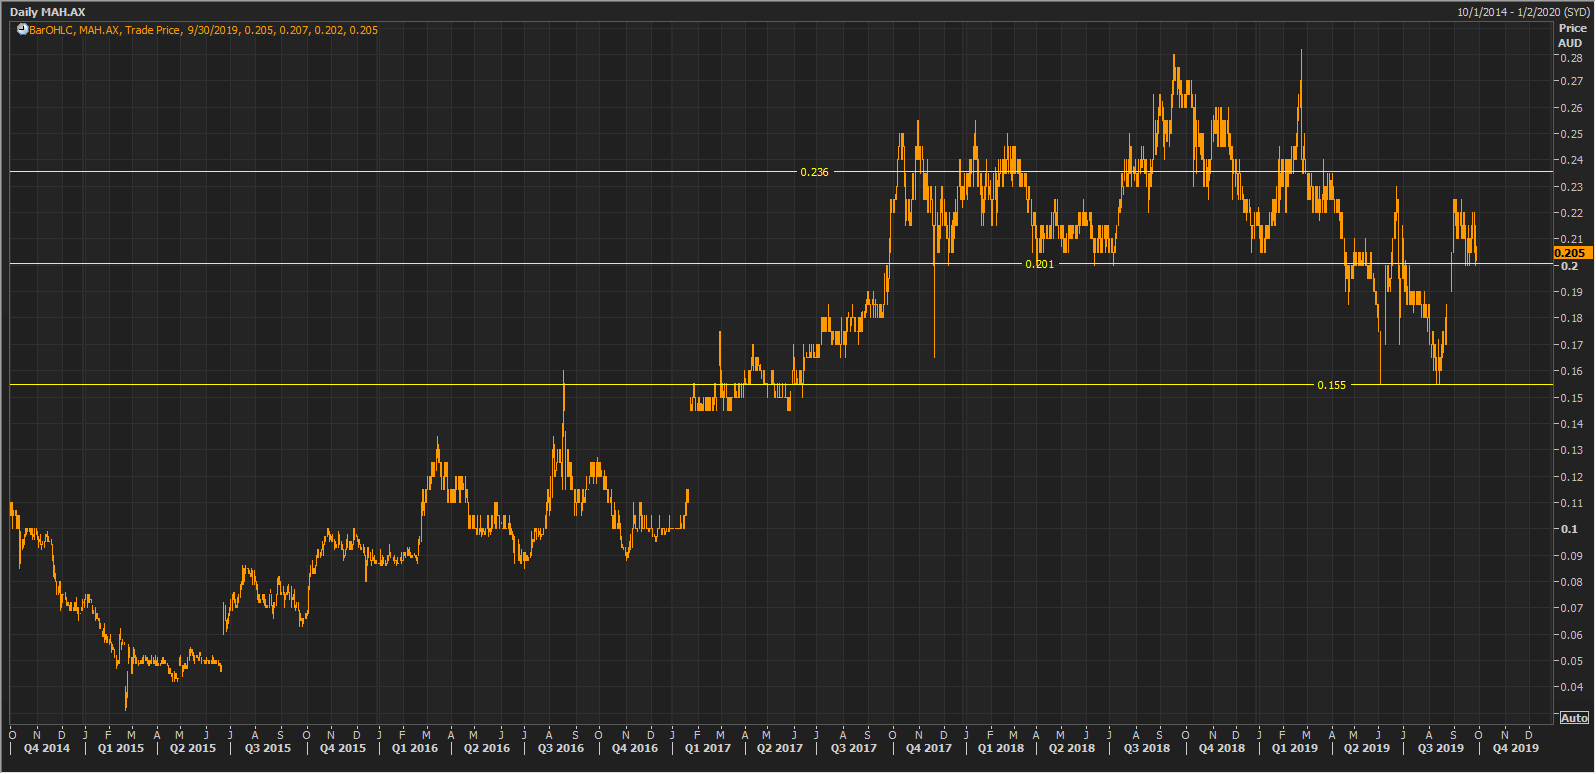
MAH Daily Technical Chart (Source: Thomson Reuters)
Disclaimer
The advice given by Kalkine Pty Ltd and provided on this website is general information only and it does not take into account your investment objectives, financial situation or needs. You should therefore consider whether the advice is appropriate to your investment objectives, financial situation and needs before acting upon it. You should seek advice from a financial adviser, stockbroker or other professional (including taxation and legal advice) as necessary before acting on any advice. Not all investments are appropriate for all people. Kalkine.com.au and associated pages are published by Kalkine Pty Ltd ABN 34 154 808 312 (Australian Financial Services License Number 425376). The information on this website has been prepared from a wide variety of sources, which Kalkine Pty Ltd, to the best of its knowledge and belief, considers accurate. You should make your own enquiries about any investments and we strongly suggest you seek advice before acting upon any recommendation. Kalkine Pty Ltd has made every effort to ensure the reliability of information contained in its newsletters and websites. All information represents our views at the date of publication and may change without notice. To the extent permitted by law, Kalkine Pty Ltd excludes all liability for any loss or damage arising from the use of this website and any information published (including any indirect or consequential loss, any data loss or data corruption). If the law prohibits this exclusion, Kalkine Pty Ltd hereby limits its liability, to the extent permitted by law to the resupply of services. There may be a product disclosure statement or other offer document for the securities and financial products we write about in Kalkine Reports. You should obtain a copy of the product disclosure statement or offer document before making any decision about whether to acquire the security or product. The link to our Terms & Conditions has been provided please go through them and also have a read of the Financial Services Guide. On the date of publishing this report (mentioned on the website), employees and/or associates of Kalkine Pty Ltd do not hold positions in any of the stocks covered on the website. These stocks can change any time and readers of the reports should not consider these stocks as advice or recommendations.
 AU
AU
 Please wait processing your request...