Altium Limited
.png)
ALU Details
Revenue Growth Across all Key Regions:Altium Limited (ASX: ALU) is engaged in the development and sale of computer software for the design of electronic products.
Highlights of FY19 Financial Performance:Revenue for the year ended 30 June 2019 amounted to US$171.8 million, up 23% on the previous financial year. During the year, the company reported EBITDA amounting to US$62.72 million, up 40% on prior corresponding period EBITDA of US$44.87 million. EBITDA margin for the period also improved, from 32.0% in FY18 to 36.5% in FY19. Profit after tax for the year went up by 41% to US$52.89 million, as compared to prior corresponding period profit of US$37.49 million. Full-year dividend went up by 26% in comparison to the previous year.
.png)
FY19 Financial Metrics (Source: Company Reports)
Stock Recommendation: The stock of the company generated returns of 50.50% over a period of one year and is currently trading close to its 52-week high level of $38.490.In FY19, new Altium Designer seats witnessed a record growth of 27% on pcp. The period was also marked by a record growth in subscription base to more than 43,600 subscribers. Revenue grew across all key regions, with China reporting outstanding growth of 37%. Through a set of new initiatives such as the new cloud platform Altium 365, the company is looking forward to achieving its 2025 target of US$500 million in revenue and a subscriber base of 100,000. Given the backdrop of the above factors and current trading levels, we have a watch stance on the stock at the current market price of $34.120, up 3.05% on 16 October 2019 and suggest investors to wait for better entry levels.
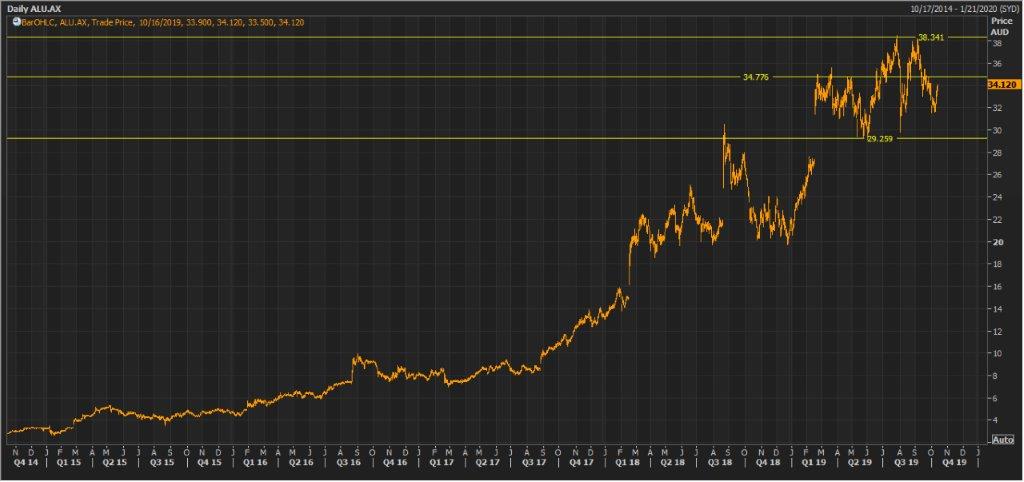
ALU Daily Technical Chart (Source: Thomson Reuters)
Appen Limited
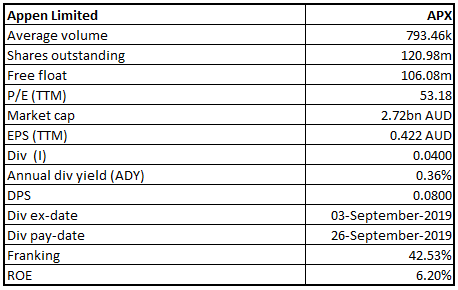
APX Details
Underlying EBITDA trending towards the Upper End of Guidance Range: Appen Limited (ASX: APX) is engaged in the provision of quality data solutions and services for machine learning and artificial intelligence applications for global technology companies. As per a recent update, the company notified about the issuance of 7,033 new fully paid ordinary shares for the purpose of vesting of performance rights.
1HFY19 Highlights: During the half-year ended 30 June 2019, revenue amounted to $245.1 million, up 60% on the prior corresponding period. Underlying EBITDA for the period stood at $46.3 million, up 81% on pcp. Statutory EBITDA increased at a rate of 48% on pcp. Underlying NPAT stood at $29.6 million, up 67% on prior corresponding period.
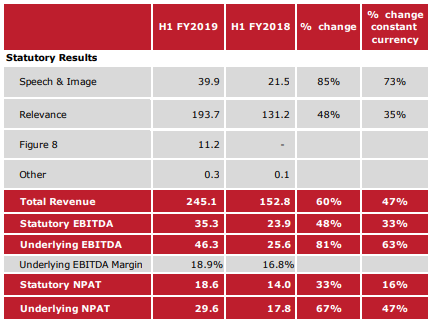
Snapshot of H1FY19 Results (Source: Company Reports)
Guidance: Full year underlying EBITDA for FY19 is expected to be between $85 million - $90 million and is trending towards the upper end of the range.
Stock Recommendation: The stock of the company generated negative returns of 23.74% and 9.65% over the period of 3 months and 6 months, respectively. In FY19, the company reported a strong growth in revenue along with the margin growth from relevance data after upgradation of the system and processes on integrating Leapforce into the business. EBITDA margin also improved from 16.8% to 18.9%. The company reported good progress on the performance of Figure Eight, which was acquired in April 2019. The acquisition is expected to help in revenue diversification and market expansion, becoming a new pillar for growth. Considering the above-stated factors, we give a “Buy” recommendation on the stock at the current market price of $22.850, up 1.736% on 16 October 2019.
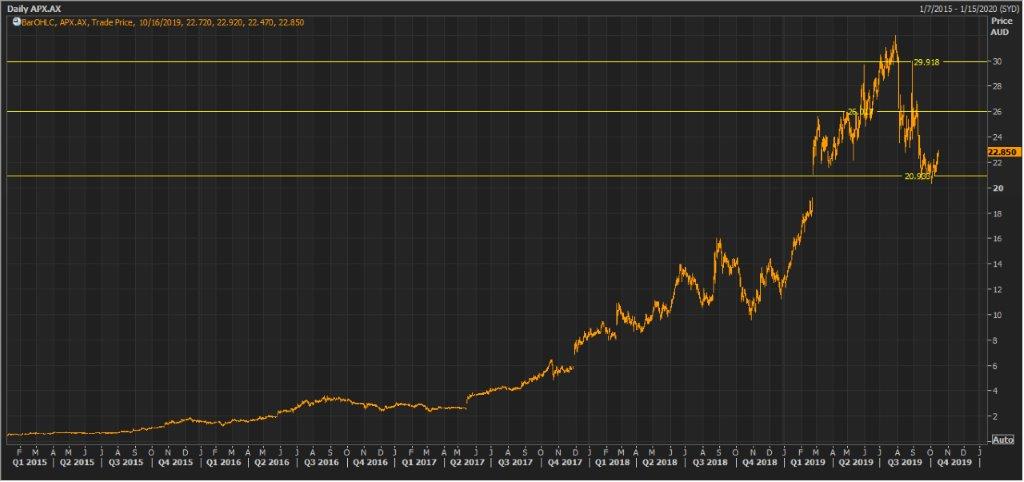
APX Daily Technical Chart (Source: Thomson Reuters)
Bravura Solutions Limited
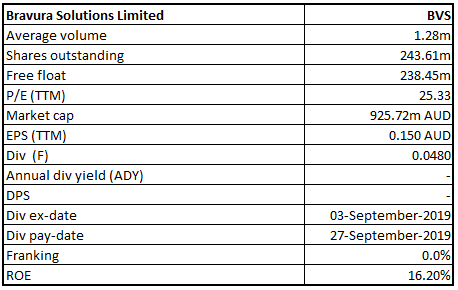
BVS Details
Robust Growth Across Bravura Product Suite:Bravura Solutions Limited (ASX: BVS) is engaged in the development, licensing and maintenance of highly specialised administration and management software applications; and the provision of professional consulting services for the Wealth Management and Funds Administration sectors.
The company recently announced the issue of 439,440 shares under its Dividend Reinvestment Plan at an issue price of $4.39 per share.
FY19 Results’ Highlights: Revenue for the year ended 30 June 2019 amounted to A$257.7 million, up 16% on pcp. EBITDA for the year amounted to A$49.1 million, up 27% on pcp. NPAT stood at A$32.8 million, representing an increase of 21% on prior corresponding period.
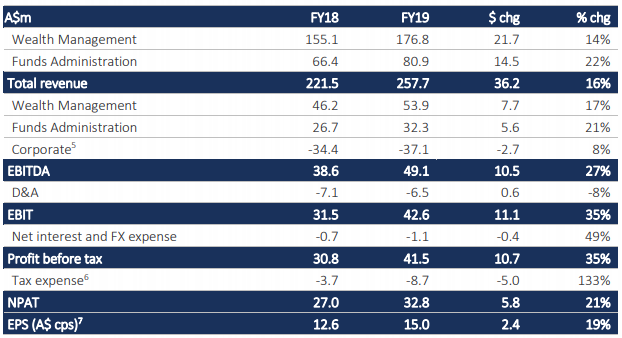
FY19 Financial Performance (Source: Company Reports)
Guidance: In FY20, the company expects net profit after tax to report a growth in the mid-teens, supported by strong recurring revenue and new sales opportunities.
Stock Recommendation: The stock generated negative returns of 11.83% and 17.03% over a period of 1 month and 3 months, respectively. Going forward, the company is eyeing a continued investment in Sonata, its flagship product, that delivered a strong revenue growth in FY19. The company’s EBITDA margin for the year stood at 30.5% as compared to 29.8% in FY18. In addition, it has a strong sales pipeline across its key markets, driven by sales opportunities from new clients and significant project activity from existing clients. Visibility of the sales pipeline spans across a period of 12-18 months. Based on the above growth prospects and current trading levels, we give a “Buy” recommendation on the stock at the current market price of $3.780, down 0.526% on 16 October 2019.
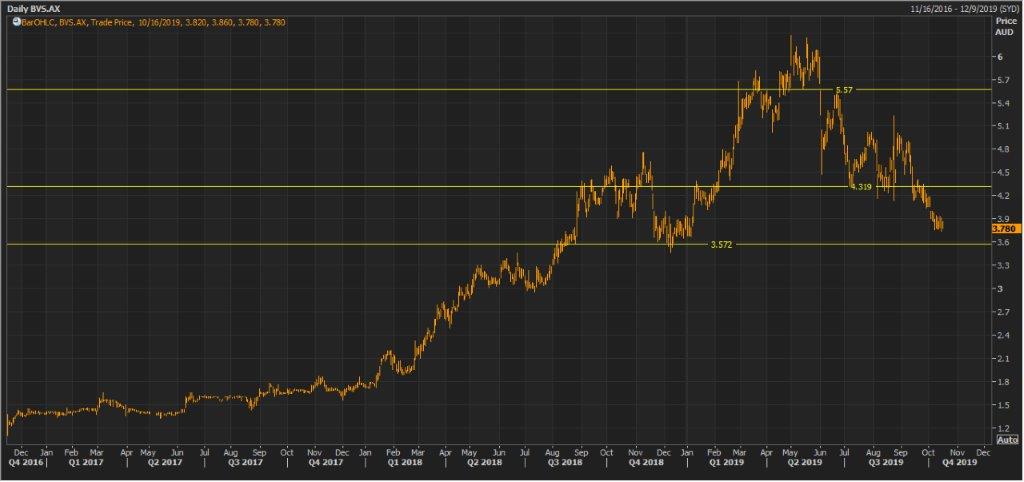
BVS Daily Technical Chart (Source: Thomson Reuters)
Nearmap Limited
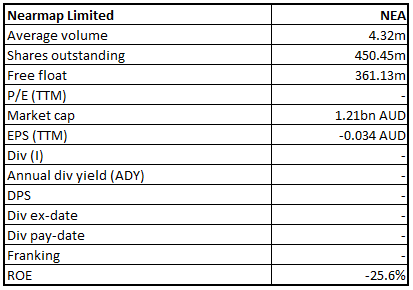
NEA Details
Unique Business Model to Aid Future Growth:Nearmap Ltd (ASX: NEA) is engaged in online aerial photo mapping via its patented camera systems and processing software. The company recently released the notice of the annual general meeting and explanatory memorandum to shareholders, wherein it reported that the AGM for 2019 will be held on 14 November 2019.
FY19 Performance Highlights for the period ending 30 June 2019: NEA declared its full-year financial results, wherein the Company reported a group revenue of $77.642 million, up 45% on y-o-y basis and loss after tax amounted to $14.93 million as compared to $11.03 million during the previous financial year.The Company reported a group EBITDA of $15.48 million and operating cash flow of $24.9 million during FY19.
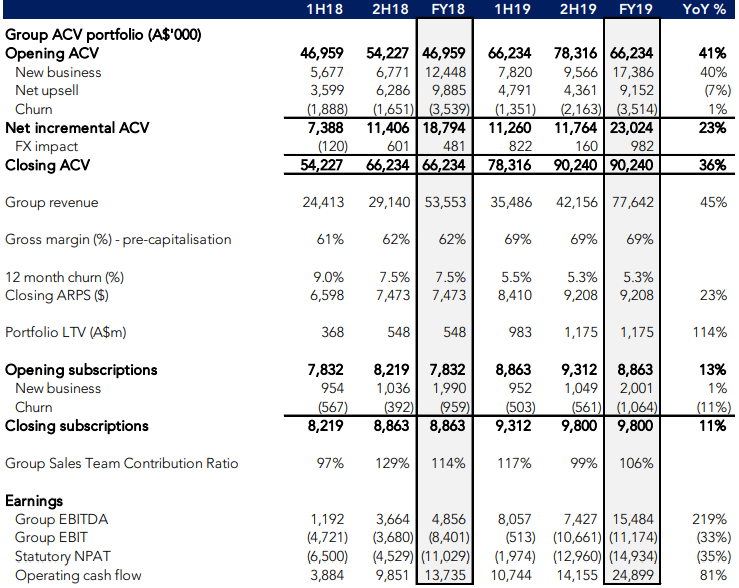
FY19 Financial Highlights (Source: Company Reports)
Stock Recommendation:The stock of NEA is trading at $2.870 with a market capitalization of $1.21 billion. The 52-week trading range of the stock stood at $1.22 and $4.29 and currently, the stock is quoting above the average of its 52-week high and low. The stock has generated 4.69% and -18.79% returns during the last one month and three months, respectively. In FY19, the company reported a growth of 36% in the group annualised contract value (ACV) portfolio. The year proved to be a milestone for the company with record portfolio growth on the back of a change in product offering with Nearmap 3D and the beta release of Artificial Intelligence content. Moreover, the above changes have laid a foundation for further growth in FY20. Considering the aforesaid facts, recent movement in stock price and business prospects, we recommend a ‘Buy’ rating on the stock at the current market price of $2.870, up 7.09% as on 16 October 2019, on account of the released notice related to the Annual General Meeting, which is to be held on 14 November 2019.
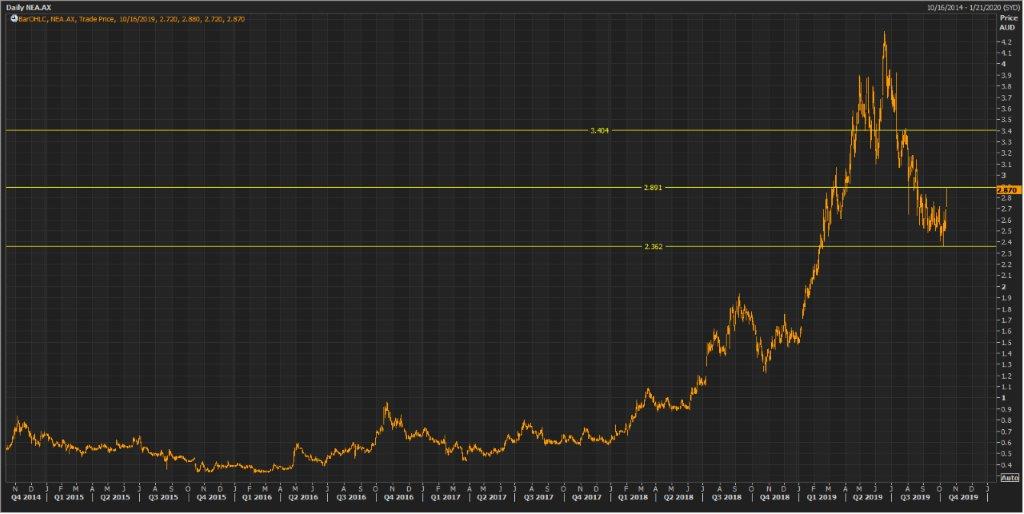
NEA Daily Technical Chart (Source: Thomson Reuters)
Eclipx Group Limited
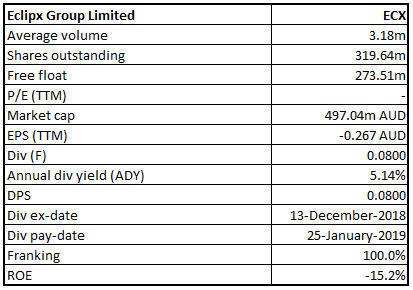
ECX Details
Eyeing Divestment of Non-Core Businesses:Eclipx Group Limited (ASX: ECX) is a leading provider of fleet, equipment leasing and management, vehicle rentals and online auction services to corporates, SMEs and consumers in Australia and New Zealand. As per a recent announcement, Wilson Asset Management Group, ceased to be a substantial shareholder of the company.
H1FY19 Financial Highlights for the period ending 31 March 2019:ECX announced its half-yearly results for financial year 2019, wherein the Company reported net operating income of $132.0 million, down 15% on pcp basis and EBITDA of $31.3 million, down 46% on pcp.The company posted Net Profit After Tax & Amortisation (NPATA) at $13.8 million, which went down by 62% on pcp. Core Fleet and Novated business reported stable EBITDA of $40.7 million, down 3% on pcp. Total assets under management or financed (AUMOF) came in at $2.1 billion, up 7% on pcp while, total vehicles under management or financed (VUMOF) came in at $103,414, representing an increase of 6% on pcp.
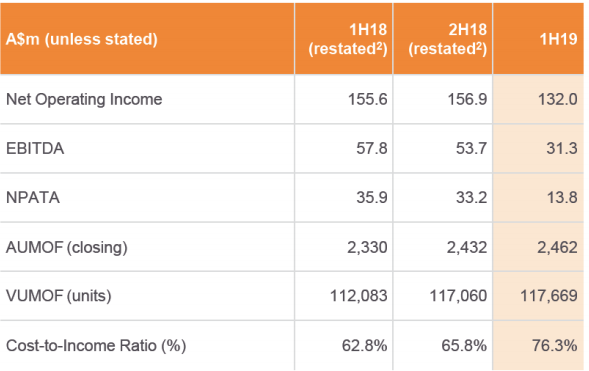
H1FY19 Financial Highlights (Source: Company Reports)
Stock Recommendation:The stock of ECX is quoting at $1.565 with a market capitalization of $497.04 million. The 52-week trading range of the stock stands at $0.540 to $2.780. Currently, the stock is trading slightly below the average price of its 52-week high and low. Over a period of 1 month, the stock generated a negative return of 9.86%. The core businesses of the company have a unique set of capabilities as compared to competitors, particularly in the datasets and treasury segment. The company is also focusing on divestment of the non-core businesses, which are underperforming and expects to deliver significant value to shareholders through the core businesses in the coming times. Considering the aforesaid factors and current trading levels, we recommend a ‘Speculative Buy’ rating on the stock at the current market price of $1.565, up 0.643% as on 16 October 2019.
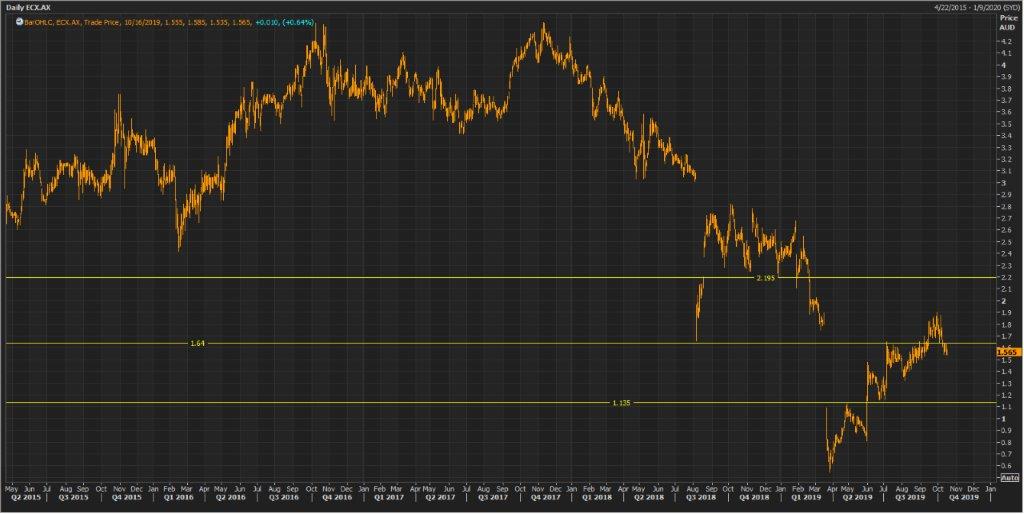
ECX Daily Technical Chart (Source: Thomson Reuters)
Empired Limited
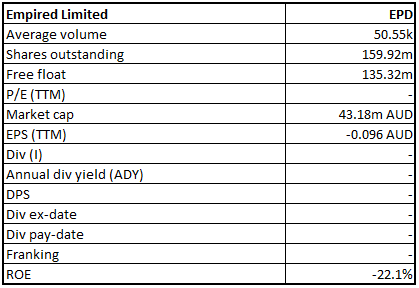
EPD Details
Improved Business from New Zealand:Empired Limited (ASX: EPD) is an IT Services provider with a wide range of capabilities that focuses on delivering enterprise IT solutions to improve efficiency, productivity, and competitive advantage for the clients. Recently, the company appointed Craig Lennard as the Executive General Manager of Eastern Region.
FY19 Operating Highlights for the period ending 30 June 2019:EPD declared its full-year financial results for FY19, wherein the company reported revenue of $176 million, up 1% on YoY basis and loss after tax of $15.3 million as compared to a profit of $4.9 million in FY18. Losses during the period was attributable to a non-cash impairment charge, amounting to $25.4m. In FY19, 63% of the total revenue was derived from multi-year contracts. During the year,the company secured major contracts with the Department of Internal Affairs NZ, New Zealand Police & Fire, and Emergency NZ. The company improved performance for New Zealand segment with 3% y-o-y growth in revenue at $61 million.
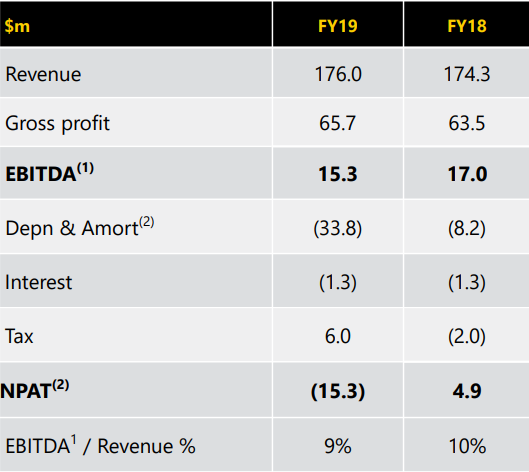
FY19 Financial Highlights (Source: Company Reports)
Guidance:The Management highlighted that the Company will be looking at tight management of overheads and will lower its capex to approximately $6 million in FY20. The Company will further look for share buy-back and implementing new plans to accelerate Australian East Coast Expansion.
Stock Recommendation:The stock of EPD is trading at $0.280 with a market capitalization of $43.18 million. The stock is currently trading towards the lower band of its 52-week trading range of $0.235 to $0.520. The stock has generated negative returns of 22.86% and 32.50% during the last three-months and six-months, respectively. In the coming years, the company is expected to deliver a material increase in NPAT, aided by the improved performance from New Zealand and positive contract news. Considering the future growth prospects and current trading levels, we recommend a ‘Speculative Buy’ rating on the stock at the current market price of $0.280, up 3.704% as on 16 October 2019.
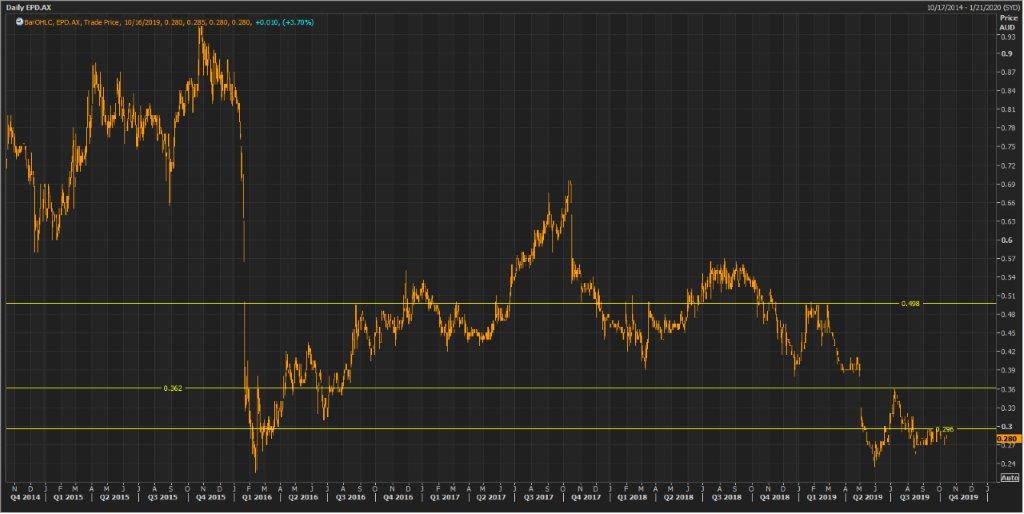
EPD Daily Technical Chart (Source: Thomson Reuters)
Disclaimer
The advice given by Kalkine Pty Ltd and provided on this website is general information only and it does not take into account your investment objectives, financial situation or needs. You should therefore consider whether the advice is appropriate to your investment objectives, financial situation and needs before acting upon it. You should seek advice from a financial adviser, stockbroker or other professional (including taxation and legal advice) as necessary before acting on any advice. Not all investments are appropriate for all people. Kalkine.com.au and associated pages are published by Kalkine Pty Ltd ABN 34 154 808 312 (Australian Financial Services License Number 425376). The information on this website has been prepared from a wide variety of sources, which Kalkine Pty Ltd, to the best of its knowledge and belief, considers accurate. You should make your own enquiries about any investments and we strongly suggest you seek advice before acting upon any recommendation. Kalkine Pty Ltd has made every effort to ensure the reliability of information contained in its newsletters and websites. All information represents our views at the date of publication and may change without notice. To the extent permitted by law, Kalkine Pty Ltd excludes all liability for any loss or damage arising from the use of this website and any information published (including any indirect or consequential loss, any data loss or data corruption). If the law prohibits this exclusion, Kalkine Pty Ltd hereby limits its liability, to the extent permitted by law to the resupply of services. There may be a product disclosure statement or other offer document for the securities and financial products we write about in Kalkine Reports. You should obtain a copy of the product disclosure statement or offer document before making any decision about whether to acquire the security or product. The link to our Terms & Conditions has been provided please go through them and also have a read of the Financial Services Guide. On the date of publishing this report (mentioned on the website), employees and/or associates of Kalkine Pty Ltd do not hold positions in any of the stocks covered on the website. These stocks can change any time and readers of the reports should not consider these stocks as advice or recommendations.
 AU
AU

 Please wait processing your request...