Orocobre Limited
.png)
ORE Details
Trading at Lower level and expected to go upward:Orocobre Limited (ASX: ORE) reported the sales revenues of US$148.9 million in FY 2018 which implies the YoY growth of 24% on the back of a rise in the average prices as well as production even though the company’s sales volume witnessed the negative impacts because of the shipment timings.
The company witnessed a substantial rise in its cash and cash equivalents by US$275.4 million to US$329.7 million thanks to the rights issue as well as capital placement. The company also witnessed a strong momentum in regard to its cash inflows garnered with the help of Olaroz in FY 2018 on the back of an increase in the prices. During the same period, the company incurred US$6.5 million towards development expenditures in the regard to the deployment made in Cauchari Hydroxide plant as well as exploration properties. However, the company also received US$3.3 million as the company sold exploration assets.
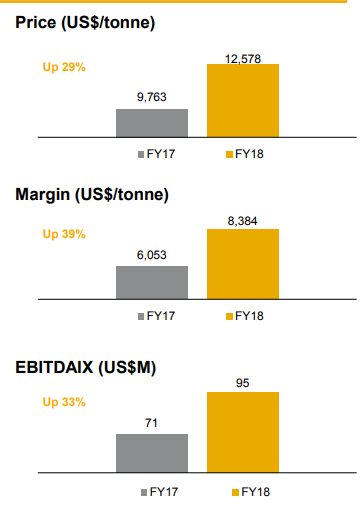
Improvement in Key Metrics (Sources: Company Reports)
Orocobre Limited ended the day at $4.250 and the stock has witnessed an upward momentum. It advanced 0.95% on September 27, 2018. On the daily chart of ORE, the Moving Average Convergence Divergence (MACD) indicator has been applied by using the default values. As a result, the MACD line has crossed the signal line and MACD line is moving upwards reflecting the bullish sentiments. Hence, we expect the stock price to move upwards and thus, we maintain our “buy” rating on the stock at the current market price of $4.250.
.png)
ORE Daily Chart (Source: Thomson Reuters)
QBE Insurance Group Limited
QBE Details
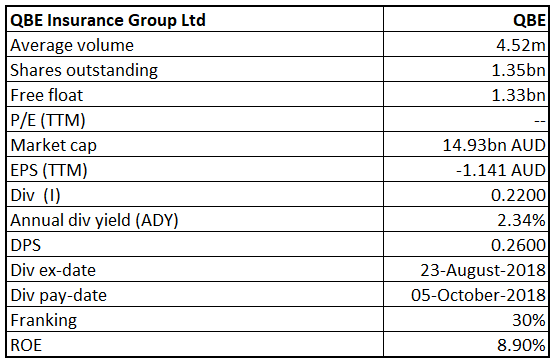
Positive Outlook underpinned by macroeconomic factors:QBE Insurance Group Limited (ASX: QBE) is a large-cap company with the market capitalization of circa $14.93 Bn as of September 27, 2018. Recently, the group has updated the market about the progress on several transactions under its ongoing buy-back event. The group indicated to buy back shares with an aggregate total value consideration of up to A$153 Mn. As of now, the group has bought back a total of 1,77,23,799 shares via on-market trade. From the analysis standpoint, the company reported positive sign in 1H18, after having shown significant pressure in margins for many years and reported adjusted insurance profit margin of 8.2% in 1HFY18. It was majorly lifted by the sharp rise in premium rates, leverage to rising interest rates, portfolio re-shaping and cost out. The combined ratio and investment ratio recorded at 87.5% and 4.6%, respectively in 1HFY18 which is higher than the prior corresponding period. Its RoE stood at 8.9% in 1HFY18 which is higher than the peer group (6.1%), representing the group’s efficiency to generate higher profit with the shareholders invested capital. Further, the management anticipates achieving the combined operating ratio (COR) in the range of 95.0 percent - 97.5 percent in FY18 and investment return in the range of 2.5 percent to 3.0 percent with the support of various initiative undertaken by the company. Going forward, the company will continue to drive value and margin at the back of the favorable insurance market, rise in interest rate, cost optimization strategy, and unwinding of conservativeness from reserves.
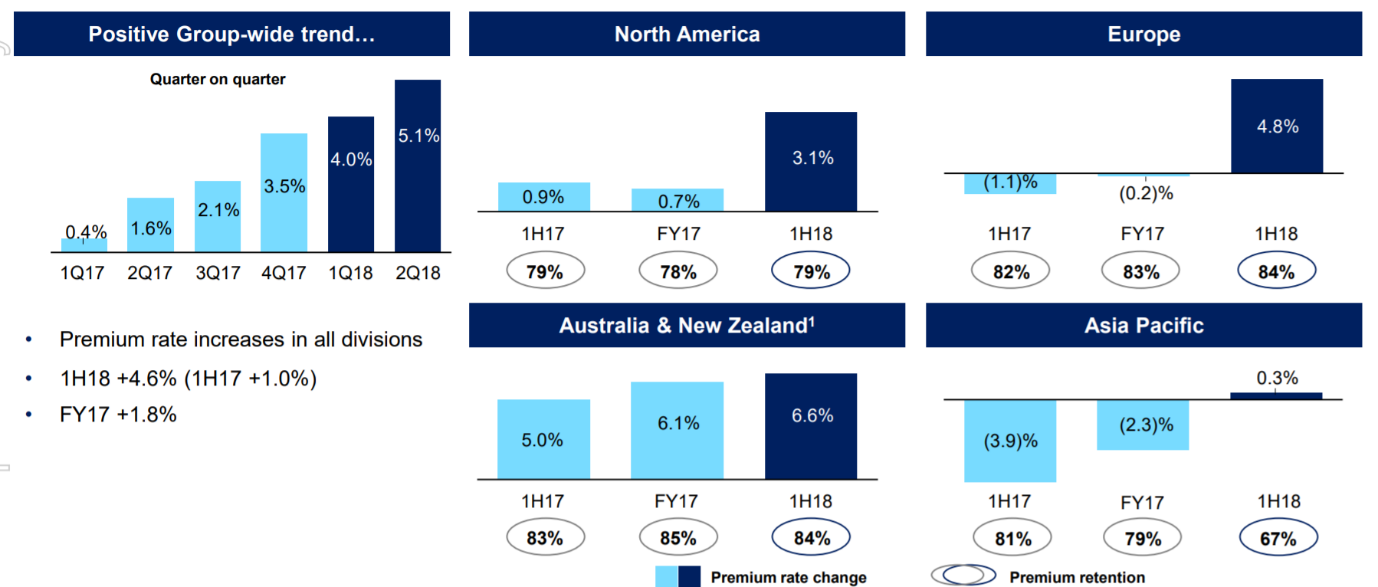
Pricing momentum (Source: Company Reports)
Meanwhile, the stock price was up by 15.38 percent in the past three months at September 26, 2018 and traded at the higher level. By looking at the rise in price momentum in the insurance sector, we maintain our “Buy” recommendation on the stock at the current market price of $10.960.
.png)
QBE Daily Chart (Source: Thomson Reuters)
The Citadel Group Limited
CGL Details
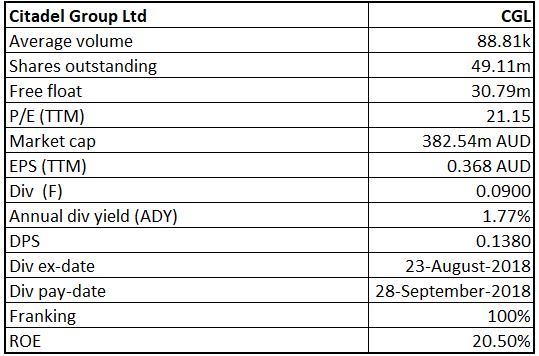
Well Poised to capture growth in the upcoming period: The Citadel Group Limited (ASX: CGL) is a software and services company, which provides software and managed services in Australia. During FY18, the company has inked multiple long-term contracts with government agencies for the new cloud Software-as-a-Service platform, Citadel Information Exchange (Citadel-IX), ensuring robust growth ahead. Besides this, strategic acquisition of Charm Health International and Anaesthetic Private Practice will support to expand the capacity of CGL in e-health information management space. From analysis front, the Net margin came in at 18.1% in FY18 which is above the industry median of 11.9%. As a result, RoE and RoCE stood at 20.5% and 20.8%, respectively in FY18, representing sustainable growth and solid return for shareholders. Operating margin, on the other hand, has increased by 23.9% compared to the industry median of 20.6%. At 30 June 2018, the Group had a cash reserve of $24.9 Mn. On the working capital front, Average receivable days for FY18 came in at 99.7 days which is lower than the industry median of 150 days. Resultantly, the cash conversion cycle (CCC) stood at 64 days during the same period. In another release on ASX, the company informed the market that its two founders have agreed to sell c.10% of their shareholdings via institutional placements for the purpose of increasing share liquidity and future ASX 300 index inclusion. Following this small ownership outgo, Dr. Jakeman and Mr. McConnell will still retain c.15% & c.12% interest, respectively of total CGL shareholdings.
Increasing Shareholder Returns (Source: Company Reports)
Meanwhile, the share price has risen 17.14% in the past three months (as at September 26, 2018) and traded at a low PE level of 21.15x. As there are many opportunities to continue growing the CGL businesses in both public and private markets, particularly with its unique technology and health offerings, thus, we maintain our “Buy” recommendation on the stock at the current market price of $ 7.790.
.png)
CGL Daily Chart (Source: Thomson Reuters)
Collins Foods Limited
CKF Details
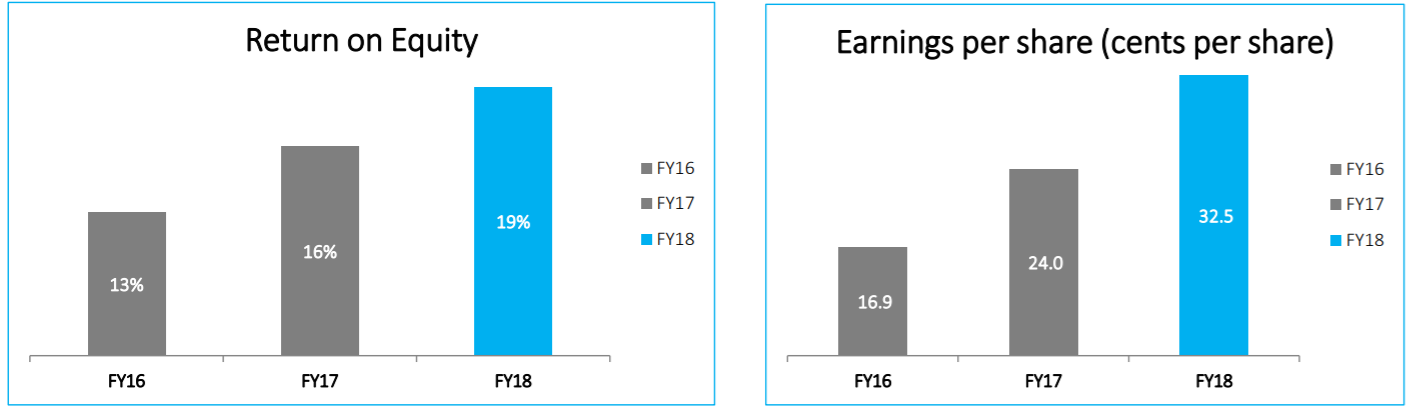
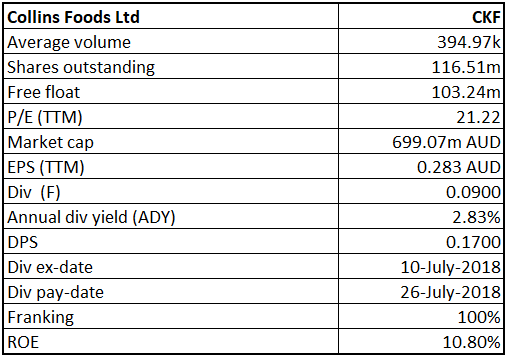
Charts out Healthy Growth Trajectory: Collins Foods Limited (ASX: CKF) continues to build a platform for long-term shareholder growth, underpinned by the expansion of its footprint in the domestic and European market, and a focus on driving operational excellence across its network of restaurants. The company has a sound track record of delivering robust financial performance and growth. The Company has achieved a four-year compound annual growth (CAGR) in Sales and EBITDA of 10.5% and 11.9% respectively to FY18 while PAT recorded CAGR growth of 16.5 percent over the same period. Moreover, for FY18, the company delivered 13.4% rise in the underlying net profit after tax (NPAT) to $38.9 Mn, and 16.2% rise in the underlying earnings before interest, tax, depreciation, and amortization (EBITDA) to $94.5 Mn against the prior year. This was mainly supported by vigilant cost control and a focus on continued operational efficiency improvements. We believe that the company has a bright outlook at the back of organic and inorganic growth across the restaurant network, and product innovation such as Taco Bell brand.
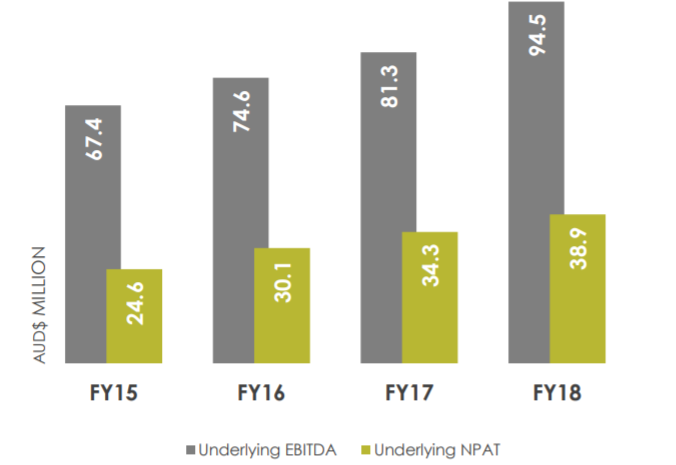
EBITDA and PAT Trend (Source: Company Reports)
On the valuation front, the company has a price-to-earnings ratio of 21.22x as of September 27, 2018. It has posted Return of Equity (RoE) of 10.8%, Return on Capital Employed (RoCE) of 6.0% and has a debt-to-equity ratio of 0.86x in FY18. Besides this, the current ratio stood at 0.85x in FY18 which is below the Industry Median (1.16x). As of now, the group focuses on product innovation and is offering great value to customers so that the group will execute sustainable growth over the long-term for its shareholders. Thus, we maintain our “Buy” recommendation on the stock at the current market price of $6.060 given the long-term potential.
.png)
CKF Daily Chart (Source: Thomson Reuters)
Bubs Australia Limited
BUB Details
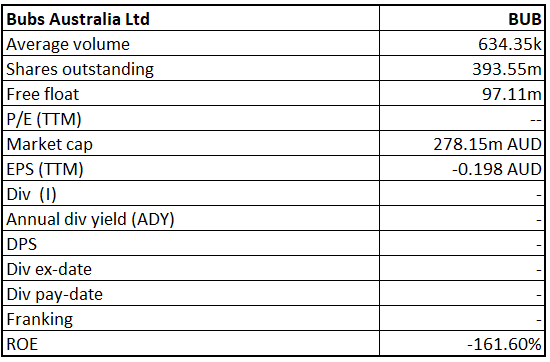
Solid Performance in FY18 Supported by Domestic and China market: Bubs Australia Limited (ASX: BUB) saw the robust in FY 2018 as the company’s gross sales stood at $18.4 million. The company’s results were aided by the sales growth in regard to the primary product offerings in the markets situated in China as well as in Australia. Moving forward, the company would continue to deploy the resources towards the channel capacity which includes the partnerships which are working on online and offline platforms. This could also help the company to expand in China.
Key Drivers to Help Moving Forward: Apart from the Bubs’ strategy of expansion, the company would also deploy the resources towards the vertically integrated production as well as supply chain areas. After the company acquired NuLac Foods, the company had now access (exclusive) for the 13 million litres of goat milk in respect to the New Zealand as well as Australian farms.
After applying MACD (moving average convergence divergence) on the daily chart of Bubs, it is expected that the stock price might witness an upward momentum. This is because the MACD line is about to cross the signal line and is expected to move upward, which means the bullish momentum is in making. Hence, we maintain our “Speculative Buy” rating on Bubs at the price of $0.630.
.png)
BUB Daily Chart (Source: Thomson Reuters)
Redbubble Limited
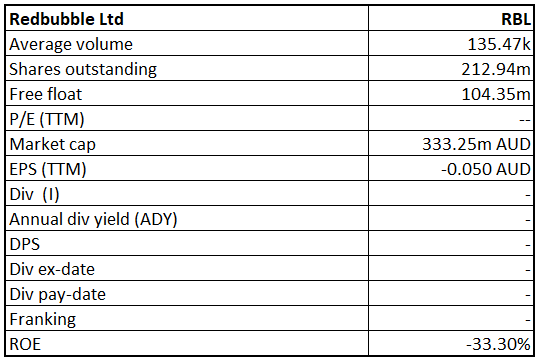
RBL Details
Robust Momentum Aided by Market Dynamics: In FY 2018, Redbubble Limited (ASX: RBL) recorded strong growth of 31.9% in GTV or gross transaction value to $231.3 million on the YoY basis thanks to the dynamics of the broader markets. The company also witnessed marginal growth in regard to the repeat GTV as well as in repeat customers. The company also witnessed the positive impacts from the digital technology. Its mobile GTV growth stood at 57.1% in FY 2018 on the YoY basis thanks to the performance of the iOS App

Financial Highlights (Source: Company Reports)
What are the drivers for growth:An increase with respect to the sharing economy is the first reason which could affect the market. The work of the artists can be shared with the customer base globally. Secondly, a rise in the demand for self-expression as well as personalization could also affect. Finally, improvement in the capability in regard to the manufacturing as well as printing also affects the retail commerce.
On technical analysis front, the MACD indicator was applied on the daily chart of Redbubble Limited. As a result, the MACD line is about to cross the signal line and is expected to move upwards reflecting the upward momentum. The stock currently has a market price of A$1.605 and is trading in the higher range. Therefore, we maintain our “Speculative buy” rating on the stock.
.png)
RBL Daily Chart (Source: Thomson Reuters)
Disclaimer
The advice given by Kalkine Pty Ltd and provided on this website is general information only and it does not take into account your investment objectives, financial situation or needs. You should therefore consider whether the advice is appropriate to your investment objectives, financial situation and needs before acting upon it. You should seek advice from a financial adviser, stockbroker or other professional (including taxation and legal advice) as necessary before acting on any advice. Not all investments are appropriate for all people. Kalkine.com.au and associated pages are published by Kalkine Pty Ltd ABN 34 154 808 312 (Australian Financial Services License Number 425376). The information on this website has been prepared from a wide variety of sources, which Kalkine Pty Ltd, to the best of its knowledge and belief, considers accurate. You should make your own enquiries about any investments and we strongly suggest you seek advice before acting upon any recommendation. Kalkine Pty Ltd has made every effort to ensure the reliability of information contained in its newsletters and websites. All information represents our views at the date of publication and may change without notice. To the extent permitted by law, Kalkine Pty Ltd excludes all liability for any loss or damage arising from the use of this website and any information published (including any indirect or consequential loss, any data loss or data corruption). If the law prohibits this exclusion, Kalkine Pty Ltd hereby limits its liability, to the extent permitted by law to the resupply of services. There may be a product disclosure statement or other offer document for the securities and financial products we write about in Kalkine Reports. You should obtain a copy of the product disclosure statement or offer document before making any decision about whether to acquire the security or product. The link to our Terms & Conditions has been provided please go through them and also have a read of the Financial Services Guide. On the date of publishing this report (mentioned on the website), employees and/or associates of Kalkine Pty Ltd do not hold positions in any of the stocks covered on the website. These stocks can change any time and readers of the reports should not consider these stocks as advice or recommendations.
 AU
AU
 Please wait processing your request...