Transurban Group (ASX:TCL)
.png)
TCL Details
Completion of the Monash Freeway Upgrade - Transurban Group is engaged in the business of development, operation and maintenance of toll roads. Recently, Victorian Government announced the completion of the Monash Freeway Upgrade and opened new lanes on the Monash Freeway in May, two months ahead of schedule. This completion extended the managed motorway system along the M1 corridor to improve traffic flow and safety. The Group’s West Gate Tunnel Project is progressing well and has received planning approvals, in the form of a Planning Scheme Amendment, having passed through the Legislative Council in Victoria. The Group is planning to complete the project over the timeframes that were announced in December. TCL has a clear strategy to become the partner of choice with governments providing effective and innovative urban road infrastructure and services utilising core capabilities.
.png)
Current cost of Debt (Source: Company Reports)
Transurban has been awarded five toll road concessions or upgrades following unsolicited proposals to state governments, in exchange for increase or extension of existing tolls. The Net Margin increased from 8.7 per cent in June 2017 to 22 per cent in December 2017 and Current Ratio improved from 0.60 in June 2017 to 1.48 in December 2017 which is more than the industry median (0.75). The stock declined by 0.92 per cent as on 16 July 2018 (was up by 7.33 per cent in last three months as on 13 July 2018). The Group is trading at a decent annual yield of 4.67 per cent. The Group is expecting to release its financial updates on 7 August 2018. We give a “Buy” recommendation at the current market price of $11.89 (that is near to its average of 52-week high and low range) by looking at its recent developments that can add value to its performance.

TCL Daily Chart (Source: Thomson Reuters)
Netwealth Group Limited (ASX:NWL)
.png)
NWL Details
Decrease in Net Margin - Netwealth Group Limited is an Australia-based company that offers superannuation and non-superannuation platform product and offers portfolio administration, investment management tools, investment and managed account solutions, primarily to financial intermediaries and clients. The Group lifted its profit guidance and expects 6 per cent above its FY18 Pro-forma NPAT prospectus forecast. Funds Under Administration (FUA) at 30 June were reported at $17.96 billion with an increase of $1.95 billion for the fourth quarter and $5.2 billion for 12 months ended 30 June 2018 (41 per cent increase). The Group was rated Australia’s No. 1 platform for overall satisfaction for the 7th year in a row in the Investment Trends Planner technology report released in May 2018.
.png)
Growth in FUA, FUM & Member Accounts (Source: Company Reports)
It entered into a transition agreement with the responsibility entity of a managed investment scheme and as at 30 June, it resulted in $14.2 million of FUA which was added with the inflows which were expected to total approx. $50 million. There was a decrease in the administration fees paying (percentage of net flows for the quarter) and it was due to an increased proportion of net flows that were coming from higher value wrap accounts where balances exceeded the fee cap. The Net Margin decreased from 23.5 per cent in June 2017 to 14.1 per cent in December 2017. The stock price moved up by 1.42 per cent as on 16 July 2018. The stock price has been rising up since it got listed on ASX (up by 53.19 per cent as on 13 July 2018 in last three months). The stock looks “Expensive” at the current market price of $9.26 (very near to its 52-week high price, $9.99).

NWL Daily Chart (Source: Thomson Reuters)
CSL Limited (ASX:CSL)
.png)
CSL Details
Trading at a high PE level - CSL Limited develops, manufactures and markets human and veterinary pharmaceutical and diagnostic products derived from human plasma. The company reported a revenue growth of 11 per cent to $4,147 million in 1HFY18 as compared to the prior corresponding period (pcp). NPAT registered growth of 31 per cent YoY on a constant currency basis. As a result, EPS stood at 2.33 cents per share during the first half of the year on the constant currency basis. ROE and ROIC substantially increased by 1350 bps and 610 bps to 31.0 per cent and 13.5 per cent, respectively in 1HFY18 from the previous six months. The Group will release its financials around 15 August 2018 and market has high expectations as Group has performed really well in the first half.
.png)
Trend of EBITDA Margin (Source: Company Reports)
Experts feel that Company’s EBITDA will grow by an average of 14 per cent per annum from FY 2017 through to FY 2021. The Company recently completed its buy-back and paid A$150.3 million for the acquisition of shares. The Group is already trading at higher PE that is at 45.95x. The stock price fell by 2.89 per cent as on 16 July 2018 while it is still close to its 52-week high price that is $204.67 (up by 212.02 per cent in 5 years as on 13 July 2018). The stock can be avoided as of now at the current market price of $198.64 and one can wait for its financials to be released and a suitable buying opportunity.
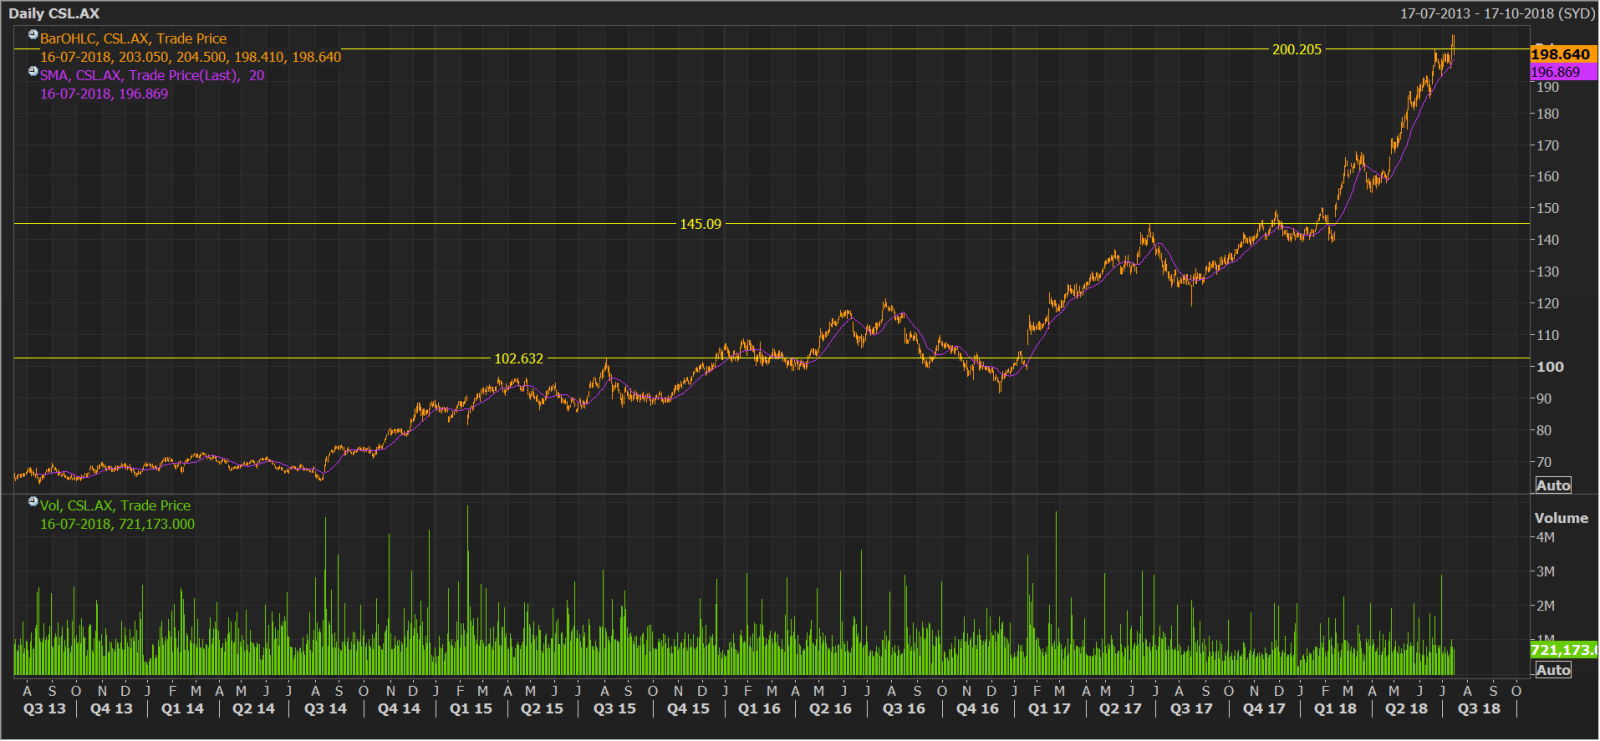
CSL Daily Chart (Source: Thomson Reuters)
Lendlease Group (ASX:LLC)
.png)
LLC Details
Risk of tighter lending standards - Lendlease Group has its focus on large scale mixed-use developments in the inner city of target gateway cities and has strong completion expectations in FY19 and it is expected that the production phase will start from FY20-22. The Company has a track record of 60 years development and since past 15 years it is developing major urbanisation projects and has been delivering long-term, transformational projects in key city locations. Its focus remains on securing large-scale projects (more than $1 billion) in end value that are delivered over multiple property cycles. It is expected that the Group will release its financial updates around 22 August 2018.
.png)
Development Pipeline Trend (Source: Company Reports)
Net operating and investing cash flow stood at $825.2 million for the first half of the year which is almost double that of PAT. The group is laying the foundation for future growth on the back of healthy financials, strong orderbook, and focus on execution through strong risk management and governance framework in years to come. Though its PE ratio is low and below the REIT sector’s level, the construction earnings have been seen to impact the group’s profit leading to a valuation differential at a higher end. The Group has a high exposure to housing market volatility and there has been speculation in the market that tighter lending standards might have a major impact on the business. The stock price is inching towards its 52-week high price that is $20.48; and is trading at $19.85, and looks to be “Expensive”.
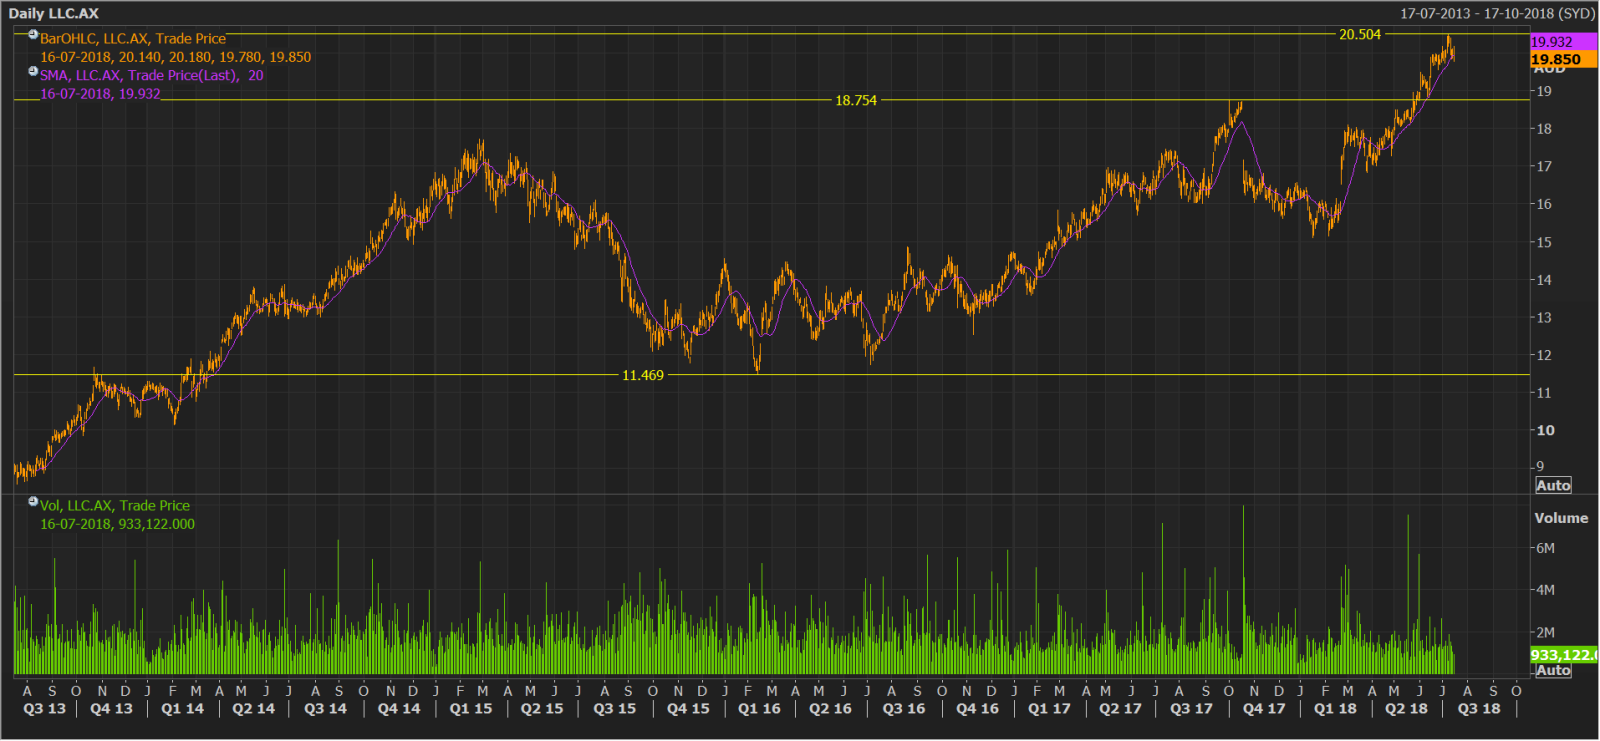
LLC Daily Chart (Source: Thomson Reuters)
BHP Billiton Limited (ASX:BHP)
.png)
BHP Details
Planning to sell its on-shore shale oil and gas assets in the US - BHP Billiton is the world’s largest diversified resources company. The Company has provided an operational review for the nine months ended 31 March 2018 wherein the group revealed its full-year production guidance and kept the same unchanged for Petroleum, Metallurgical Coal and Energy Coal. According to the release, the full year petroleum volumes are expected to touch the upper end of the guidance range (i.e., 180-190 MMboe). ROE and ROIC substantially increased from 4.7 per cent and 2.7 per cent to 6.7 per cent and 4.5 per cent, respectively in 1HFY18 over the six months’ period. The group seems to be sealing a deal of over US$10 billion to sell its on-shore shale oil and gas assets in the US. In fact, BP was tipped to buy the assets.
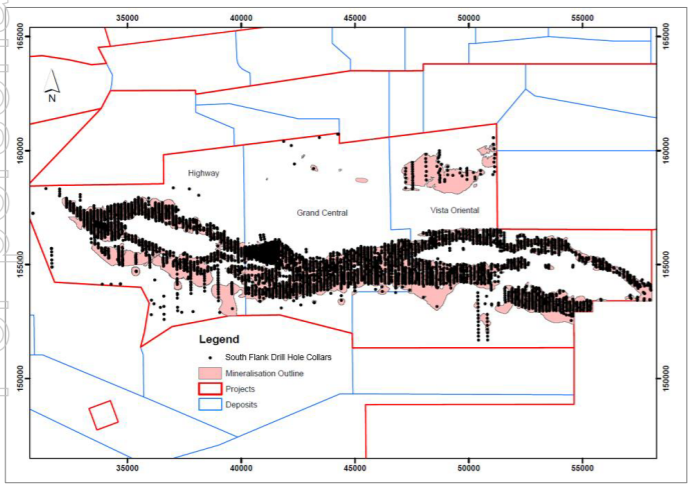
Drill Hole Collar Distribution over the South Flank Project (Source: Company Reports)
The Global-trade war with China may have an impact on the stock price as it will dampen the demand for the iron ore because of which there will be excess of supply of the commodity which will provide little incentive for steel makers to purchase the more polluting ore. Meanwhile, BHP agreed to support the Renova Foundation and Samarco Mineração S.A financially and provided US$211 million until 31 December 2018. The Company recently approved to spend US$ 2.9 Bn on the South Flank Iron Mine Project in the central Pilbara, Western Australia to replace its existing mines. The iron ore price fell by almost 9.1 per cent in the last six months but was up by 15.7 per cent (approx.) this year. The Group is planning to release its financial updates on 21 August 2018. The stock price fell by 1.57 per cent in last the five days as on 13 July 2018. We give a “Hold” recommendation at the current market price of $33.07 by looking at the commodity price scenario and trading levels.
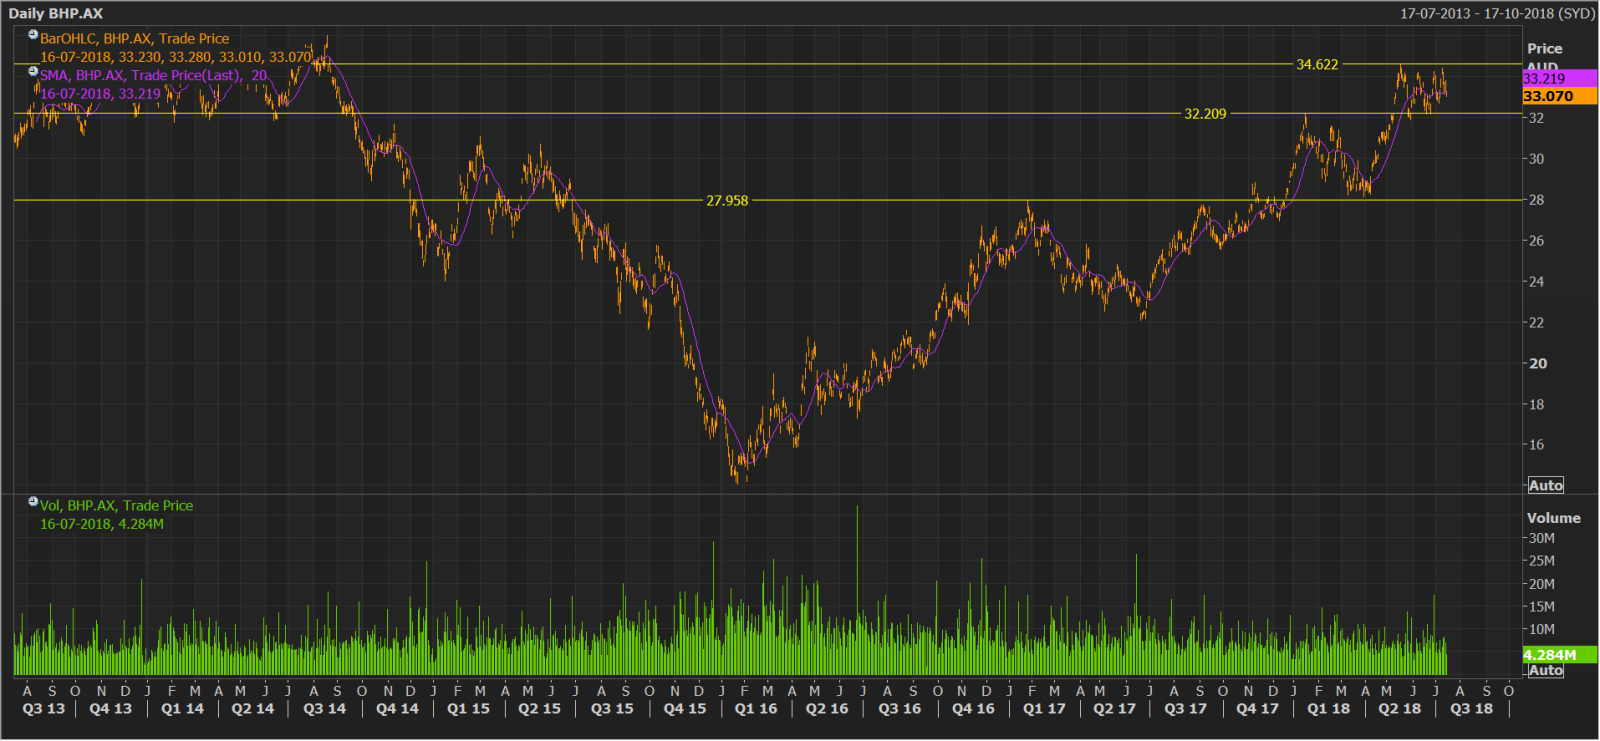
BHP Daily Chart (Source: Thomson Reuters)
G8 Education Limited (ASX: GEM)
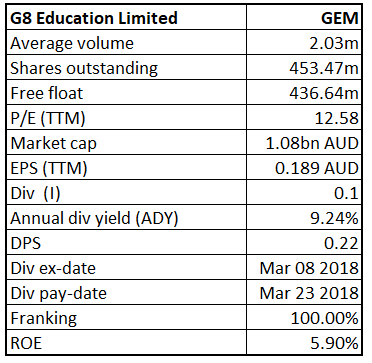
GEM Details
Speculation of Takeover - G8 Education is a childcare centre operator providing developmental and educational child care services mainly in Australia. The Group acquired a total of 37 early education centres and disposed of 22 centres in Australia. The market environment has been challenging for a number of months now, as the impact of recent supply increase could be felt, while the Government funding package is expected to drive demand in the sector from July 2018. The Group lately removed the trade volume restrictions applicable to shares held by CIP and these were not applicable anymore from close of trade on 4 June 2018. Its 32 per cent of centres were assessed and exceeded the National Quality Standards and its average portfolio quality continues to improve.

Company’s Current Footprint (Source: Company Reports)
The group has a strategy based on acquisition to grow and it uses a mix of debt and capital raisings to fund acquisitions. Further, there is a speculation in the market that the Group can be a target for takeover by players in the Australian private equity industry. The share price climbed up by 5.46 per cent as on 16 July 2018, which otherwise was falling since 5 years (down by 39.75 per cent in one year as on 13 July 2018). We would recommend to “Hold” the stock at the current market price of $2.51 (near its 52-week low price that is $2.15).
.png)
GEM Daily Chart (Source: Thomson Reuters)
Disclaimer
The advice given by Kalkine Pty Ltd and provided on this website is general information only and it does not take into account your investment objectives, financial situation or needs. You should therefore consider whether the advice is appropriate to your investment objectives, financial situation and needs before acting upon it. You should seek advice from a financial adviser, stockbroker or other professional (including taxation and legal advice) as necessary before acting on any advice. Not all investments are appropriate for all people. Kalkine.com.au and associated pages are published by Kalkine Pty Ltd ABN 34 154 808 312 (Australian Financial Services License Number 425376). The information on this website has been prepared from a wide variety of sources, which Kalkine Pty Ltd, to the best of its knowledge and belief, considers accurate. You should make your own enquiries about any investments and we strongly suggest you seek advice before acting upon any recommendation. Kalkine Pty Ltd has made every effort to ensure the reliability of information contained in its newsletters and websites. All information represents our views at the date of publication and may change without notice. To the extent permitted by law, Kalkine Pty Ltd excludes all liability for any loss or damage arising from the use of this website and any information published (including any indirect or consequential loss, any data loss or data corruption). If the law prohibits this exclusion, Kalkine Pty Ltd hereby limits its liability, to the extent permitted by law to the resupply of services. There may be a product disclosure statement or other offer document for the securities and financial products we write about in Kalkine Reports. You should obtain a copy of the product disclosure statement or offer document before making any decision about whether to acquire the security or product. The link to our Terms & Conditions has been provided please go through them and also have a read of the Financial Services Guide. On the date of publishing this report (mentioned on the website), employees and/or associates of Kalkine Pty Ltd do not hold positions in any of the stocks covered on the website. These stocks can change any time and readers of the reports should not consider these stocks as advice or recommendations.
 AU
AU

 Please wait processing your request...