.png)
Stocks’ Details
Perenti Global Limited
Contract Awarded to Subsidiary: Perenti Global Limited (ASX: PRN) is engaged in the business of surface mining, underground mining and mining support services. The market capitalisation of the company stood at $1.05 Bn as on 30th January 2020. Recently, the company announced that Panoramic Resources has selected Barminco (a subsidiary of PRN) as a preferred contractor at the Savannah Project in the Kimberley, which is having the value of around $200 million. Per the deal, Barminco would provide services, which include development, production, as well as haulage over the span of three-year. The work for the contract is anticipated to begin in March 2020. As per the key personnel of the company, this contract reflects its ability to capture organic growth opportunities.
On the financial front, during FY19, the company witnessed a rise of 14.2% in Proforma revenue, which amounted to $1.970 billion. New work and scope increase at existing projects supported top-line growth.
.png)
Financial Results (Source: Company Reports)
What to Expect: The company remains on track to achieve its growth prospects in FY20 on the back of a robust balance sheet as well as order book, which witnessed a rise to $7.0 billion post securing $3.4 billion in new and extended contracts since 1 July 2018.
Valuation Methodology: P/E Multiple Approach
.png)
P/E Based Valuation (Source: Thomson Reuters)
Note: All forecasted figures have been taken from Thomson Reuters, NTM: Next Twelve Months
Stock Recommendation: The company is optimistic about the anticipation for continued growth in its underground mining operations considering the available opportunities. We have valued the stock using P/E based relative valuation method, and for the purpose, we have taken peers such as NRW Holdings Ltd (ASX: NWH), Imdex Ltd (ASX: IMD), MACA Ltd (ASX: MLD), etc., and arrived at a target price, which is offering an upside of lower double-digit (in percentage terms). Therefore, considering recent contract awarded to its subsidiary and strong balance sheet, we give a “Buy” recommendation on the stock at the current market price of $1.495 per share, down 2.288% on 30th January 2020.
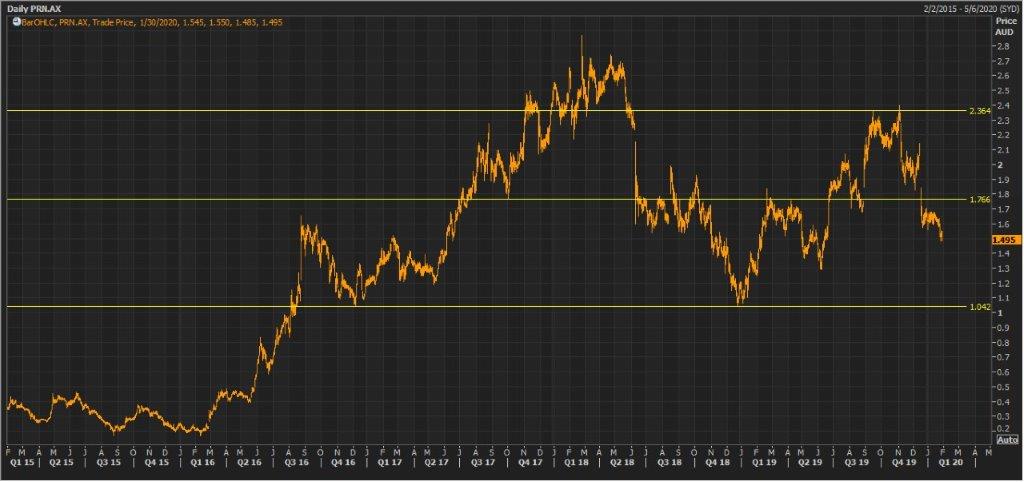
PRN Daily Technical Chart (Source: Thomson Reuters)
Newcrest Mining Limited
Changes in Executive Level: Newcrest Mining Limited (ASX: NCM) is engaged in the exploration, development, mining and the sale of gold. The market capitalisation of the company stood at $24.11 Bn as on 30th January 2020. The company recently announced some changes in its executive level and outlined that Suresh Vadnagra would be joining NCM as Chief Technical and Projects Officer (CTPO) role, effective from June 2020. The company also added that it has appointed Lisa Al as Chief People and Sustainability Officer as a successor for Ian Kemish.
In another update, the company notified the market with the results for December 2019 quarter, where the production of gold witnessed a rise of 8% and reached 551k ounces, and All-In Sustaining Cost stood at $859 per ounce, reflecting a fall of $40 against the prior quarter. During the quarter, the company also entered the S&P/ASX 20 index.
.png)
Key Operational Results (Source: Company Reports)
Guidance for production: The company is expecting gold and copper production in the range of 2,375-2,535koz and 130-145kt, respectively. However, gold production is anticipated to be around the bottom end of the guidance range provided.
Valuation Methodology: P/E Based Valuation
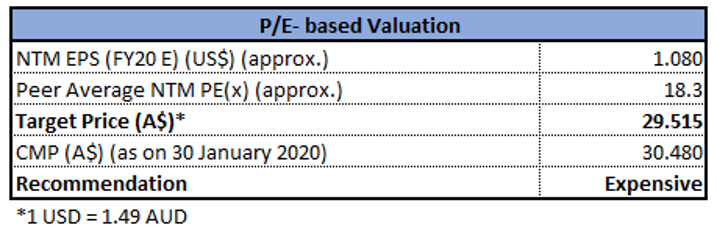
P/E Based Valuation (Source: Thomson Reuters)
Note: All forecasted figures have been taken from Thomson Reuters, NTM: Next Twelve Months
Stock Recommendation: For FY20, depreciation and amortisation expense are anticipated to be at the lower end of $630 Mn-680Mn. This is because of the expected lower gold production, in combination with a review of fixed assets as well as the mining inventory at Red Chris. We have valued the stock using P/E based relative valuation method, and for the purpose, we have taken peers such as OceanaGold Corp (ASX: OGC), Northern Star Resources Ltd (ASX: NST), Evolution Mining Ltd (ASX: EVN), etc., and arrived at a target price, which is offering correction of lower single-digit (in percentage terms). Thus, considering the correction of a lower single-digit, we give an “Expensive” recommendation on the stock at the current market price of $30.480 per share, down 2.806% on 30th January 2020.
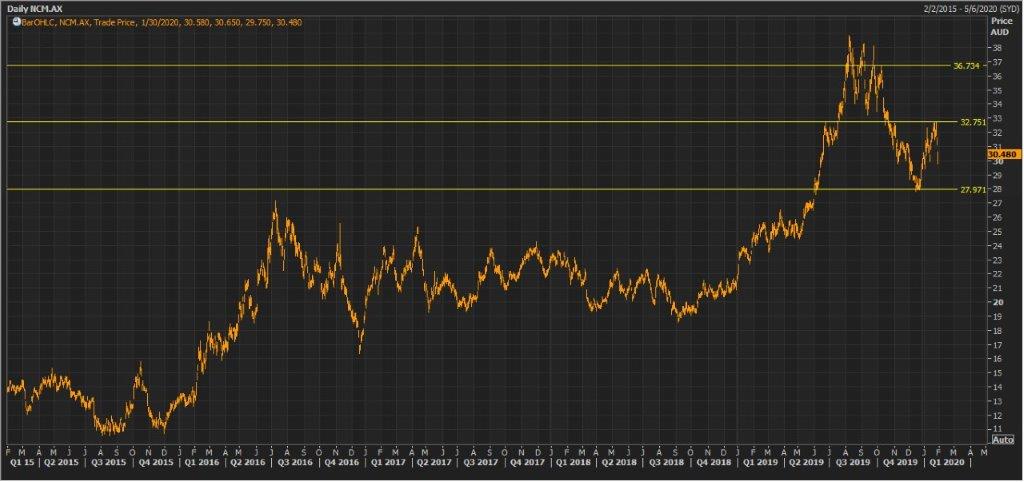
NCM Daily Technical Chart (Source: Thomson Reuters)
IGO Limited
Rise in Underlying Free Cash Flows: IGO Limited (ASX: IGO) is engaged in the exploration, development and mining of nickel, gold and copper-Zinc-silver. The market capitalisation of the company stood at $3.73 Bn as on 30th January 2020. The company recently released its results for 1H FY20 and stated that it has achieved record net profit after tax amounting to $100 million. The company also experienced a rise of 84% in underlying free cash flows. This has been driven because of improved production and commodity prices from Nova and Tropicana. Moreover, the company witnessed continued strong free cash generation in Q2 FY20 from Nova, on the back of timing of sales receipts.
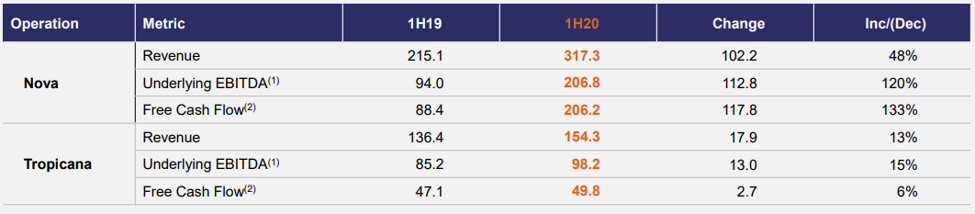
1H FY20 Results (Source: Company Reports)
What to Expect: The company anticipated cash costs to trend lower in the 2H FY20. The capital expenditure is forecasted to be in the range of $8 million-$10 million.
Valuation Methodology: P/CF Multiple Valuation
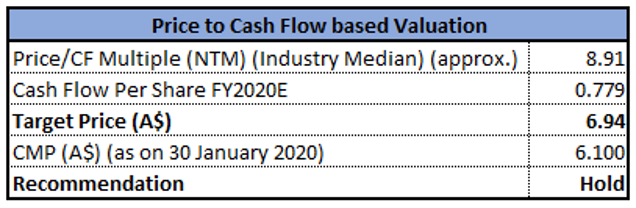
P/CF Based Valuation (Source: Thomson Reuters)
Note: All forecasted figures have been taken from Thomson Reuters, NTM: Next Twelve Months
Stock Recommendation: The company remains on track to deliver near term production growth and a pipeline of development assets on the back of several M&A opportunities. We have valued the stock using P/CF based relative valuation method, and for the purpose, we have taken peers such Gold Road Resources Ltd (ASX: GOR), Regis Resources Ltd (ASX: RRL), Northern Star Resources Ltd (ASX: NST), etc., and arrived at a target price, which is offering an upside of lower double-digit (in percentage terms). Therefore, considering the strong performance in 1HFY20 and favorable valuations, we maintain a “Hold” recommendation on the stock at the current market price of $6.100 per share, down 3.481% on 30th January 2020.
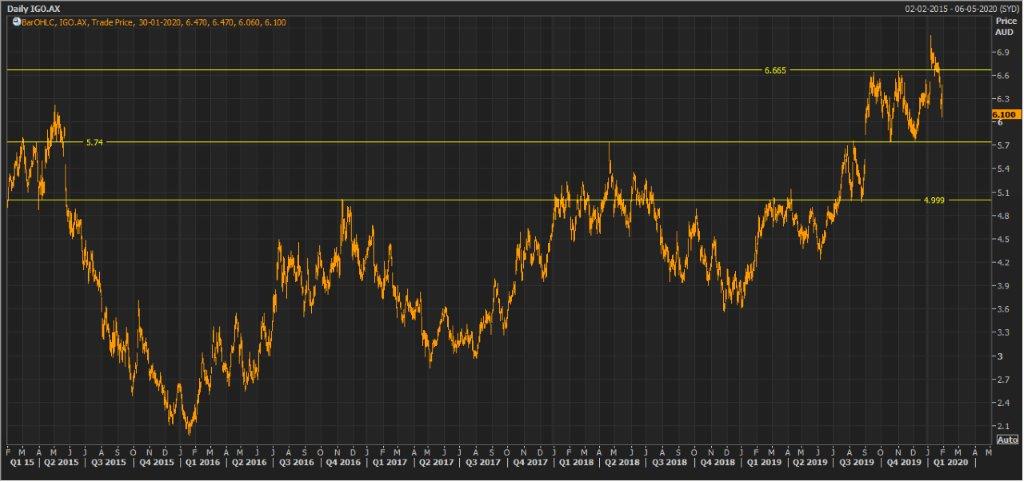
IGO Daily Technical Chart (Source: Thomson Reuters)
Orocobre Limited
A Look at December 2019 Quarter: Orocobre Limited (ASX: ORE) is a mineral exploration and production company. The market capitalisation of the company stood at $861.69 Mn as on 30th January 2020. The company reported production of 3,586 tonnes for December 2019 quarter, reflecting a fall from the 3,782 tonnes on pcp. During the quarter, the operational focus of the company was on process stability as well as product quality instead of maximising production tonnage.
In addition, product sales stood at 3,287 tonnes of lithium carbonate at an average price amounting to US$5,419/tonne on an FOB basis, and total sales revenue stood at US$17.8 million.
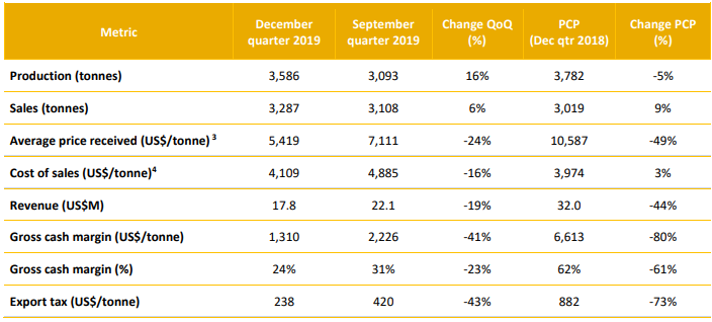
Key Numbers for December 2019 (Source: Company Reports)
Focus of ORE: For FY20, the company is expecting full-year production would be minimum 5% higher as compared to the production of FY19. The company continues to focus on decreasing the cost of production in order to maintaining its position as one of the low-cost producers of lithium chemicals.
Valuation Methodology: EV/Sales Based Valuation
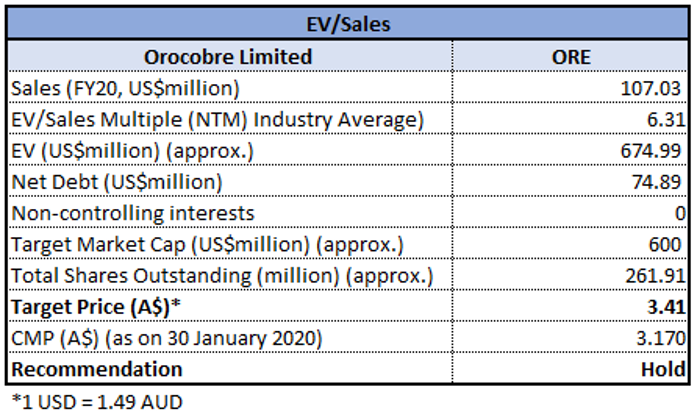
EV/Sales Based Valuation (Source: Thomson Reuters)
Note: All forecasted figures have been taken from Thomson Reuters, NTM: Next Twelve Months
Stock Recommendation: The company remains in a decent position with a healthy balance sheet. The company has delivered decent progress on growth projects at the Naraha Lithium Hydroxide Plant and Olaroz Stage 2 Expansion. We have valued the stock using EV/ Sales based relative valuation method and arrived at a target price, which is offering an upside of high single-digit (in percentage terms). Thus, considering the company’s focus on reducing the cost of production and decent position with a robust balance sheet, we give a “Hold” recommendation on the stock at the current market price of $3.170 per share, down 3.647% on 30th January 2020.
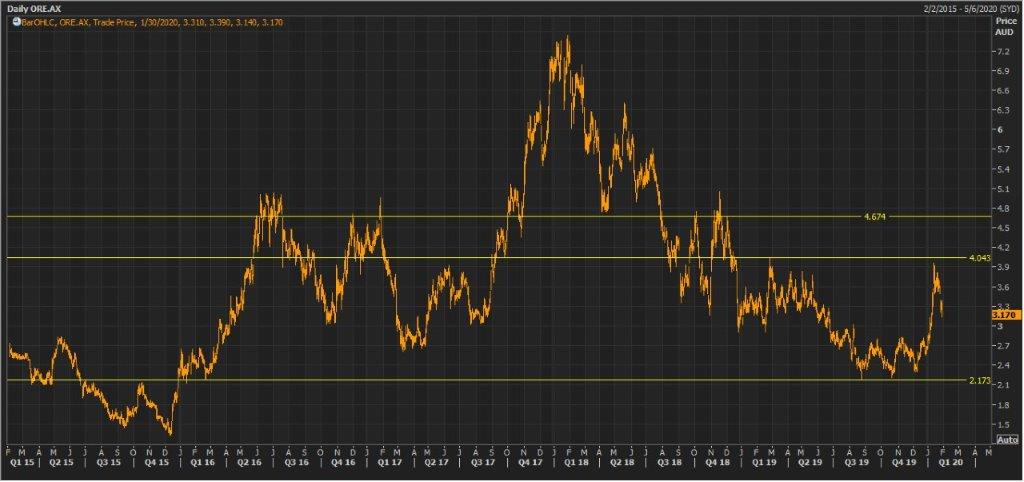
ORE Daily Technical Chart (Source: Thomson Reuters)
Galaxy Resources Limited
Sales Volume Below Guidance: Galaxy Resources Limited (ASX: GXY) is engaged in the production of lithium concentrate as well as exploration for minerals in Australia. The company recently announced that Credit Suisse Holdings (Australia) Limited on behalf of Credit Suisse Group AG and its affiliates has made a change to their substantial holdings in the company on 24th January 2020. As per the announcement, the current voting power stands at 6.24% as compared to the previous voting power of 5.11%.
For the quarter ended December 2019, the company production volume stands at 43,222 dry metric tonnes of lithium concentrate, grading 6.0% Li2O at Mt Cattlin. Total sales volume stood at 29,778 dmt, which was just below the guidance range of 30,000 dmt – 45,000 dmt.
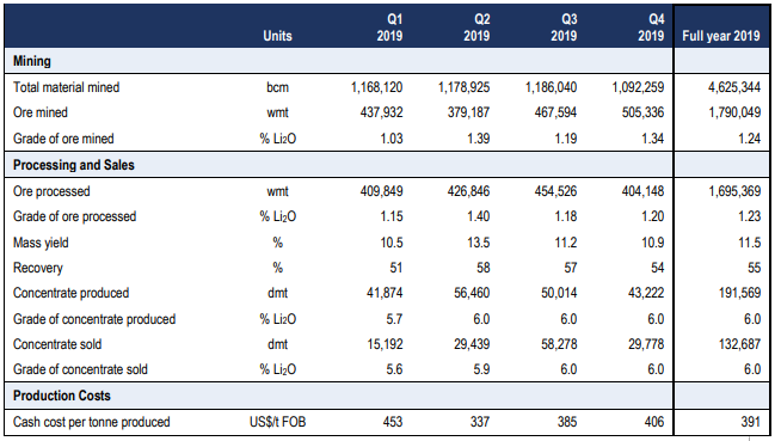
Production & Sales Statistics at Mt Cattlin (Source: Company Reports)
Production Guidance: For Q1 FY20, the company is expecting lithium concentrate production volume in the ambit of 14,000 dmt – 20,000 dmt following the restart of operations.
Valuation Methodology: EV/Sales Based Valuation
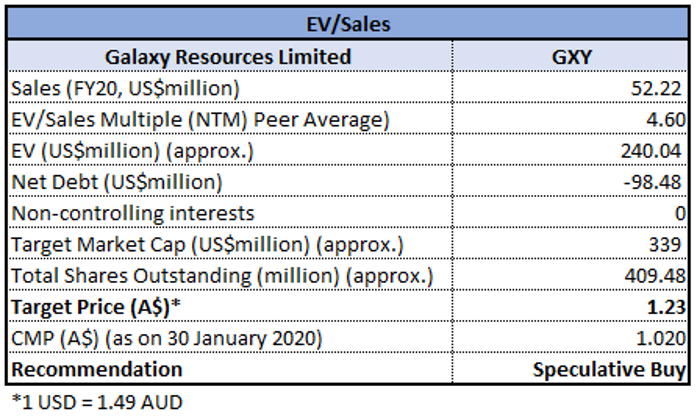
EV/Sales Based Valuation (Source: Thomson Reuters)
Note: All forecasted figures have been taken from Thomson Reuters, NTM: Next Twelve Months
Stock Recommendation: The company remains in a debt-free position with cash and financial assets of US$143.2 million at the end of December 2019 quarter. We have valued the stock using EV/ Sales based relative valuation method, and for the purpose, we have taken peers such Orocobre Ltd (ASX: ORE), Pilbara Minerals Ltd (ASX: PLS), Altura Mining Ltd (ASX: AJM) etc., and arrived at a target price, which is offering an upside of lower double-digit (in percentage terms). Therefore, taking into account debt-free position of GXY and decent outlook, we give a “Speculative Buy” recommendation on the stock at the current market price of $1.020 per share, down by 3.774% on 30th January 2020.
.jpg)
GXY Daily Technical Chart (Source: Thomson Reuters)
OceanaGold Corporation
Increase in Gold Production: OceanaGold Corporation (ASX: OGC) is a multinational, mid-tier gold company. The market capitalisation of the company stood at $1.66 Bn as on 30th January 2020. The company recently updated the market with its unaudited full year and fourth quarter 2019 results and stated that gold production from the United States and New Zealand operations have experienced a rise of around 20% on QoQ basis. This has been driven by the stronger production from Haile and Macraes. It added that Haile gold production witnessed an increase of 26% on QoQ with 46,420 ounces produced in the fourth quarter. Despite the weather challenges, the company managed to witness growth in its Haile gold production, which signifies the company’s constant productivity improvements.
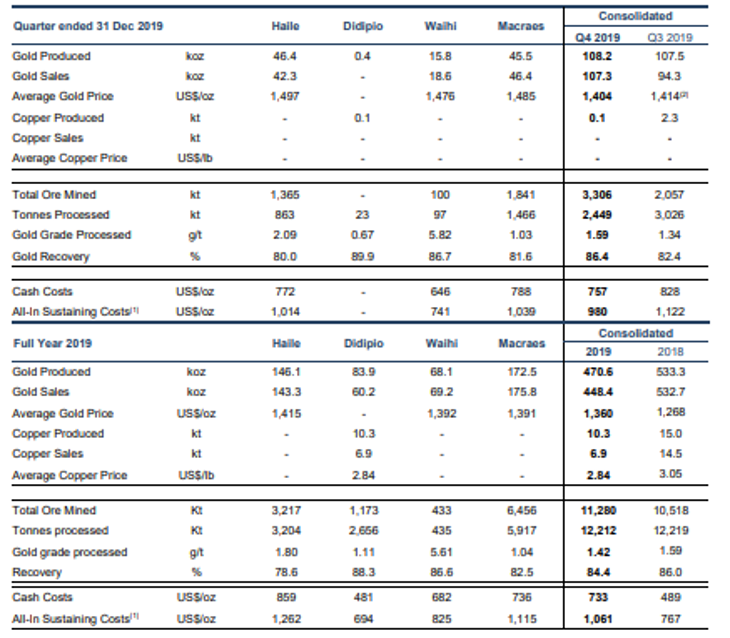
Fourth Quarter and Full-Year Operational Results (Source: Company Reports)
Robust Project Pipeline: The company is progressing and prioritising its robust project pipeline in New Zealand and North America with respect to its principle to pursue opportunities that can deliver strong economic returns.
Valuation Methodology: P/E Multiple Based Valuation
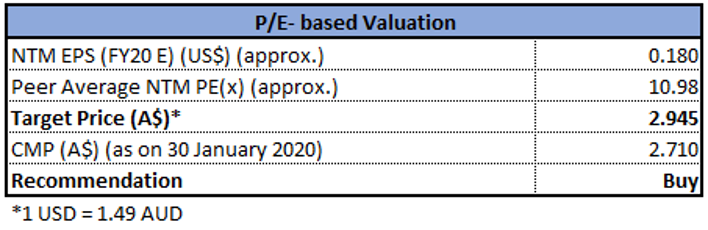
P/E Based Valuation (Source: Thomson Reuters)
Note: All forecasted figures have been taken from Thomson Reuters, NTM: Next Twelve Months
Stock Recommendation: The company has also continued to develop Martha Underground with around 830 metres of development and construction of the raise bore between the 800-RL and 920-RL drives completed in the December quarter. We have valued the stock using P/E based relative valuation method, and for the purpose, we have taken peers such as St Barbara Ltd (ASX: SBM), Regis Resources Ltd (ASX: RRL) and Gold Road Resources Ltd (ASX: GOR), and arrived at a target price, which is offering an upside of higher single-digit (in percentage terms). Hence, considering the decent valuation, increase in production and other factors, we give a “Buy” recommendation on the stock at the current market price of $2.710 per share, up by 1.498% on 30th January 2020.
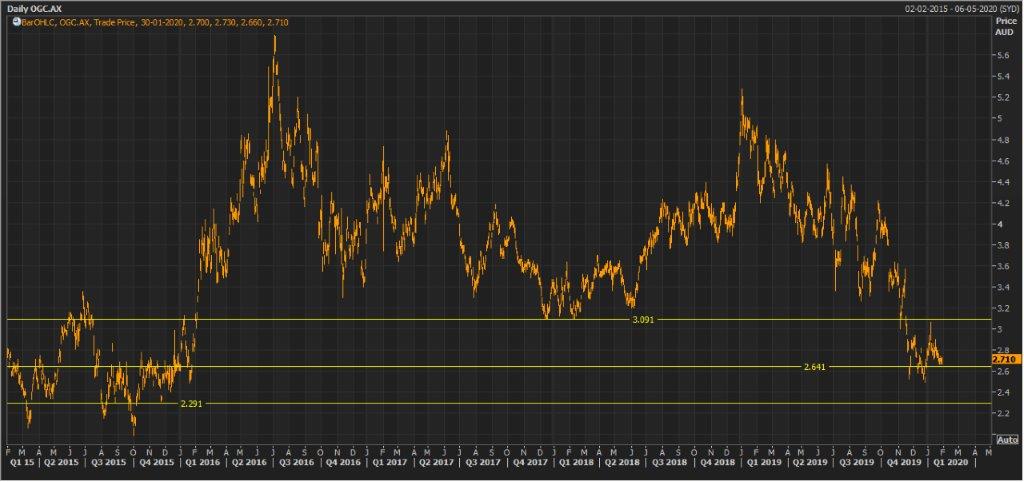
OGC Daily Technical Chart (Source: Thomson Reuters)
Disclaimer
The advice given by Kalkine Pty Ltd and provided on this website is general information only and it does not take into account your investment objectives, financial situation or needs. You should therefore consider whether the advice is appropriate to your investment objectives, financial situation and needs before acting upon it. You should seek advice from a financial adviser, stockbroker or other professional (including taxation and legal advice) as necessary before acting on any advice. Not all investments are appropriate for all people. Kalkine.com.au and associated pages are published by Kalkine Pty Ltd ABN 34 154 808 312 (Australian Financial Services License Number 425376). The information on this website has been prepared from a wide variety of sources, which Kalkine Pty Ltd, to the best of its knowledge and belief, considers accurate. You should make your own enquiries about any investments and we strongly suggest you seek advice before acting upon any recommendation. Kalkine Pty Ltd has made every effort to ensure the reliability of information contained in its newsletters and websites. All information represents our views at the date of publication and may change without notice. To the extent permitted by law, Kalkine Pty Ltd excludes all liability for any loss or damage arising from the use of this website and any information published (including any indirect or consequential loss, any data loss or data corruption). If the law prohibits this exclusion, Kalkine Pty Ltd hereby limits its liability, to the extent permitted by law to the resupply of services. There may be a product disclosure statement or other offer document for the securities and financial products we write about in Kalkine Reports. You should obtain a copy of the product disclosure statement or offer document before making any decision about whether to acquire the security or product. The link to our Terms & Conditions has been provided please go through them and also have a read of the Financial Services Guide. On the date of publishing this report (mentioned on the website), employees and/or associates of Kalkine Pty Ltd do not hold positions in any of the stocks covered on the website. These stocks can change any time and readers of the reports should not consider these stocks as advice or recommendations.
 AU
AU

 Please wait processing your request...