Tabcorp Holdings Limited
.png)
TAH Details
Decent Increase in Revenue and Profits: Tabcorp Holdings Limited (ASX: TAH) provides gambling and other entertainment services. As on 19 February 2020, the market capitalisation of the company stood at ~$9.26 billion. The company has recently announced its interim results for the period ending 31 December 2019, wherein it reported an increase of 4.4% in group revenue to $2,913.9 million and a growth of 2.9% in Net Profit After Tax to $213.5 million. This increase resulted in a rise in EPS by 2.9% to 10.6 cents per share. The group results are driven by excellent lottery performance. The decent financial performance enabled the Board to declare a fully franked interim dividend of 11 cents per share, which is to be paid on 18 March 2020.
.png)
1H20 Financial Highlights (Source: Company Reports)
What to Expect: The company will focus on enhancing customer experience via additional instalment prize division and improved chances of winning. It will also enable alternative payment platforms for its customers. TAH is aiming to accelerate realisation of benefits from data, personalisation and digital-in-venue capability and will work on managing its expenses with full optimisation.
Valuation Methodology: Price to Earnings Multiple Based Approach
.png)
Price to Earnings Multiple (source: Thomson Reuters)
Note: All the forecasted figures are taken from Thomson Reuters, NTM: Next Twelve Months
Stock Recommendation: As per ASX, the stock of TAH gave a return of 3.39% in the past six months and is trading very close to its 52-weeks’ lower levels of $4.185. This offers a decent opportunity for investors for accumulation. During FY19, gross margin of the company stood at 36% as compared to the industry median of 55.8%. In the same time span, ROE of the company was 5.2%. Considering the returns, trading levels and decent growth opportunities, we have valued the stock using Price to Earnings based valuation approach and have arrived at a target upside of lower double-digit (in percentage terms). Hence, we recommend a “Buy” rating on the stock at the current market price of $4.310, down by 5.689% on 19 February 2020, owing to its recent release of interim results.
.jpg)
TAH Daily Technical Chart (Source: Thomson Reuters)
CIMIC Group Limited
.png)
CIM Details
UGL Secures $450m in Oil & Gas Maintenance Contracts: CIMIC Group Limited (ASX: CIM) provides construction, mining and operation and maintenance services to the infrastructure. As on 19 February 2020, the market capitalisation of the company stood at ~$8.79 billion. The company has recently announced that UGL has secured contracts to provide maintenance services in the oil and gas sector, which will be executed over a multiple time period. These contracts will generate a revenue of ~$450 million.
During FY19, the company performed well with the growth of 3% in NPAT to $800 million, solid operating cash flow of $1.7 billion, stable revenue of $14.7 billion and diversified work in hand.
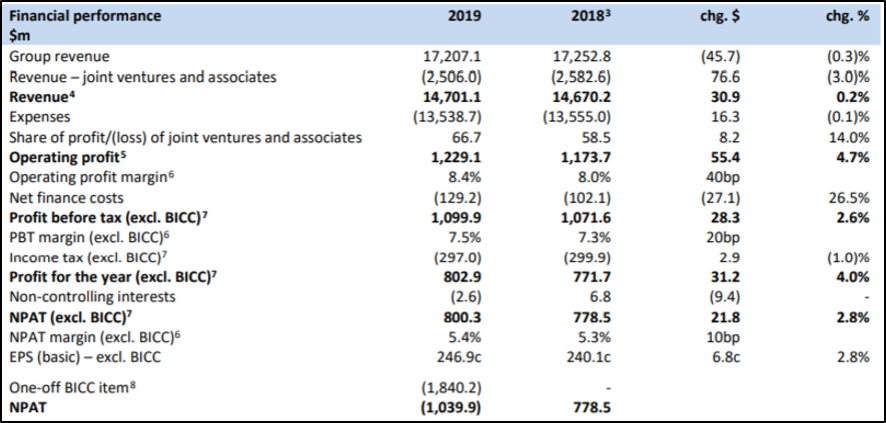
FY19 Financial Performance (Source: Company Reports)
Outlook and Guidance: The company has given guidance for FY20 and expects NPAT to be in the range of $810 million to $850 million. This is supported by a strong level of work in hand and positive outlook across the core markets of the company. CIM will focus on maintaining a strong balance sheet and is confident about the future outlook.
Valuation Methodology: Price to Earnings Based Valuation
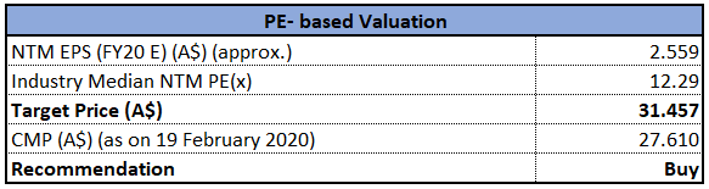
Price to Earnings Multiple (source: Thomson Reuters)
Note: All the forecasted figures are taken from Thomson Reuters, NTM: Next Twelve Months
Stock Recommendation: As per ASX, the stock of CIM is trading close to its 52-week low of $26.820, proffering a decent opportunity for accumulation. During FY19, gross margin of the company stood at 44.1%, higher than the industry median of 12.9%. In the same time span, EBITDA margin of the company was 14.4% as compared to the industry median of 6.2%. Considering the trading levels, higher gross and EBITDA margin and decent outlook, we have valued the stock using price to earnings based valuation approach and have arrived at a target upside of lower double-digit (in percentage terms). For the said purposes, we have considered Downer EDI Ltd (ASX: DOW), Boral Ltd (ASX: BLD) and SRG Global Ltd (ASX: SRG) as peers. Hence, we recommend a “Buy” recommendation on the stock at the current market price of $27.610, up by 1.694% on 19 February 2020.
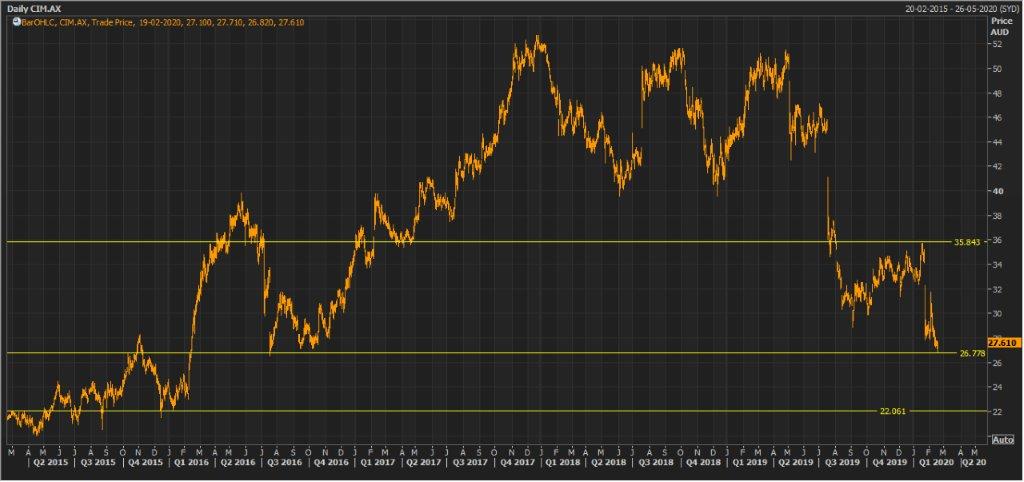
CIM Daily Technical Chart (Source: Thomson Reuters)
Boral Limited

BLD Details
Re-activation of DRP: Boral Limited (ASX: BLD) manufactures and supply building and construction materials. As on 19 February 2020, the market capitalisation of the company stood at ~$5.63 billion. The company has recently announced that it will reactivate the Dividend Reinvestment Plan from 15 April 2020 and 1.5% discount will be applied to the DRP for the interim dividend.
Update on 1H FY2020 Results: During 1H20, revenue of the company went up by 2% to $2,960 million, and EBITDA stood at $493 million, up from $470 million in 1H19. Owing the decent financial performance, the company has declared a partially franked interim dividend of 9.5 cents per share which is to be paid on 15 April 2020. This represents a payout ratio of 71%.
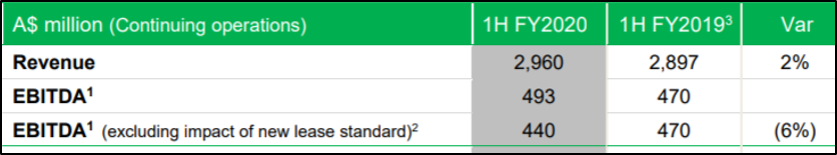
Revenue and EBITDA for 1H FY2020 (Source: Company Reports)
Growth Opportunities: The company has provided guidance for FY20 and expects a decrease in FY20 EBITDA relative to FY19. It also anticipates NPAT to be in between $320-$340 million and is focusing on the management of balance to ensure operational flexibility.
Valuation Methodology: Price to Earnings Based Valuation
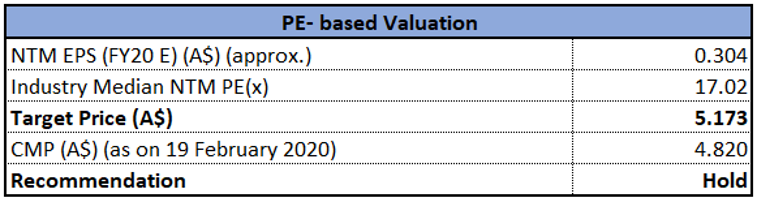
Price to Earnings Multiple (source: Thomson Reuters)
Note: All the forecasted figures are taken from Thomson Reuters, NTM: Next Twelve Months
Stock Recommendation: As per ASX, the stock of BLD gave a return of 6.67% on the YTD basis. During FY19, gross margin was in line with the previous year and stood at 33.7%. In the same time span, EBITDA margin witnessed a YOY improvement and stood at 16.1%, up from 15.5% in FY18. Considering the returns, increase in EBITDA margin and decent financial performance, we have valued the stock using price to earnings based relative valuation and have arrived at a target upside of higher single-digit (in percentage terms). For the said purposes, we have considered CSR Ltd (ASX: CSL), Fletcher Building Ltd (ASX: FBU) etc. as peers. Hence, we recommend a “Hold” rating on the stock at the current market price of $4.820, up by 0.417% on 19 February 2020.
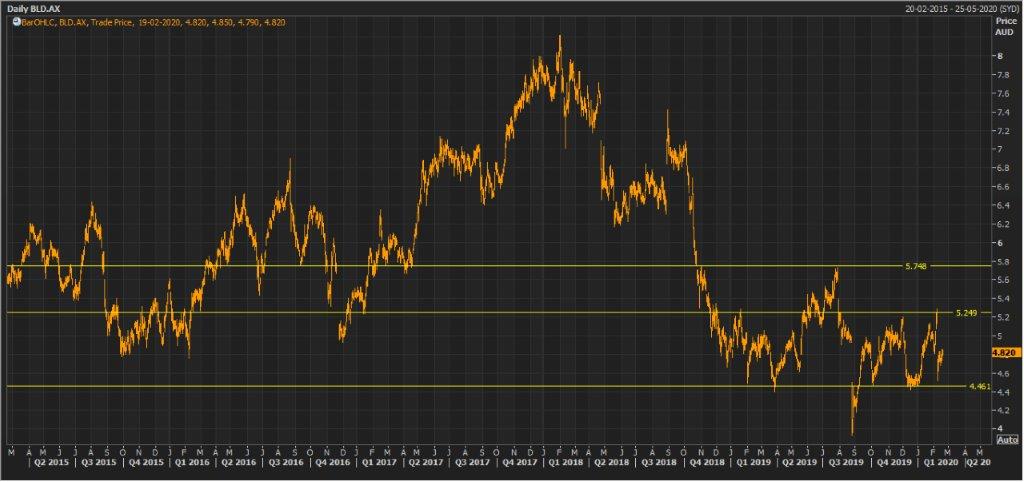
BLD Daily Technical Chart (Source: Thomson Reuters)
Sonic Healthcare Limited
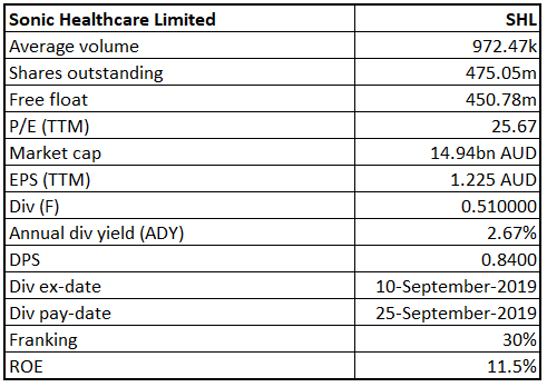
SHL Details
Decent Rise in Revenue and Net Profits: Sonic Healthcare Limited (ASX: SHL) is one the largest medical diagnostic companies which provide laboratory and radiology services to medical practitioners. As on 19 February 2020, the market capitalisation of the company stood at ~$14.94 billion. The company has recently released its results for the period ending 31 December 2019, wherein it reported an increase of 15% in revenue to $3,344 million and a similar increase in net profit to $256 million. This was mainly driven by organic growth, along with growth due to Aurora acquisition. The decent financial performance resulted in EPS to rise by 3.5% to 53.7 cents per share. The company has also declared a partially franked interim dividend of 34 cents per share which is to be paid on 25 March 2020.
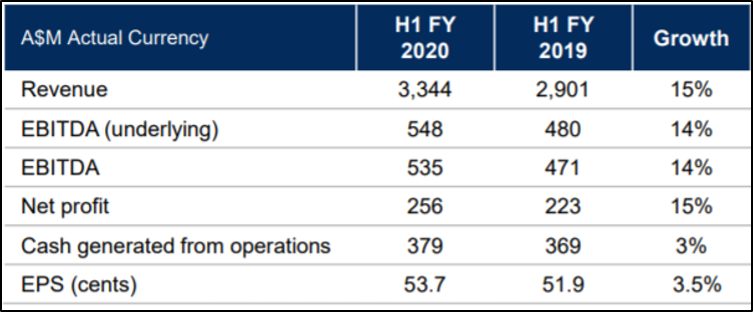
1H20 Financial Performance (Source: Company Reports)
What to Expect: The company is in a strong and a stable position and is expecting organic growth in coming years. SHL has given guidance for FY20 and expects an increase of 6% to 8% on underlying FY19 EBITDA. The company will continue to improve in services and efficiencies and will mitigate risk through geographical diversification.
Valuation Methodology: EV/EBITDA Based Valuation

EV/EBITDA Based Valuation (Source: Thomson Reuters)
Note: All the forecasted figures are taken from Thomson Reuters, NTM: Next Twelve Months
Stock Recommendation: As per ASX, the stock of SHL gave a return of 13.33% in the past six months and a return of 7.93% in the last three months. The stock is also trading very close to its 52-weeks’ high level of $32.070. During FY19, net margin of the company was 9.1% as compared to the industry median of 3.6%. In the same time span, ROE was broadly in line with industry median and stood at 11.5%. Considering the returns, trading levels and higher net margin, we have valued the stock using EV/EBITDA valuation approach and have arrived at a downside of higher single-digit (in percentage terms). For the said purposes, we have considered Healius Ltd (ASX: HLS), Resmed Inc (ASX: RMD) etc. as peers. Hence, we give an expensive rating on the stock at the current market price of $31.580, up by 0.413% on 19 February 2020.
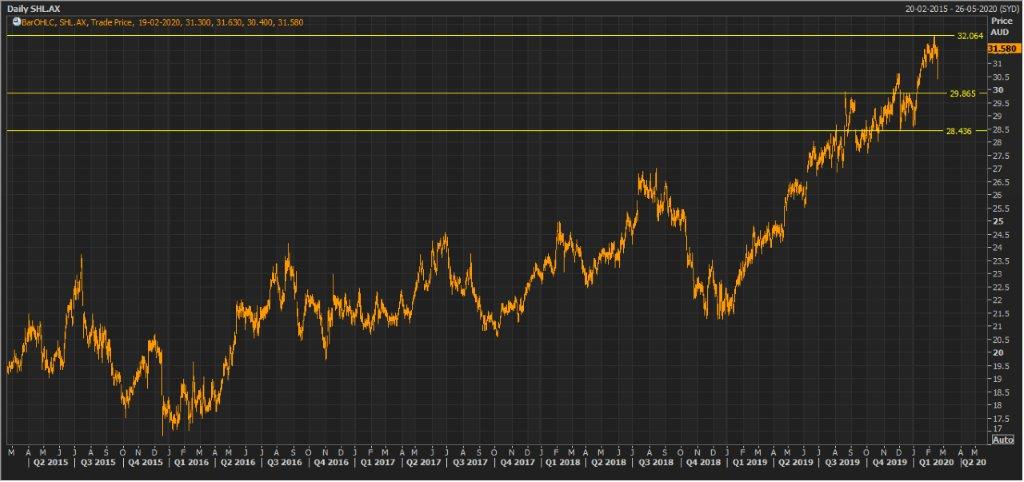
SHL Daily Technical Chart (Source: Thomson Reuters)
Crown Resorts Limited
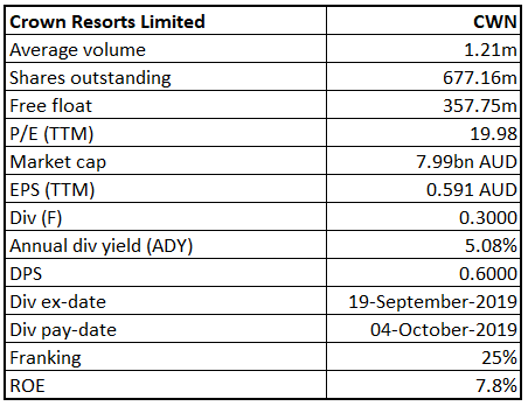
CWN Details
Significant Increase in NPAT: Crown Resorts Limited (ASX: CWN) is an international casino and gaming entity. As on 19 February 2020, the market capitalisation of the company stood at ~$7.99 billion. The company released its interim results for the period ending 31 December 2019 wherein it reported an increase of 14% in EBITDA to $446.8 million and a growth of 24.8% in reported NPAT to $218.2 million. The decent financial performance of the company enabled the Board to declare a partially franked interim dividend of 30 cents per share which is to be paid on 3 April 2020.
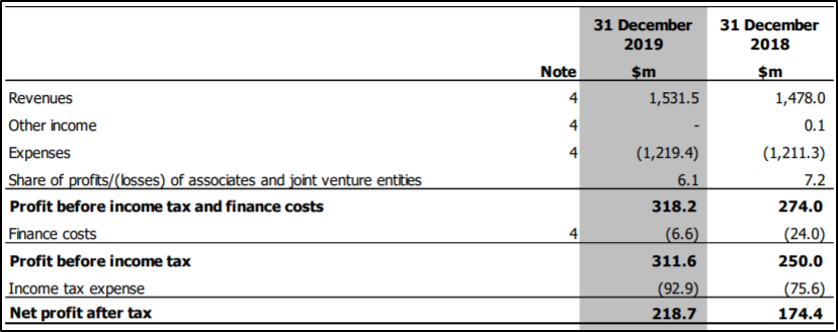
1H20 Financial Performance (Source: Company Reports)
What to Expect: The company is focusing on improving the underlying performance of Crown Melbourne, Crown Perth and Crown Aspinalls. It is targeting to maintain an appropriate and efficient capital structure and is proactively engaged with relevant stakeholders to deliver returns to shareholders.
Valuation Methodology: EV/Sales Based Valuation
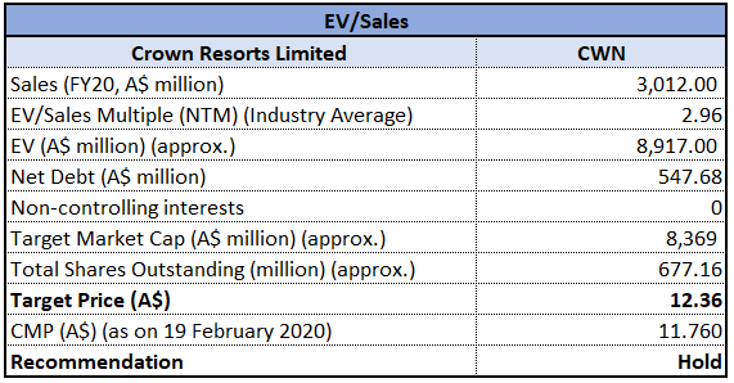
EV/Sales Based Valuation (Source: Thomson Reuters)
Note: All the forecasted figures are taken from Thomson Reuters, NTM: Next Twelve Months
Stock Recommendation: As per ASX, the stock of CWN gave a return of 3.78% in the past six months and is inclined towards its 52-weeks’ low level of $11.01. During FY19, gross margin witnessed an improvement over the previous year and stood at 22.2%, up from 19.4% in FY18. In the same time span, net margin of the company stood at 13.8%, higher than the industry median of 9.4%. Considering the returns, trading levels, higher gross and net margin and modest outlook, we have valued the stock using EV/Sales valuation approach and have arrived at a target upside of middle single-digit (in percentage terms). For the said purposes, we have considered Aristocrat Leisure Ltd (ASX: ALL), Tabcorp Holdings Ltd (ASX: TAH) and Star Entertainment Group Ltd (ASX: SGR) as peers. Hence, we recommend a “Hold” recommendation on the stock at the current market price of $11.760, down by 0.339% on 19 February 2020.
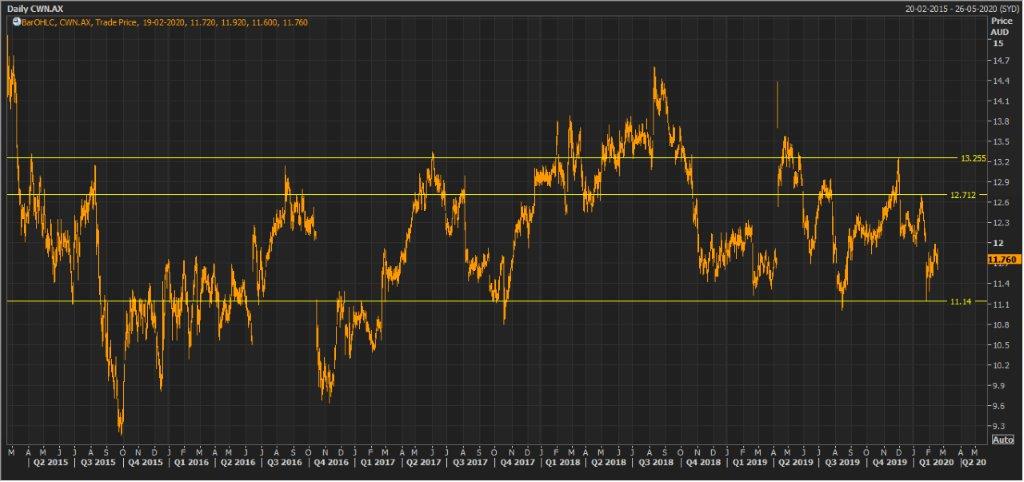
CWN Daily Technical Chart (Source: Thomson Reuters)
Orora Limited
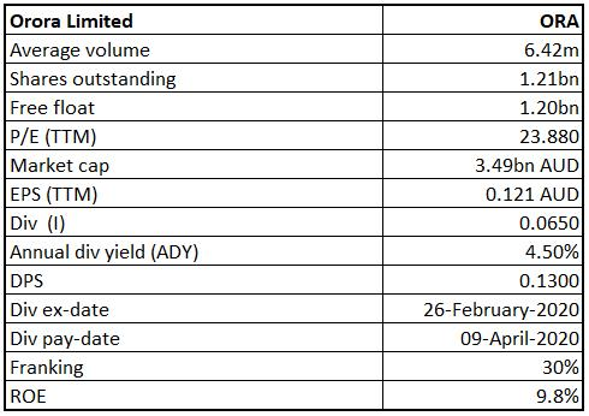
ORA Details
Decent Rise in Sales Revenue: Orora Limited (ASX: ORA) provides a range of fibre, metal and glass packaging solutions. The market capitalisation of the company stood at $3.49 Bn as on 19th February 2020. The company recently announced that Challenger Limited and its entities has made a change to their substantial holdings in the company on 10th February 2020 and the current voting power stands at 6.01% as compared to the previous voting power of 5.00%. For the half-year ended 31 December 2019 (1H FY20), the company reported a rise of 13.3% in sales revenue, which amounted to $1,835.2 million.
The Board of the company declared an interim ordinary dividend amounting to 6.5 cents per share, which was franked to 30% and 70% sourced from the conduit foreign income account, in-line with pcp.
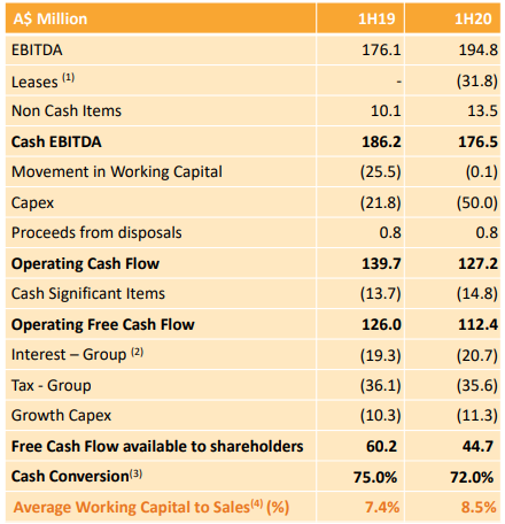
Cash Flow (Source: Company Reports)
What to Expect: The company anticipates difficult market conditions to continue for the remainder of FY20. However, the company would continue to invest in efficiency, growth and innovation, as well as integrate recent acquisitions and finalise the sale of the Fibre business.
Valuation Methodology:EV/Sales Based Valuation
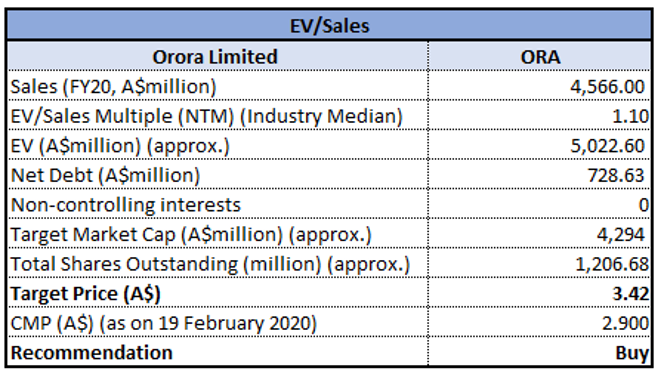
EV/Sales Based Valuation (Source: Thomson Reuters)
Note: All forecasted figures and peers have been taken from Thomson Reuters, NTM: Next Twelve Months
Stock Recommendation: The company has invested over $60.0 million to support organic capital projects and innovation during 1H FY20. The strong cash flow capability of the company, together with the strength of its balance sheet has provided capacity and flexibility to invest in innovation and organic and new growth opportunities which would help the company deliver long term, sustainable value. We have valued the stock using EV to sales based relative valuation approach and arrived at a target price, which is offering an upside of lower double-digit (in percentage terms). Hence, in the light of strong cash flow capability, focus on investment and decent valuation upside, we give a “Buy” recommendation on the stock at the current market price of $2.900 per share, up by 0.346% on 19th February 2020.
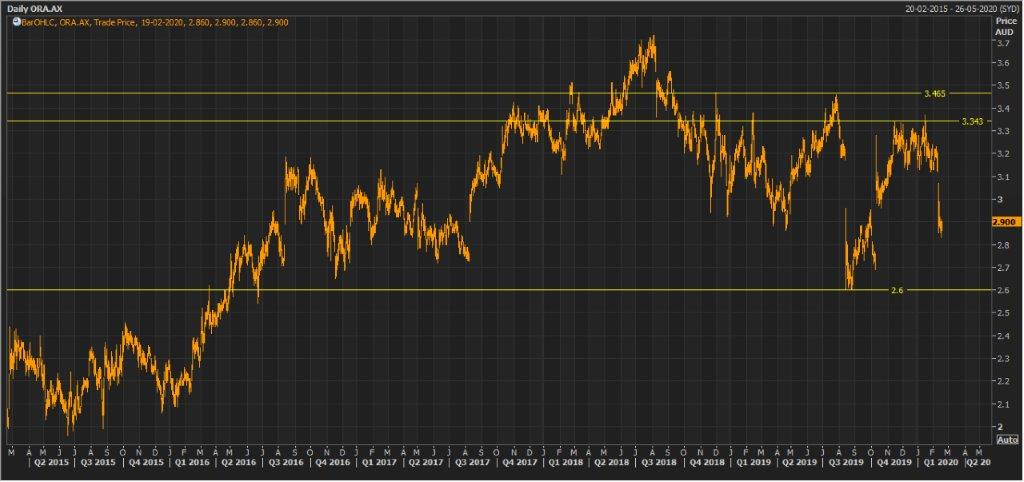
ORA Daily Technical Chart (Source: Thomson Reuters)
Disclaimer
The advice given by Kalkine Pty Ltd and provided on this website is general information only and it does not take into account your investment objectives, financial situation or needs. You should therefore consider whether the advice is appropriate to your investment objectives, financial situation and needs before acting upon it. You should seek advice from a financial adviser, stockbroker or other professional (including taxation and legal advice) as necessary before acting on any advice. Not all investments are appropriate for all people. Kalkine.com.au and associated pages are published by Kalkine Pty Ltd ABN 34 154 808 312 (Australian Financial Services License Number 425376). The information on this website has been prepared from a wide variety of sources, which Kalkine Pty Ltd, to the best of its knowledge and belief, considers accurate. You should make your own enquiries about any investments and we strongly suggest you seek advice before acting upon any recommendation. Kalkine Pty Ltd has made every effort to ensure the reliability of information contained in its newsletters and websites. All information represents our views at the date of publication and may change without notice. To the extent permitted by law, Kalkine Pty Ltd excludes all liability for any loss or damage arising from the use of this website and any information published (including any indirect or consequential loss, any data loss or data corruption). If the law prohibits this exclusion, Kalkine Pty Ltd hereby limits its liability, to the extent permitted by law to the resupply of services. There may be a product disclosure statement or other offer document for the securities and financial products we write about in Kalkine Reports. You should obtain a copy of the product disclosure statement or offer document before making any decision about whether to acquire the security or product. The link to our Terms & Conditions has been provided please go through them and also have a read of the Financial Services Guide. On the date of publishing this report (mentioned on the website), employees and/or associates of Kalkine Pty Ltd do not hold positions in any of the stocks covered on the website. These stocks can change any time and readers of the reports should not consider these stocks as advice or recommendations.
 AU
AU

 Please wait processing your request...