The Kraft Heinz Company
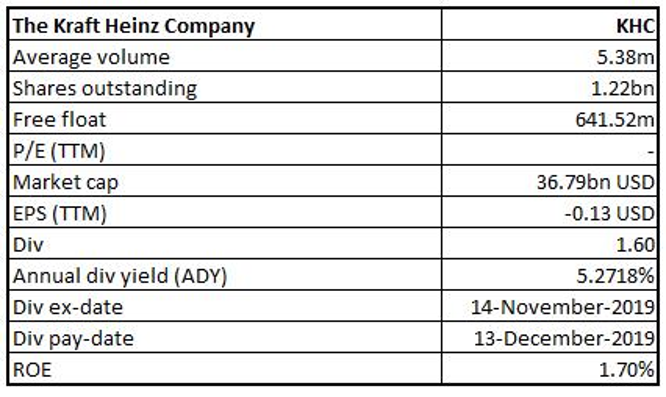
KHC Details
Net Income Up ~45.2% Year Over Year in Q3FY19:The Kraft Heinz Company (NASDAQ: KHC) operates in the food and beverage segment and has a diversified portfolio of iconic and emerging brands. On 9th January 2020, the company appointed Carlos Abrams-Rivera to its Senior Leadership Team. Carlos Abrams-Rivera will serve the position of U.S. Zone President with effect from 03 February 2020.
Q3FY19 Operational Highlights for the Period ended 28 September 2019: KHC declared its quarterly reports, wherein the company reported net sales of $6,076 million, down 4.8% from the previous corresponding period on account of the unfavorable impacts of acquisitions and divestitures and foreign currency impact.Gross profit came in at $1,947 million, down from $2,094 million in Q3FY18. The quarter witnessed unfavorable Volume/mix across the United States and Rest of World which was partially offset by growth in Canada and EMEA regions. The company reported operating income at $1,180 million, up 9.8% on y-o-y basis driven by higher impairment losses during the prior corresponding year. Adjusted EBITDA came lower at $1,469 million as compared to $1,594 million in the previous corresponding period. The business reported net income at $899 million, up 45.2% year over year. The company exited the quarter with cash and cash equivalent of $2,315 million, total assets of $102,822 million and total equity of $51,804 million.
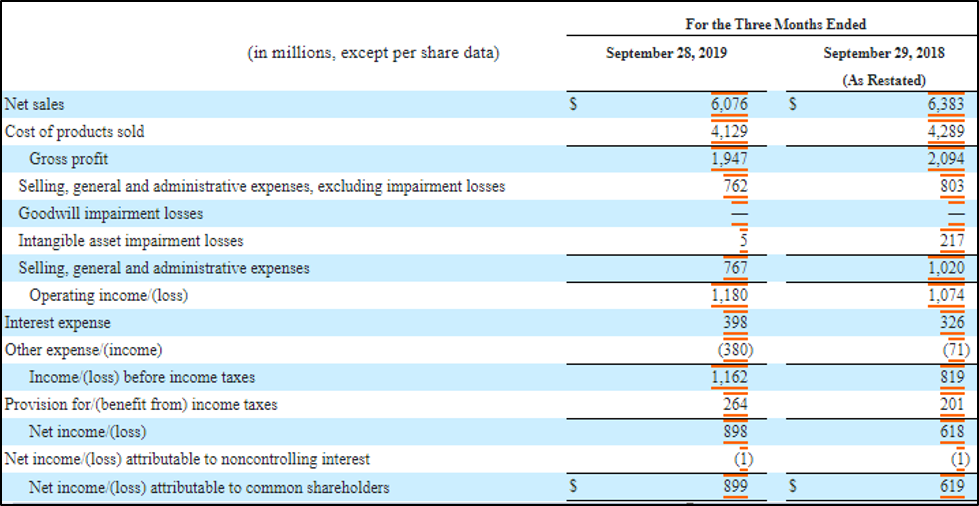
Q3FY19 Income Statement Highlights (Source: Company Reports)
Valuation Methodology: Enterprise Value to Sales Multiple Approach
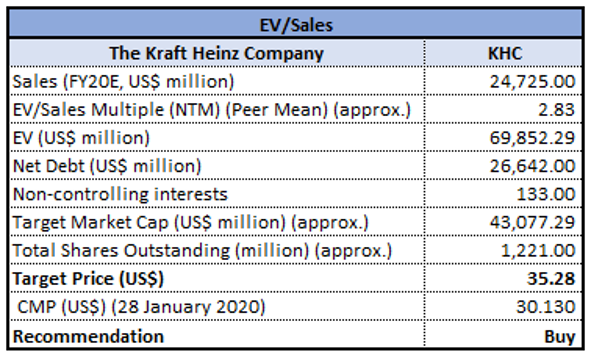
Enterprise Value to Sales Based Valuation (Source: Company Reports)
Note: All forecasted figures and peers have been taken from Thomson Reuters, NTM-Next Twelve Months
Stock Recommendation:The stock of KHC is quoting at $30.13 with a market capitalization of $36.79 billion. The stock is trading close to the average of its 52-week low-high trading range of $24.86 to $48.66, respectively. The business continues to rebuild its momentum with its focus on boosting business growth via consumer-first marketing, people development and innovation. Considering the above factors, we have valued the stock using one relative valuation method, i.e., Enterprise Value to Sales based approach. For this, we have taken peers like PepsiCo Inc (NASDAQ: PEP), Unilever PLC (NYSE: ULVR) and Kellogg Co (NYSE: K) and arrived at a target price with lower double-digit upside (in % terms). Hence, we give a “Buy” rating on the stock at the current market price of $30.13 per share, down by 0.72% on 28 January 2020.
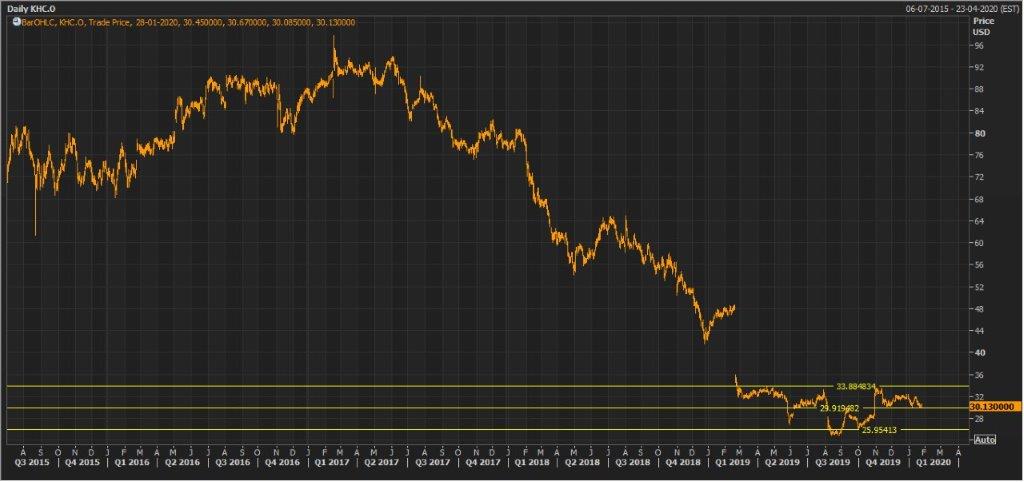
KHC Daily Technical Chart (Source: Thomson Reuters)
Schlumberger N.V.
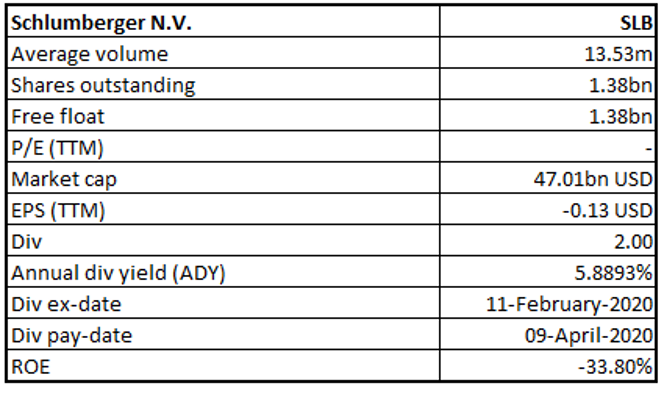
SLB Details
Reported Strong Activity in North America During H1FY19:Schlumberger N.V. (NYSE: SLB) is a leading service provider of technology for reservoir categorization, drilling, production and processing to the oil and gas industry.
FY19 Operational Highlights for the Period ended 31 December 2019:SLB announced its full-year results, wherein the company reported total revenue at $32,917 million as compared to $32,815 million in FY18. Global natural gas pricing was stable with well-supplied markets in FY19. Liquified natural gas (LNG) supply capacity soared around 10% during FY19. The LNG prices across Asia and Europe stood less than half of FY18. The first half of 2019 was marked by strong activity in North America. However, in the second half of 2019, the company witnessed a slowdown on the back of budget exhaustion along with cash flow constraints. The company reported a net loss at $10,137 million as compared to a profit of $2,138 million in the previous financial year. The loss was due to the inclusion of impairments & other expenses of $13,148 million in FY19. Average Gas Prices stood at $2.56 per million British thermal units (mmbtu) during FY19. During the year cash flow from operations and free cash flow stood at $5.4 billion and $2.7 billion, respectively.
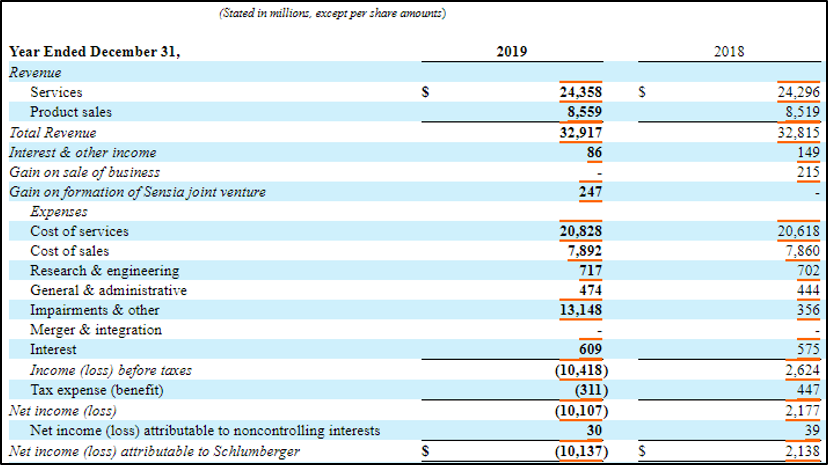
FY19 Income Statement Highlights (Source: Company Reports)
Outlook:For FY20, the company expects capex spending growth rate in the international markets to be between mid-single-digit range. Consequently, the business expects revenue growth from the international portfolio to grow at the same rate or at a higher rate. In 2HFY20, the company expects international revenue growth along with increasing offshore activity and improving activity mix on the back of early deepwater growth cycle.
Valuation Methodology: Price to Earnings Multiple Approach
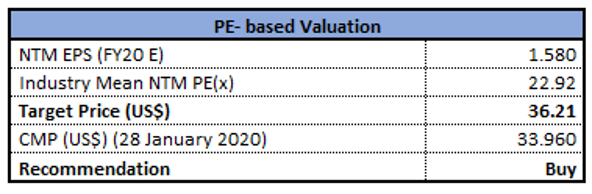
Price to Earnings value Based Valuation (Source: Thomson Reuters)
Note: All forecasted figures and peers have been taken from Thomson Reuters, NTM-Next Twelve Months
Stock Recommendation:The stock of SLB is quoting at $33.96 with a market capitalization of $47.01 billion. The stock is trading at the lower band of its 52-week trading range of $30.65 to $48.88.The business delivers one of the comprehensive range of products and services, from exploration through production, and cohesive pore-to-pipeline solutions that improve hydrocarbon recovery to deliver reservoir performance sustainably. Considering the above factors, we have valued the stock using one relative valuation method, i.e., Price to earnings multiple based approach. For this, we have taken peers like National Oilwell Varco Inc (NYSE: NOV), PGS ASA (OTC: PGS) and Baker Hughes Co (NYSE: BKR) and arrived at a target price with lower double-digit upside (in % terms). Hence, we give a “Buy” rating on the stock at the current market price of $34.02, up 0.18% as on 28 January 2020.
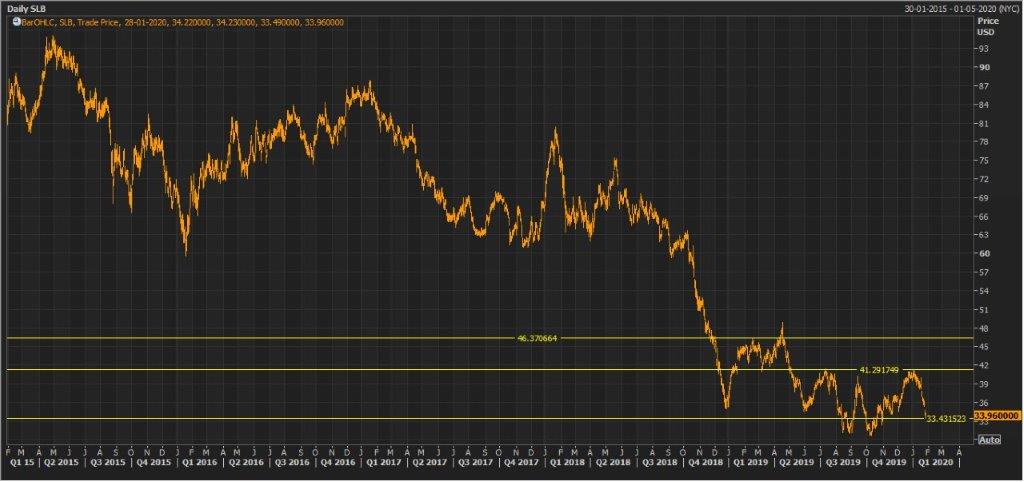
SLB Daily Technical Chart (Source: Thomson Reuters)
The Goodyear Tire & Rubber Company
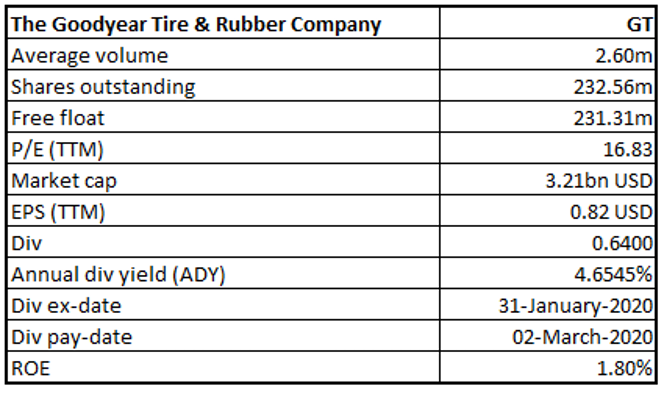
GT Details
Growth within Replacement Tire Segment Key Catalyst:The Goodyear Tire & Rubber Company (NASDAQ: GT) is a leading tire manufacturing company which operates across ~21 countries.
Q3FY19 Operational Highlights for the Period ended 30 September 2019: GT announced its quarterly results, wherein the company reported net sales of $3,802 million as compared to $3,928 million in the previous corresponding period. Revenue were impacted due to unfavorable foreign currency translation and lower third-party chemical sales.The quarter was marked by 3% y-o-y growth in the U.S. Consumer replacement shipments volumes from the Asia Pacific segment increased 5% on a y-o-y basis. The business reported robust growth from Brazil while Europe witnessed an adverse impact from lack of orientation in the distribution channels. Tire unit volumes came in at 40.3 million, down 1% from the previous corresponding period while volume from the original equipment segment declined by 5% on y-o-y basis, on account of lower global vehicle production. The business reported a 1% growth in the replacement tire shipments category during the third quarter of FY19. The business reported 5.4% growth in Asia Pacific at 7.9 million units driven by growth across consumer business across China which was offset by softness in India. Replacement tire volume grew 7.4%, aided by growth in the consumer business in Japan and China.
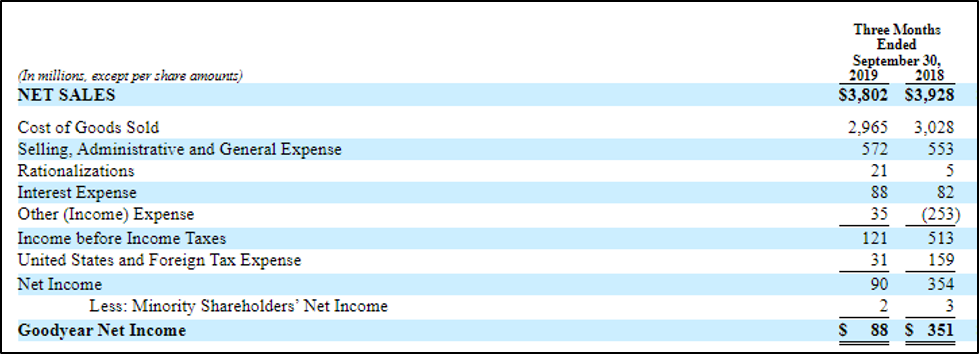
Q3FY19 Income Statement Highlights (Source: Company Reports)
Valuation Methodology: Enterprise Value to EBITDA Multiple Approach
(19).png)
Enterprise Value to EBITDA Based Valuation (Source: Company Reports)
Note: All forecasted figures and peers have been taken from Thomson Reuters, NTM-Next Twelve Months
Stock Recommendation:The stock of GTis quoting at $13.80 with a market capitalization of $3.20 billion. The stock is trading at the lower band of its 52-week trading range of $10.74 to $21.40. The business reported strong growth across the replacement tire segment and improved volumes from China and Brazil. Considering the above factors, we have valued the stock using one relative valuation method, i.e., Enterprise Value to EBITDA based approach. For this, we have taken peers like Sumitomo Rubber Industries Ltd (OTC: SMTUF), Yokohama Rubber Co Ltd (OTC: YORUF), Toyo Tire Corp (OTC: TOTTF) arrived at a target price with lower double-digit upside (in % terms). Hence, we give a “Buy” rating on the stock at the current market price of $13.80, up 0.36% as on 28 January 2020.
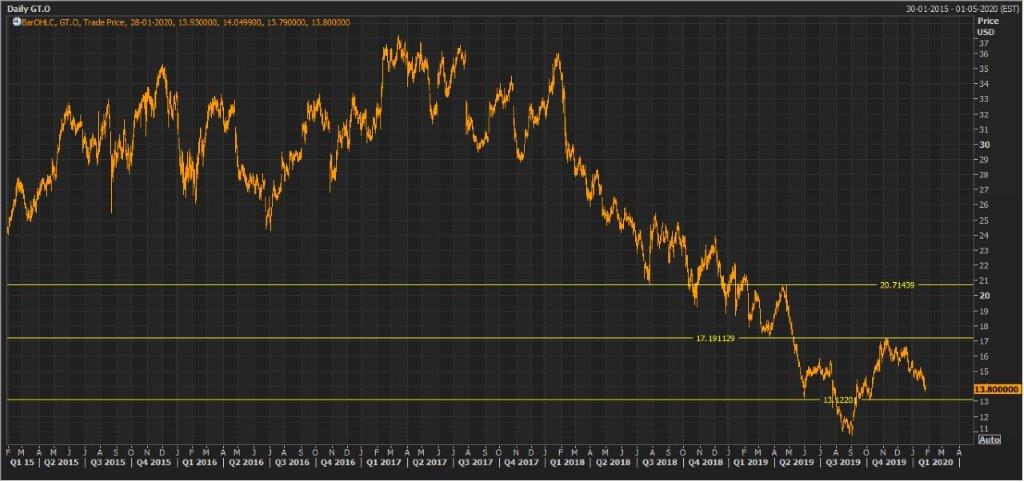
GT Daily Technical Chart (Source: Thomson Reuters)
F5 Networks, Inc.
FFIV Details
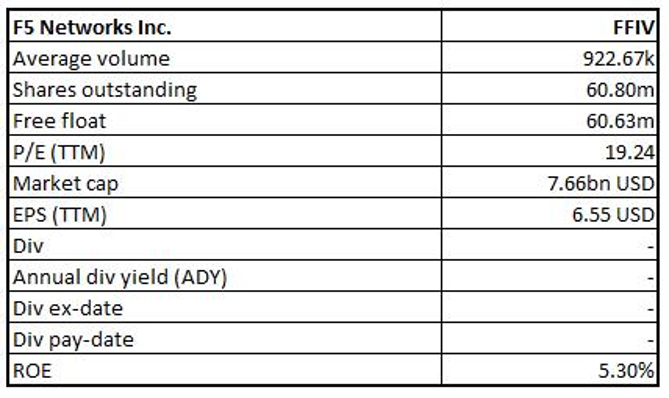
Reported 5% Growth in Total Revenues: F5 Networks, Inc. (NASDAQ: FFIV) is an information technology company that develops powers applications within the multi-cloud environment.
Q1FY20 Operational Highlights for the Period ended 31 December 2019: FFIV declared its quarterly results, wherein the company reported revenue of $569.30 million, up 5% on y-o-y basis, driven by 50% growth in software solutions revenue.The company’s gross profit stood at $480.66 million, up from $457.05 million in the previous corresponding period. The company reported research and development expenses at $96 million, as compared to $92.03 million in Q1FY19. During the quarter, research and development expense as a percentage of total revenue stood at 16.86%. The company reported higher general and administrative expense at $59 million as compared to $42.54 million in the previous corresponding period. The company reported net income of $98.52 million as compared to $130.90 million in Q1FY19 on account of higher sales and marketing expenses and general and administrative expenses.
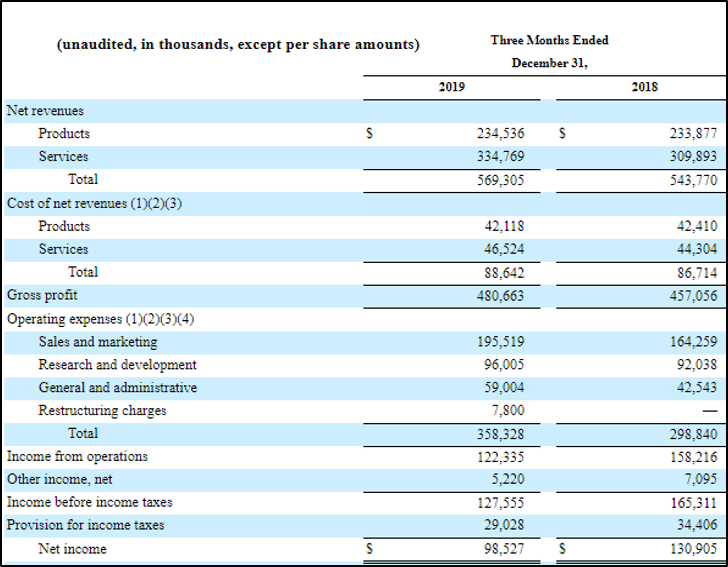
Q1FY20 Income Statement Highlights (Source: Company Reports)
Guidance:On a non-GAAP basis, the company expects its revenue within the range of $580 million to $590 million for the second quarter of FY20. Earnings on a non-GAAP basis is estimated within the range of $2.14 to $2.17 per diluted share.
Valuation Methodology: Price to Earnings Multiple Approach
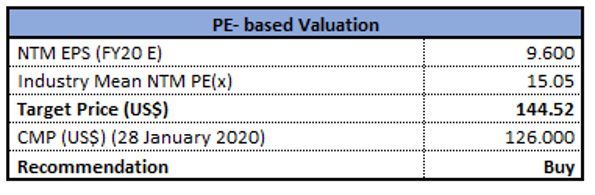
Price to Earnings Based Valuation (Source: Thomson Reuters)
Note: All forecasted figures and peers have been taken from Thomson Reuters, NTM-Next Twelve Months
Stock Recommendation:The stock of FFIV is quoting at $126.00 with a market capitalization of $7.66 billion. The stock is trading at the lower band of its 52-week trading range of $121.36 to $173.44.The company remains on track to offer world-class applications services to its clients with a wider range of distribution and consumption models. During the first quarter, demand from the software solutions and related services and support aided 50% revenue growth in the software segment and 5% growth in the overall revenue. Considering the above factors, we have valued the stock using one relative valuation method, i.e., Price to Earnings multiple based approach. For this, we have taken peers like Cisco Systems Inc (NASDAQ: CSCO), Juniper Networks Inc (NYSE: JNPR) and VMware Inc (NYSE: VMW) and arrived at a target price with higher single-digit upside (in % terms). Hence, we give a “Buy” rating on the stock at the current market price of $126.00, down 5.05% as on 28 January 2020.
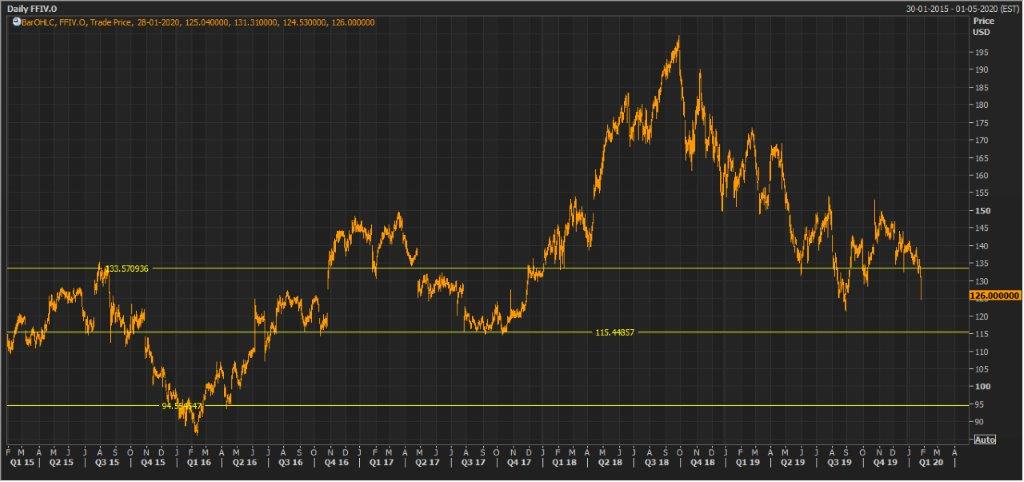
FFIV Daily Technical Chart (Source: Thomson Reuters)
Twitter, Inc.
TWTR Details
Delivered ~23% Growth in Ad Engagements:Twitter, Inc. (NYSE: TWTR) provides a world-wide platform to the public for self-expression and conversation in real-time.
Q3FY19 Operational Highlights for the Period ended 30 September 2019:TWTR announced its quarterly results, wherein, the company reported revenue of $823.71 million, as compared to $758.11 million in the previous corresponding period. Revenues increased on the back of growth in the US segment and better-than-expected advertising seasonality during July and August. Cost of revenue stood at $281.05 million as compared to $243.64 million in Q3FY18. The business reported higher research and development expense of $178.55 million, as compared to $150.764 million in Q3FY18.The quarter was marked by 23% growth in the total ad engagements, aided by the increased ad impressions driven by audience growth and improved clickthrough rates. Sales and marketing expense stood higher at $226.20 million, as compared to $193.49 million in the previous corresponding period. Income from operations stood at $44.145 million, which decreased from $91.86 million, on the back of lower-than-expected revenue and flat investments. Interest income came in at $40.34 million, as compared to $36.06 million in the previous corresponding period. The business reported a total headcount of more than 4,600 employees during the third quarter of FY19.
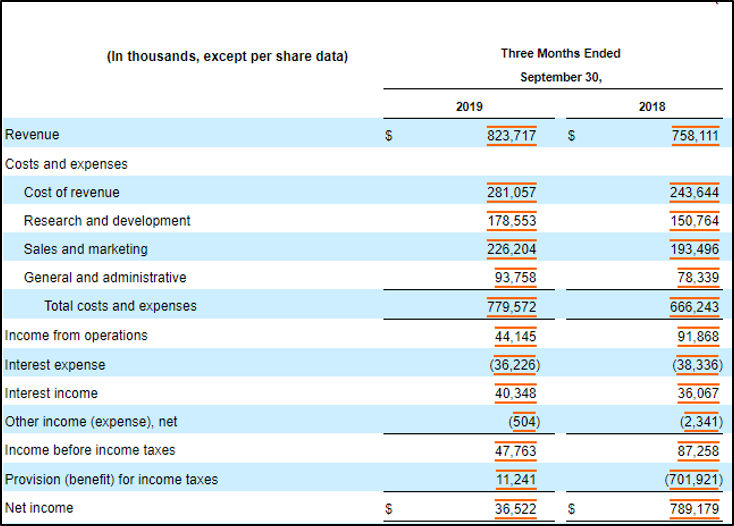
Q3FY19 Income Statement Highlights (Source: Company Reports)
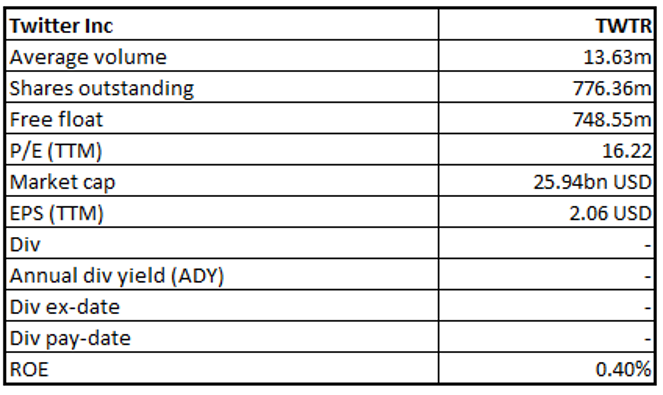
Stock Recommendation:The stock of TWTR is quoting at $33.42 with a market capitalization of $25.94 billion. The stock is trading at the lower band of its 52-week trading range of $28.63 to $45.86.Twitter’s efforts to make the platform more conversational is expected to expand the monetized user base in the near term. Further, continued strong demand for video ad products is a potential tailwind for the company. The stock is available at a price to earnings multiple of 13.9x on its trailing twelve months basis (TTM) as compared to the industry average (Software & IT Services) of 19.7x. Considering the trading levels, business prospects and valuation we recommend a “Buy” rating on the stock at the current market price of $33.42, up 1.95% as on 28 January 2020.
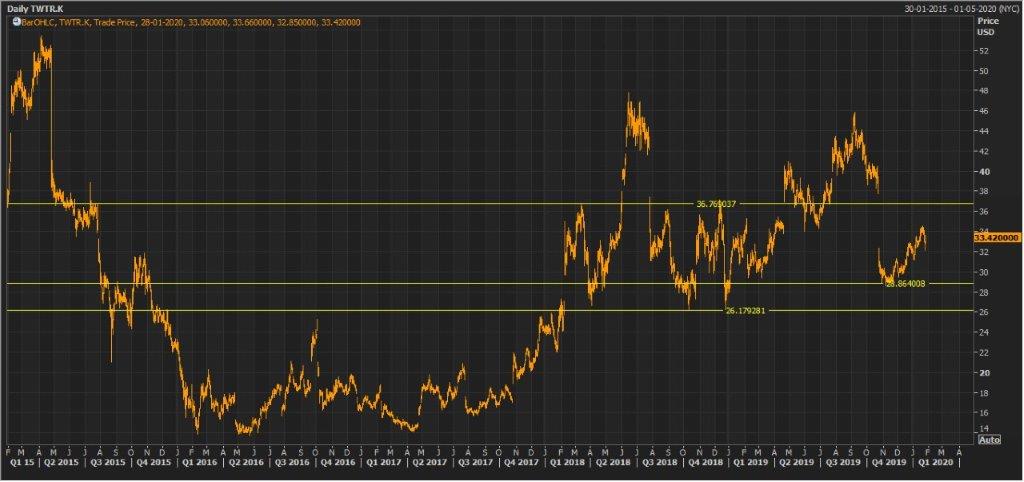
TWTR Daily Technical Chart (Source: Thomson Reuters)
Disclaimer
The advice given by Kalkine Pty Ltd and provided on this website is general information only and it does not take into account your investment objectives, financial situation or needs. You should therefore consider whether the advice is appropriate to your investment objectives, financial situation and needs before acting upon it. You should seek advice from a financial adviser, stockbroker or other professional (including taxation and legal advice) as necessary before acting on any advice. Not all investments are appropriate for all people. Kalkine.com.au and associated pages are published by Kalkine Pty Ltd ABN 34 154 808 312 (Australian Financial Services License Number 425376). The information on this website has been prepared from a wide variety of sources, which Kalkine Pty Ltd, to the best of its knowledge and belief, considers accurate. You should make your own enquiries about any investments and we strongly suggest you seek advice before acting upon any recommendation. Kalkine Pty Ltd has made every effort to ensure the reliability of information contained in its newsletters and websites. All information represents our views at the date of publication and may change without notice. To the extent permitted by law, Kalkine Pty Ltd excludes all liability for any loss or damage arising from the use of this website and any information published (including any indirect or consequential loss, any data loss or data corruption). If the law prohibits this exclusion, Kalkine Pty Ltd hereby limits its liability, to the extent permitted by law to the resupply of services. There may be a product disclosure statement or other offer document for the securities and financial products we write about in Kalkine Reports. You should obtain a copy of the product disclosure statement or offer document before making any decision about whether to acquire the security or product. The link to our Terms & Conditions has been provided please go through them and also have a read of the Financial Services Guide. On the date of publishing this report (mentioned on the website), employees and/or associates of Kalkine Pty Ltd do not hold positions in any of the stocks covered on the website. These stocks can change any time and readers of the reports should not consider these stocks as advice or recommendations.
 AU
AU

 Please wait processing your request...