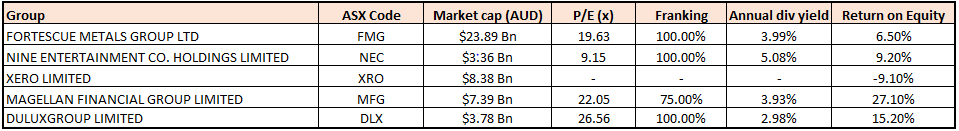
Stocks’ Details
Fortescue Metals Group Limited
Stock Appreciated ~103% in Last 6-months: Fortescue Metals Group Limited (ASX: FMG) is engaged in the exploration, development, production, processing and sale of iron ore. The company has recently announced a fully franked special dividend of A$0.6000 per share. For the purpose, ex-date was May 22, 2019 and the payment date is June 14, 2019.
Fortescue recently updated about the development of the Queens Valley mining area (Queens) at its Solomon Hub in the Pilbara region of Western Australia. Overall capex for the development of Queens is projected to be US$287 mn, of which US$10 million, US$151 million, US$98 million and US$28 million will be incurred during FY19, FY20, FY21 and FY22, respectively.
March 2019 Quarterly Production Results: The company reported total shipments of 38.3 million tonnes (mt) and cash production costs (C1) of US$13.51 per wet metric tonne (wmt). The Total Recordable Injury Frequency Rate (TRIFR) of 3.6 witnessed an improvement of 10% as compared to 4.0 in December quarter. The average strip ratio came in at 1.4 in Q3FY19 which was in-line with the prior comparable quarter.
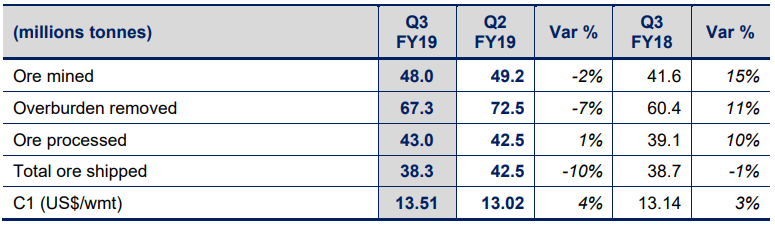
Production Summary (Source: Company Reports)
Outlook:For FY19, the management expects 165-170 mt shipments, which include 8-10 mt from West Pilbara Fines product. C1 costs are likely to be in the range of US$13-13.50 per wmt with an average strip ratio at 1.5. Total capex is expected at US$1.2 bn, including FMG’s share of the Iron Bridge Magnetite Project for FY19. Depreciation and amortisation related expenditure are expected to be US$7.10/wmt.
Stock Recommendation: At the current market price of $7.810, the stock is available at price to earnings multiple of 19.630x with a dividend yield of 3.99%. The stock is trading towards its 52-week high price of $8.720. With key strategic focus to strengthen the balance sheet, long-term sustainability, growth and development options, the company is poised to sustain its position in the market, going forward. Hence, considering the progressive business coupled with the optimistic outlook, we give a “Hold” recommendation on the stock at the current market price of $7.810 per share (up 0.644% on 04 June 2019).
Nine Entertainment Co. Holdings Limited
Signed an Agreement to Exit ACM Business: Nine Entertainment Co. Holdings Limited (ASX: NEC) is engaged in the television broadcasting and program production. Also, operates in digital, internet, subscription video, and other media segments. The company recently informed that National Australia Bank Limited and its associated entities became a substantial holder of the group with voting rights of 5.112% since 30 May 2019.
The company updated recently about signing an agreement for the sale of ACM business (Australian Community Media and Printing) which is likely to be completed by 30 June 2019. The expected transaction value of approximately $115 million, which is subject to post-completion adjustments, of which $10 million will be paid in 12 months. Exit from ACM business is aligned with the strategy to focus on Nine’s portfolio of high-growth, digital assets.
3QFY19 Trading Update: Q3FY19 FTA (Free to Air) revenue for Broadcasting was up 4%.FTA market remained soft during the quarter while Nine’s share continued to grow. For Digital & Publishing, Metro Publishing revenue posted 3% growth, in both print and digital advertising (total ad revenue +12%). 9Now revenue saw a growth of 75% in Q3FY19. Stan continues to grow in terms of subscribers.
Outlook:The Management expects Stan to report a positive EBITDA contribution in Q4 FY19. FY19 FTA costs are likely to be down by 4% with further cost reductions expected in FY20 and beyond. The company aims to at least hold broadcast profitability in FY19, ex the impact of the extra week. The Management expects to report FY19 Pro Forma Group EBITDA on a continuing business basis of minimum $420 million, which is equal to the growth of minimum 10% on FY18 like-basis result of $385 million. The Management expects the positive momentum to be continued at the Group level in FY20.
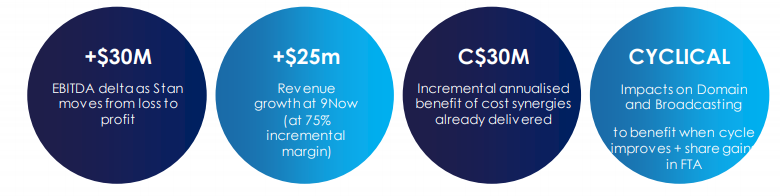
Four Key Drivers in FY20 (Source: Company Reports)
Stock Recommendation:At the current market price of $1.940, the stock is trading at the price to earnings multiple of 9.150x. Annual dividend yield for the stock stands at 5.08% with a market capitalization of $3.36 billion. The stock has gained ~11.30% in last 6-months. Hence, considering the decent fundamentals, business growth, and outlook, we give a “Buy” recommendation on the stock at the current market price of $1.940 per share (down 1.523% on 04 June 2019).
Xero Limited
Overall FY19 Witness Losses Despite 2H19 Posted Profits: Xero Limited (ASX: XRO) provides an online business platform to small businesses and their advisors. The company recently informed about 30,931 Ordinary Shares issued on vesting of restricted stock units (RSUs).
FY19 Results Highlights: The company reported FY19 (Full Year to 31 March 2019) earnings and delivered strong progress in revenue growth, cash generation and profitability. Operating revenue posted a growth of 36% to $552.8 million (34% in constant currency). Annualised Monthly Recurring Revenue (AMRR) grew by 32% to $638.2 million. Total subscribers witnessed a growth of 31% to 1.818 million with International net subscriber additions (239,000) exceeding those from ANZ (193,000). Free cash flow for the company grew by $35.0 million as compared to the previous year to $6.5 million. The company incurred net loss for FY19 which came in at $27.1 million, primarily on the back of impairments in 1H19, with a net profit of $1.4 million experienced during 2H19.
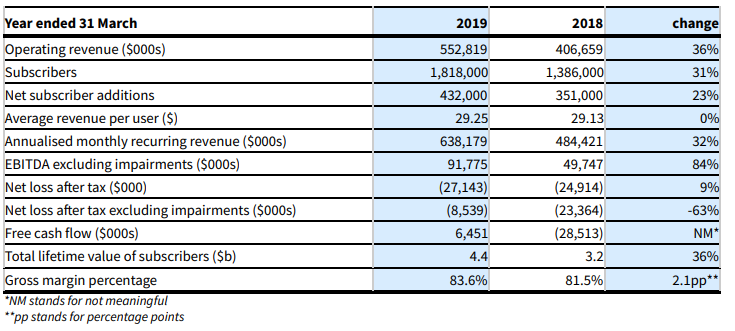
Financial highlights (Source: Company Reports)
Outlook: The Management is likely to continue its focus on growing its global small business platform along with reinvesting the cash generated. The management expects FY20 Free cash flow to be in-line with the proportion of total operating revenue reported in FY19.
Stock Recommendation: The stock gained 45.28% in the last 6-months and 41.72% on a YTD basis. The stock is currently trading slightly towards its 52-week high price of $62.110. The 2H19 results entered the positive territory, however, the FY19 results remained in losses. The EBITDA and net margins at 16.5% and -4.9%, respectively for the company have remained below the industry median of 25.7% and 15.9%, respectively. Based on the foregoing and looking at current trading level, we give an “Expensive” recommendation on the stock at the current market price of $57.380 per share (down 3.482% on 04 June 2019).
Magellan Financial Group
Total FUM Grew By ~5%: Magellan Financial Group (ASX: MFG) is engaged into fund management for high net worth and retail investors in Australia and New Zealand, and institutional investors globally. The company recently announced that it has appointed Mr Hamish McLennan as Deputy Chairman of Magellan, and Mr Robert Fraser as Chairman of Magellan Asset Management Limited w.e.f. 5 June 2019. The company recently announced that it has become an initial substantial holder of Spark Infrastructure Group with voting rights of 5.06% since 6 May 2019.
Funds Under Management (FUM) Update: The company released the FUM as at 30 April 2019. According to that, the total FUM for the company stood at A$83,232 million as at 30 April 2019 as compared to A$79,442 million, an increase of A$3,790 million or 4.77% as compared to March 2019.Global equities came in at A$62380 million, Infrastructure equities stood at A$13,528 million and Australian Equities was at A$7,324 million as at 30 April 2019. Global equities and Infrastructure equities comprised of ~75% and ~16%, respectively of the total FUM. Additionally, Australian equities accounted for 8.8% of the total FUM.
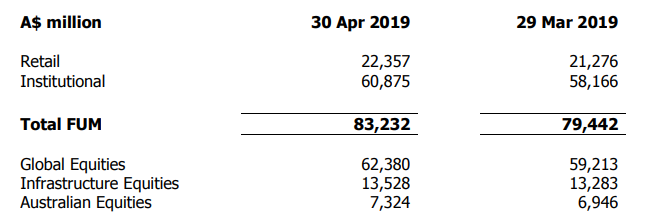
FUM as at 30 April 2019 (Source: Company Reports)
Stock Recommendation: On the valuation front, the P/BV of 13.8x and P/E of 22.05x is currently above the industry median multiples of 4.1x and 11.8x respectively, indicating the stock to be overvalued. Looking at the price performance, the stock has gained ~52% in the last 6-months. While in the past three months, it has witnessed a rise of 16.41%. As a result, it looks like these increases have pushed the stock towards the 52-week higher levels. Having said that we are of the view that the valuations do not support the current level of the stock. Hence, considering the aforesaid parameters and current trading level, we give an “Expensive” recommendation on the stock at the current market price of $42.020 per share (up 0.743% on 04 June 2019).
DuluxGroup Limited
1HFY19 Key Financial Highlights: DuluxGroup Limited (ASX: DLX) markets and manufactures premium branded paint, coatings, adhesives, garden care and other building products for residential, commercial and infrastructure markets.
The company’s half-yearly results for FY19 were consistent with the guidance of FY18. The NPAT (Net Profit After Tax) for the period amounted to $68.2 million, down 4.1% as compared to prior year adjusted NPAT.Revenue for the period amounted to $889.8 million, up 0.2% as compared to previous corresponding period excluding the divested and exited paints businesses in China. Reported Earnings before interest and tax were $109.1 million, up 0.5% as compared to the previous year adjusted EBIT.
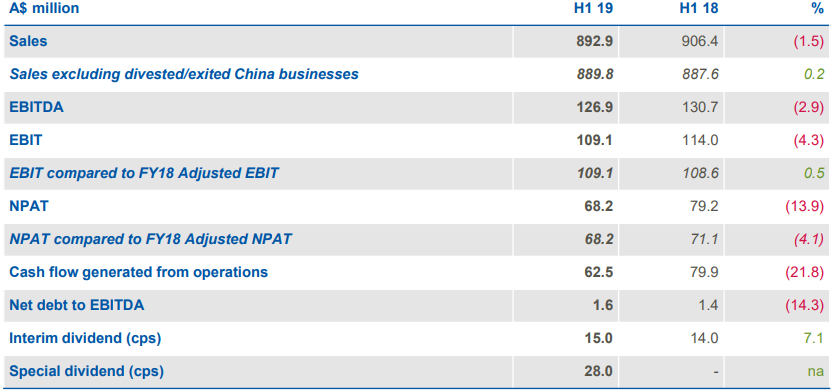
Half year results summary (Source: Company Presentation)
Outlook: As the market indicators for Dulux’s key markets remain positive, the company expects the Net Profit for FY19 to be higher as compared to FY18 equivalent of $150.7 million. The Existing Home segment is expected to provide profitable growth in the future. Commercial & Engineering markets also expected to remain stable. The New Housing segment is expected to remain around FY18 levels.
Stock Performance: The company’s stock yielded returns of 29.77% and 40.67% over a period of 3 months and 6 months, respectively leading the stock to trade closer to its 52-week high price of $9.870. Hence, we presume that all positive developments have been discounted at the current juncture. Based on the foregoing, we give an “Expensive” rating on the stock at the current market price of $9.720 per share.
.PNG)
Comparative Price Chart (Source: Thomson Reuters)
Disclaimer
The advice given by Kalkine Pty Ltd and provided on this website is general information only and it does not take into account your investment objectives, financial situation or needs. You should therefore consider whether the advice is appropriate to your investment objectives, financial situation and needs before acting upon it. You should seek advice from a financial adviser, stockbroker or other professional (including taxation and legal advice) as necessary before acting on any advice. Not all investments are appropriate for all people. Kalkine.com.au and associated pages are published by Kalkine Pty Ltd ABN 34 154 808 312 (Australian Financial Services License Number 425376). The information on this website has been prepared from a wide variety of sources, which Kalkine Pty Ltd, to the best of its knowledge and belief, considers accurate. You should make your own enquiries about any investments and we strongly suggest you seek advice before acting upon any recommendation. Kalkine Pty Ltd has made every effort to ensure the reliability of information contained in its newsletters and websites. All information represents our views at the date of publication and may change without notice. To the extent permitted by law, Kalkine Pty Ltd excludes all liability for any loss or damage arising from the use of this website and any information published (including any indirect or consequential loss, any data loss or data corruption). If the law prohibits this exclusion, Kalkine Pty Ltd hereby limits its liability, to the extent permitted by law to the resupply of services. There may be a product disclosure statement or other offer document for the securities and financial products we write about in Kalkine Reports. You should obtain a copy of the product disclosure statement or offer document before making any decision about whether to acquire the security or product. The link to our Terms & Conditions has been provided please go through them and also have a read of the Financial Services Guide. On the date of publishing this report (mentioned on the website), employees and/or associates of Kalkine Pty Ltd do not hold positions in any of the stocks covered on the website. These stocks can change any time and readers of the reports should not consider these stocks as advice or recommendations.
 AU
AU
 Please wait processing your request...