.png)
Stocks’ Details
Harvey Norman Holdings Limited
PBT up 8.4% Year Over Year: Harvey Norman Holdings Limited (ASX: HVN) is an Australia based company with principal activities of property, digital enterprise, integrated retail and franchise. The company reported PBT of $574.56 million in FY19, up 8.4% on a year over year basis. In FY19, net Assets amounted to $3.2 billion, an increase of 8.8% year over year. Earnings per share for the period increased by 4.5% and came in at 34.70 cents. Cash flow from operations for FY19 was $372.85 million, as compared to $454.17 million in FY18.
.png)
PBT Highlight (Source: Company Reports)
Dividend Highlights: The company declared a fully franked final dividend of 21 cents per share, paid on 1st November 2019, taking thetotal dividend to 33 cents per share for the year ended 30 June 2019, representing 96.77% of the profit after tax and non-controlling interests. There were higher dividend payments during FY19, which totalled to $342.12 million, against $267.34 million dividend paid in FY18.
Valuation Methodology: P/E Multiple Approach
.png)
P/E Based Valuation (Source: Thomson Reuters)
Note: All forecasted figures and peers have been taken from Thomson Reuters, NTM-Next Twelve Months
Stock Recommendation: As per ASX, the stock is trading near to its 52 weeks high price of $4.667. The stock gave a return of 30.77% in the past one year. The stock has a market cap of $5.31 billion with an annual dividend yield of 7.75% and a P/E multiple of 12.28x, depicting a decent opportunity for accumulation. Notably, its quick ratio and current ratio stood at 1.18x and 1.62x in FY19, as compared to the industry median 0.97x and 1.42x, respectively. We have valued the stock using one relative valuation method, i.e., Price to Earnings Multiple. For the purpose, we have taken the peer group – Metcash Ltd (ASX: MTS), Coles Group Ltd(ASX: COL), Super Retail Group Ltd(ASX: SUL), etc., and arrived at a correction of lower single-digit (in % terms). Considering the above factors, we have a watch stance on the stock at the current market price of $4.51 per share, up 5.869% on 4th February 2020.
Stockland Corporation Limited
Improving Market Condition & Strategic Execution Key Catalysts: Stockland Corporation Limited (ASX: SGP) is an owner, developer and manager of real estate assets in Australia. On 3rd February 2020, the company stated that Robyn Elliott, a Chief Innovation, Marketing and Technology Officer of the company, has stepped down, effective from February end this year.
1QFY20 Key Highlights for the Period Ended 30 September 2019: During the quarter, net deposit from residential by state stood at 1,149, up from 846 reported in the previous quarter, reflecting improving market conditions. Net reservation for the period came in at 215.
.png)
Net deposit for 1QFY20 (Source: Company Reports)
What to Expect: For FY20, the company remains on track to focus of execution of its strategies. The group is targeting funds from operations (FFO) per security to be flat for FY20.Under residential segment, the operating profit margin is expected to be around 19% for the full year. Under retirement living, the company focuses on driving efficiency and enhancing returns in the portfolio. Under commercial property, the comparable FFO growth is expected to be ~1%.
Valuation Methodology: P/E Multiple Approach
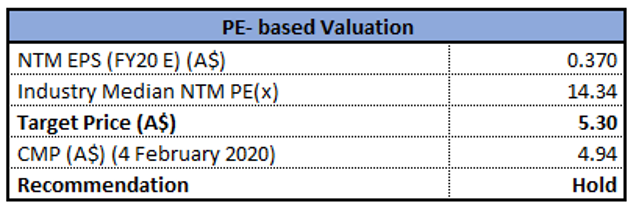
P/E Based Valuation (Source: Thomson Reuters)
Note: All forecasted figures and peers have been taken from Thomson Reuters, NTM-Next Twelve Months
Stock Recommendation: As per ASX, the stock is trading near to its 52-week high price of $5.24. The stock gave a return of 29.97% in the past one year. The stock has a market cap of $11.68 billion with an annual dividend yield of 5.63% and a P/E multiple of 37.69x, depicting a decent opportunity for accumulation. Considering the returns, trading levels, higher gross margin and ROE, and decent growth opportunities, we have valued the stock using one relative valuation method, i.e., Price to Earnings Multiple. For the purpose, we have taken the peer group – Scentre Group (ASX: SCG), Vicinity Centres (ASX: VCX), Charter Hall Retail REIT (ASX: CQR), etc., and arrived at a target price offering higher single-digit upside (in % terms). Hence, we recommend a “Hold” rating on the stock at the current market price of $4.940, up by 0.816% on 4th February 2020.
Domino's Pizza Enterprises Limited
DMP legal Proceeding Update: Domino's Pizza Enterprises Limited (ASX: DMP) is a food retailer that operates a pizza chain, including franchisee-owned, along with company-owned corporate stores. As on 4 February 2020, the market capitalization of the company stood at $4.66 billion. Recently, DMP announced that the Cour de Cassation, one of the courts in France, has provided its verdict in an appeal by Speed Rabbit Pizza (SRP) in favour of Domino's Pizza France (DPF) and has held SRP liable for disparaging DPF and ordered it to pay DPF €500,000 pertaining to damages.
Revenues up 24.4% Year Over Year: The company delivered revenue of $1,435 million in FY19, up 24.4% year over year. In the same time span, NPAT (Net Profit After Tax) stood at $141.2 million, up 6.1%. This led the EPS to rise by 8% to 165 cents per share.
EPS Highlights for FY19 (Source: Company Reports)
Outlook: The company expects same-store growth between 3% to 6% in the next 3-5 years. It also expects an increase in annual net capex in the range of $60 million to $100 million, primarily due to increased investment in corporate and franchise stores. Revenue is expected to increase by roughly $260m - $300m in ANZ for FY20.
Stock Recommendation: As per ASX, the stock of DMP gave a return of 45.18% in the past 6 months and a return of over 15.21% in the last one year. The stock of DMP is trading close to its 52-weeks’ high level of $57.89. The stock has an annual dividend yield of 2.14% and a P/E multiple of 39.87x, depicting a decent opportunity for accumulation. During FY19, gross margin of the company stood at 63.7%, higher than the industry median of 51.8% and Return on Equity was 35.5% as compared to the industry median of 11.5%. On the valuation front, the stock is trading at EV to EBITDA multiple of 16.9x as compared to the industry average of 7.7x on TTM (Trailing Twelve Months) basis. Hence, we give an “Expensive” rating on the stock at the current market price of $55.04, up by 1.888% on February 4, 2020.
The a2 Milk Company Limited
Revenues up by 41% Year Over Year: The a2 Milk Company Limited (ASX: A2M) is a premium branded dairy nutritional company, which focuses on products containing A2 beta-casein protein type. On 28 January 2020, the company stated that Morgan Stanley and its Subsidiaries, a substantial holder of the company, have reduced its voting power from 5.012% to 4.985%.
Leadership Changes: The a2 Milk Company Limited has announced that the Chief Financial Officer of the company, Craig Louttit, had agreed to resign from its current position. Effective from 13th January 2020, the company appointed Race Strauss as the new CFO. Meanwhile, Craig will continue in the role of Deputy Chief Financial Officer of the company.
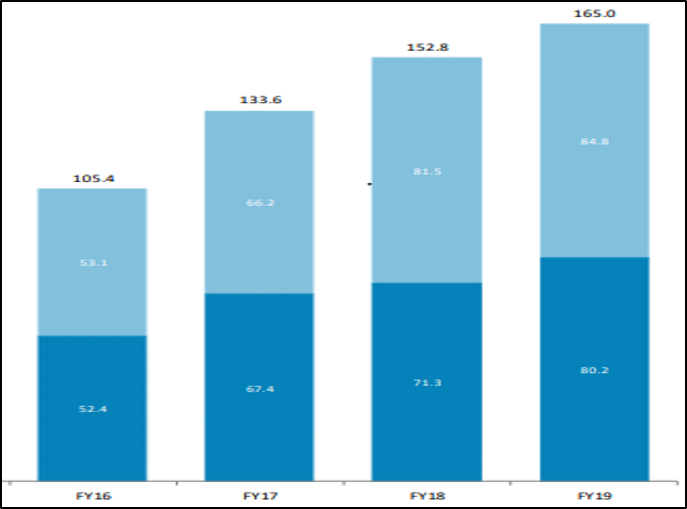
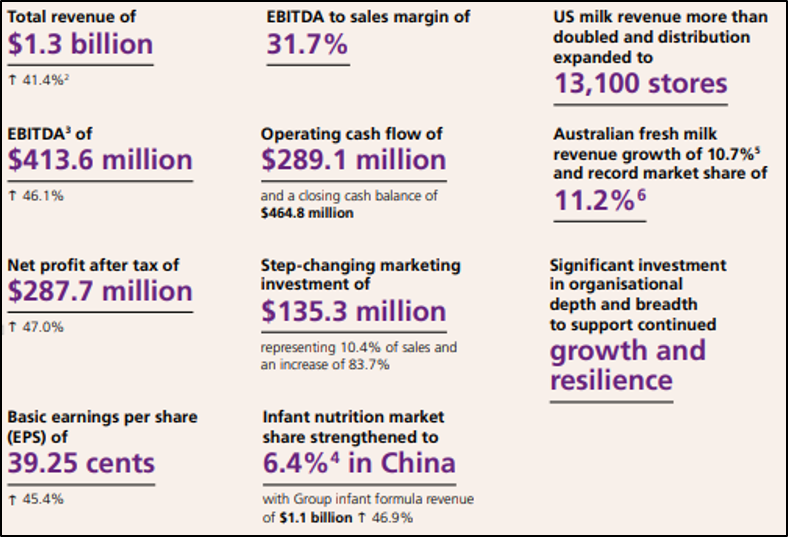
FY19 Key Financial Highlights: During FY19, the revenue of the company came in at NZ$1.3 billion, an increase of 41% on a year over year basis. During the same time span, EBITDA of the company went up by 46.1% to NZ$413.6 million. This resulted basic earnings per share to increase to 39.25 cents, up from 27 cents per share.
Financial Performance (Source: Company Reports)
Outlook:The company expects a stronger full-year EBITDA margin and to remain consistent with 2HFY19.
Valuation Methodology: P/E Multiple Approach
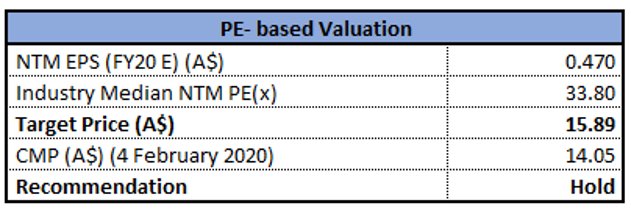
P/E Based Valuation (Source: Thomson Reuters)
Note: All forecasted figures and peers have been taken from Thomson Reuters, NTM-Next Twelve Months
Stock Recommendation: As per ASX, the stock of A2M gave a return of over 17.12% in the last one year. As on February 4, 2020, the market capitalisation of the company stood at $10.42 billion with a P/E multiple of 37.74x. During FY19, gross margin of the company stood at 54.7%, higher than the industry median of 39.5% and Return on Equity was 42.8% as compared to the industry median of 12.9%. Considering the returns, trading levels, high ROE, we have valued the stock using P/E multiple based relative valuation method and arrived at an upside of lower double-digit (in percentage terms). Hence, we have a “Hold” rating on the stock at the current market price of $14.05, down by 0.777% on February 4, 2020.
Webjet Limited
EBITDA Margin Witness Growth Year Over Year: Webjet Limited (ASX: WEB) is engaged in providing a wide range of online travel booking services for flights, hotels, car hire, tours, etc. On 4 February 2020, the company announced the issue of 1,323,799options at a consideration of $14.33 per share.
Shareholding Update: On 31 January 2020, the company stated that Commonwealth Bank of Australia ACN and its related bodies corporate, a substantial holder of the company, have increased its voting power from 0.53% to 0.56%. In another update, WEB announced that Mitsubishi UFJ Financial Group, Inc. has made a change to its substantial holding in the company on 17th January 2020 and the current voting power stands at 10.28% as compared to the previous voting power of 9.05%.
Other Recent Updates:In another update, WEB stated that it has extended the term of Managing Director, John Guscic and provided changes to his service contract. The contract has been extended to 30 June 2023, from 30 June 2021 earlier. The below picture provides a summary of EBITDA margin for FY17-FY19:
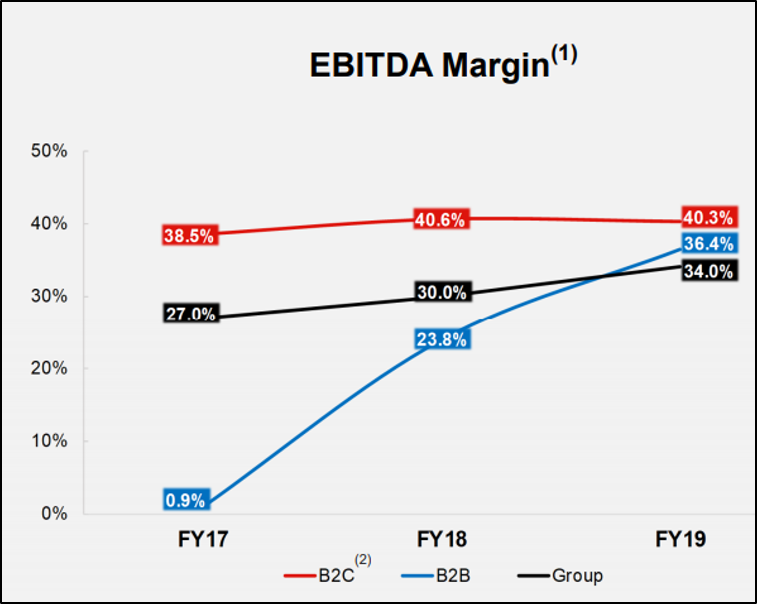
EBITDA Margin (Source: Company Reports)
Valuation Methodology: P/E Multiple Approach
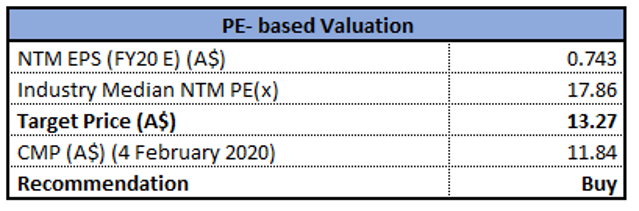
P/E Based Valuation (Source: Thomson Reuters)
Note: All forecasted figures have been taken from Thomson Reuters, NTM: Next Twelve Months
Stock Recommendation: As per ASX, the stock is trading below the average of its 52-week low-high of $9.98 and $17.19, respectively. The stock has a market cap of $1.57 billion with an annual dividend yield of 1.9% and a P/E multiple of 24.62x, depicting a decent opportunity for accumulation. Considering the trading levels and decent growth opportunities, we have valued the stock using Price to Earnings Multiple based relative valuation method. For the purpose, we have taken the peer group – Midway Ltd (ASX: MWY), Sealink Travel Group Ltd (ASX: SLK), ARB Corp Ltd (ASX: ARB), and arrived at a target price offering lower double-digit upside (in % terms). Hence, we give a “Buy” recommendation on the stock at the current market price of $11.84 per share, up by 2.334% on 4 February 2020.
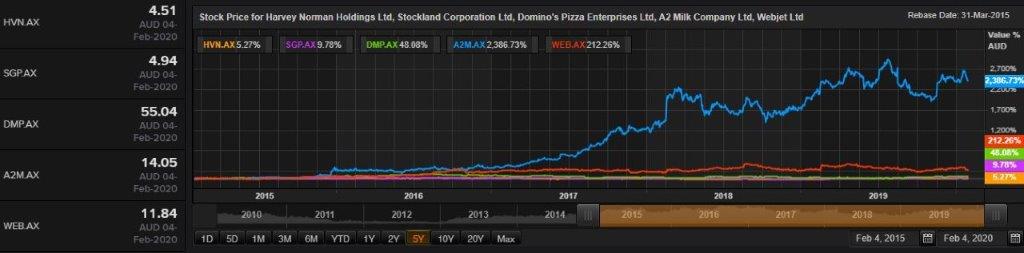
Comparative Price Chart (Source: Thomson Reuters)
Disclaimer
The advice given by Kalkine Pty Ltd and provided on this website is general information only and it does not take into account your investment objectives, financial situation or needs. You should therefore consider whether the advice is appropriate to your investment objectives, financial situation and needs before acting upon it. You should seek advice from a financial adviser, stockbroker or other professional (including taxation and legal advice) as necessary before acting on any advice. Not all investments are appropriate for all people. Kalkine.com.au and associated pages are published by Kalkine Pty Ltd ABN 34 154 808 312 (Australian Financial Services License Number 425376). The information on this website has been prepared from a wide variety of sources, which Kalkine Pty Ltd, to the best of its knowledge and belief, considers accurate. You should make your own enquiries about any investments and we strongly suggest you seek advice before acting upon any recommendation. Kalkine Pty Ltd has made every effort to ensure the reliability of information contained in its newsletters and websites. All information represents our views at the date of publication and may change without notice. To the extent permitted by law, Kalkine Pty Ltd excludes all liability for any loss or damage arising from the use of this website and any information published (including any indirect or consequential loss, any data loss or data corruption). If the law prohibits this exclusion, Kalkine Pty Ltd hereby limits its liability, to the extent permitted by law to the resupply of services. There may be a product disclosure statement or other offer document for the securities and financial products we write about in Kalkine Reports. You should obtain a copy of the product disclosure statement or offer document before making any decision about whether to acquire the security or product. The link to our Terms & Conditions has been provided please go through them and also have a read of the Financial Services Guide. On the date of publishing this report (mentioned on the website), employees and/or associates of Kalkine Pty Ltd do not hold positions in any of the stocks covered on the website. These stocks can change any time and readers of the reports should not consider these stocks as advice or recommendations.
 AU
AU

 Please wait processing your request...