Woolworths Group
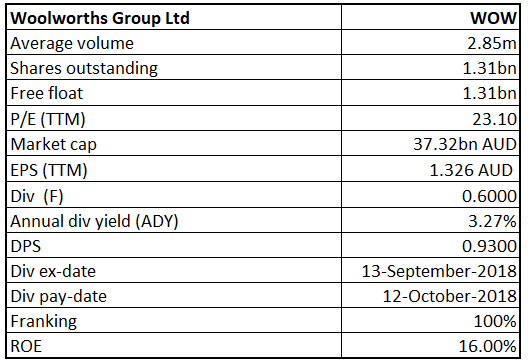
WOW Details
Short-term pain but decent outlook ahead: Woolworths Group Limited’s (ASX: WOW) stock tumbled 3.237 percent on September 13, 2018 as the stock traded ex-dividend. This also follows the release of class action filed by Maurice Blackburn Lawyers and International Litigation funding partners against WOW which alleges that the company has affected its competitiveness by issuing its profit guidance which was misleading.According to the Maurice Blackburn, the action has been started on behalf of aggrieved Woolworths investors who purchased Woolworths shares between 29 August 2014 and 6 May 2015 and suffered losses following the announcement by Woolworths on 27 February 2015 that its sales and profit growth would be below the guidance that had previously been given, and reaffirmed, and the revelation on 6 May 2015 that it had been using the wrong metrics in relation to price competitiveness and stock availability in the second half of 2014 and until January 2015. According to Woolworths on 24th January 2018, IMF Bentham announced that the class action did not meet the investment criteria due to which IMF Bentham is not proceeding further and after that Woolworths has not received any further correspondence from Maurie Blackburn till the recent news release. However, Woolworths affirmed that they are fully prepared for the defence.
On the other hand, the group posted decent FY18 results with total revenue from continuing operation coming in 3.4% higher at $ 56,726 Mn compared to the prior year. Net profit attributable to equity holders increased by 12.9% and amounted to $ 1,605 Mn in FY 18. Based on decent performance, the Board of Directors has declared a fully franked final ordinary dividend of 50 cents per share (cps) and a special dividend of 10 cps, bringing the total dividend of 60 cents per share and it will be payable on October 12, 2018 with the record date of September 14, 2018. This summarized a total dividend payment of 103 cents per share for the full year, representing 22.6% rise over the previous year.
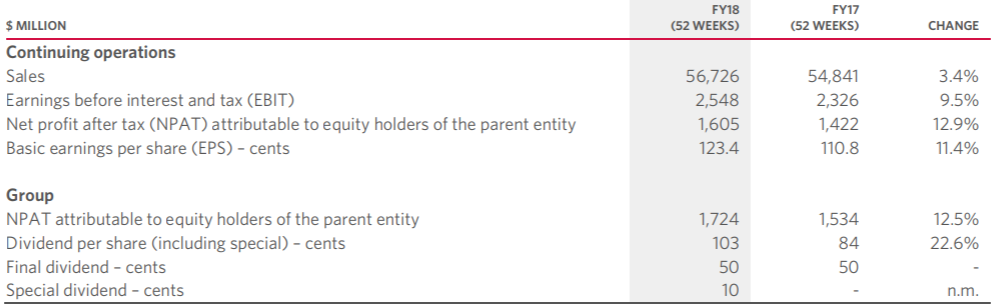
FY18 Financial Highlights (Source: Company Reports)
Meanwhile, the stock has risen 6.72 percent in the past six months as at September 12, 2018 and traded at reasonable PE of 21.43x. Based on foregoing, we maintain our “Hold” recommendation on the stock at the current market price of $ 27.50.
.png)
WOW Daily Chart (Source: Thomson Reuters)
Transurban Group
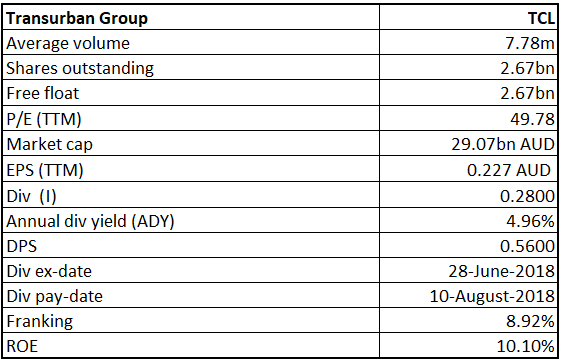
TCL Details
Distribution Guidance for FY19: Transurban Group (ASX: TCL) had a good year FY18 with higher toll revenue and Net profit attributable to the shareholders. The company recorded the profit after tax of $468 Mn, an increase of 124% over the prior year. Toll revenue growth grew by 8.0 percent to $2,249 Mn in FY18 as compared to the prior year. It was mainly driven by the strong traffic growth and an increase in toll price during the period. Resultantly, revenue increased by 8.7 per cent and amounted to $3,298 Mn in FY18 compared to the previous year. EBITDA stood at $1,649 Mn in FY18 against the prior year, exhibiting significant growth on Y-o-Y basis while EBITDA margin contracted by 585 bps and recorded 50% in FY18 against 55.9% in FY17. EBITDA margin was mainly impacted by the higher construction cost incurred during the year. Free cash per security also decreased by 4.7% to 56.8 cents in FY18 from 59.6 cents in FY17. On the other hand, the company expects FY19 guidance of distribution to be 59.0 cents per security, representing 5.4 per cent as compared to FY18 distribution. Further, the company aims to provide value to its shareholders through distributions and targets distribution of approximately 100% of free cash flow over time.
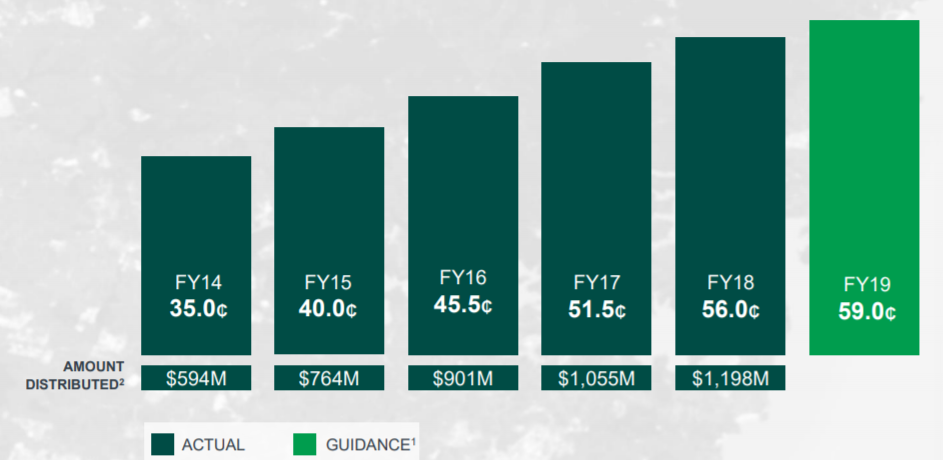
Distribution Growth (Source: Company Reports)
Meanwhile, the share price has fallen 3.13% in the past three months as at September 12, 2018 and traded over 52-week lower level of $10.799. Hence, we give a “Buy” recommendation on the stock at the current market price of $11.120, considering the aforesaid facts.
.png)
TCL Daily Chart (Source: Thomson Reuters)
Technology One
TNE Details
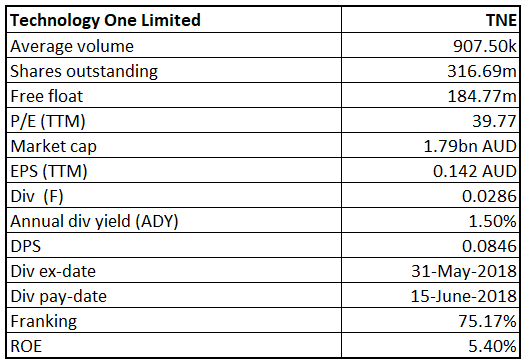
Adopting IFRS GAAP:Technology One Limited (ASX: TNE) is a mid-cap company with the market capitalization of circa $1.79 Bn as of September 13, 2018. The company has recently provided guidance on their accounts post-IFRS15 implementation. With implementation of IFRS GAAP, there would be a minimum impact on NPAT, however, cash would remain unchanged in FY19E. On the analysis front, the company has maintained its RoE of 5.4% in 1HFY18 which is less than the industry average of 7.2x. However, TNE has decent liquidity with current ratio of 1.82x compared to the industry mean of 1.75x. As of now, the group is focusing on improving its margin through controlled R&D growth and product maturity. The group expects NPAT growth of 10% to 15% for the full year.
Moreover, one of its substantial holders, Pinnacle Invesetment Management Group Limited, changed its holding from 12.35% of interest to 11.26% of voting power. Based on foregoing, we maintain our “Hold” recommendation on the stock at the current market price of $5.600.
.png)
TNE Daily Chart (Source: Thomson Reuters)
Redbubble
RBL Details
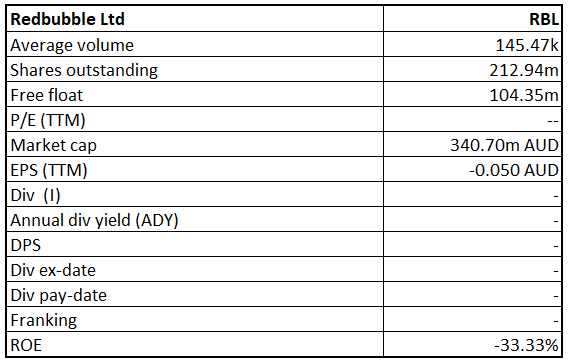
Consistent Growth in Customers, Artists and Fulfilments: Redbubble Limited (ASX: RBL) is the world’s largest online marketplace for independent artists, bringing more creativity into the world. The group generated revenue by deducting tax and the artist margin from gross Transaction value (GTV). Over the five years, the company has achieved multiple growth of 3.9x, 4.8x, and 5.6x in unique customers, selling artists, and product/ fulfillment capability, respectively. Moreover, it has a presence in more than 200 countries, serving over 4 million customers across all business segments. We believe that the company will continue to expand its global presence with the support of strengthening its artist relationships and content partnerships, and continuous strategic investments in data science, mobile, marketing, and operations.
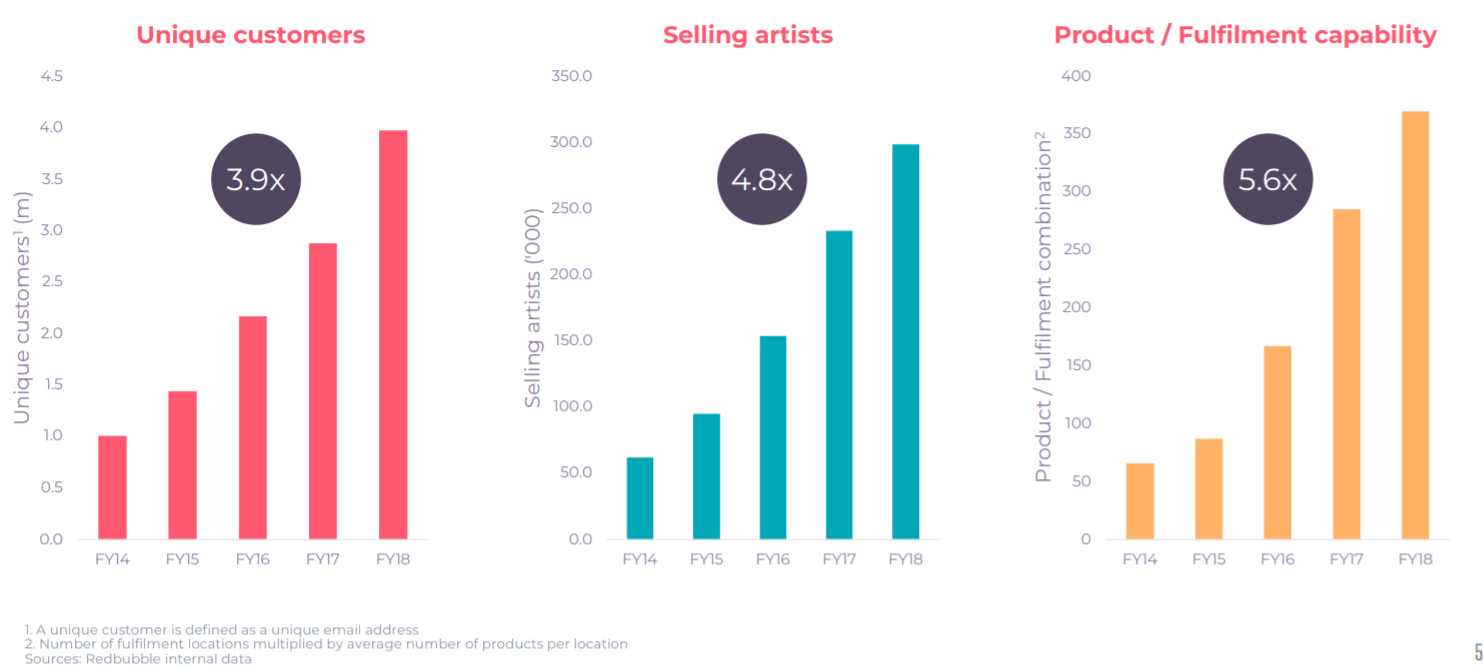
Consistent Growth in Customers, Artists and Fulfilments (Source: Company Reports)
On the financial front, the current ratio stood at 0.98x in FY18. The cash conversion cycle also stood at negative 47 days in FY18, representing efficient management policy towards its collection policy. Meanwhile, the share price has fallen 19.19 percent in the past six months and traded above the average of 52 week high and low prices. Hence, we maintain our “Speculative Buy” recommendation on the stock at the current price of $ 1.585, considering the aforesaid facts and trading level.
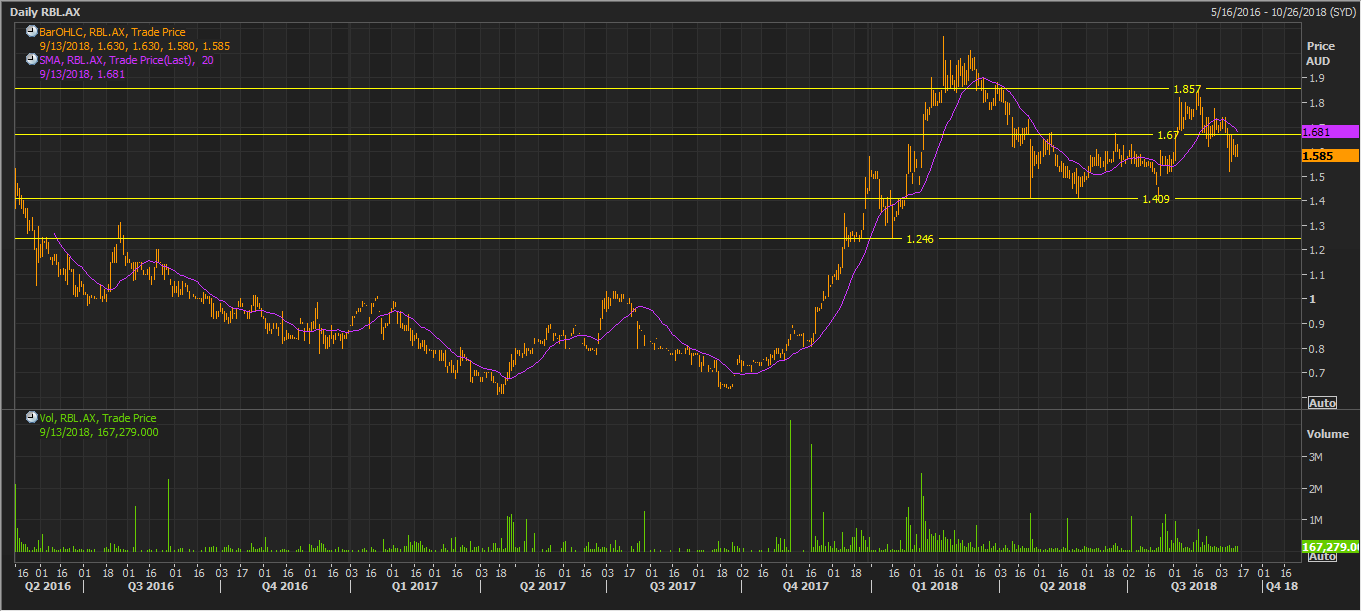
RBL Daily Chart (Source: Thomson Reuters)
Cooper Energy
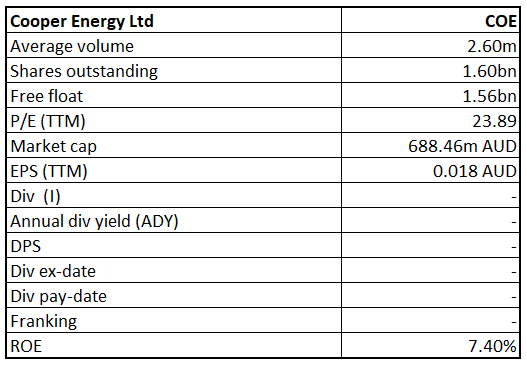
COE Details
Stellar Performance in FY18:Cooper Energy Limited (ASX: COE) posted stellar FY18 results with statutory NPAT recorded at $27.0 Mn in FY18 against the loss of $12.3 Mn in FY17. Underlying profit also increased to $9.8 Mn compared to the loss of $8.7 Mn. As at 30 June 2018, the company had cash reserve of $236.9 Mn. The company is estimating that its gas production would increase over 5 times from existing resources and projects. On the analysis front, the company has posted better margins followed by more efficient use of capital thereby generating higher ROE. Net Margin for the company came in at 37.8% for FY18 compared to the industry standard of 13.2%. Operating margin was also higher at 43.4% in FY18 against the industry benchmark of 22.0%. The company had ROE of 7.4% against -5.2% in FY17 and industry standard of 10.6%.
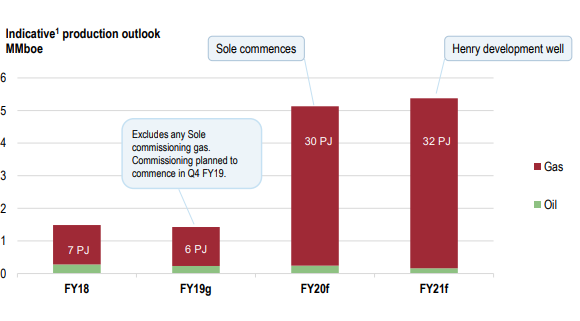
Gas Production Outlook (Source: Company Reports)
On the other hand, Commonwealth Bank of Australia and its related corporate listed in Annexure A increased their stake in the company, and as a result voting power increased to 6.29% compared to 5.28% previously. Meanwhile, the stock had a good run this year, generating YTD return of 30.30% and looks good on the charts. The price corrected from the high of $0.505 and has formed a strong support around $0.420. We believe that the stock has made a strong case of upside potential and therefore recommend investors to “Hold” the stock at the current market price of $0.440.
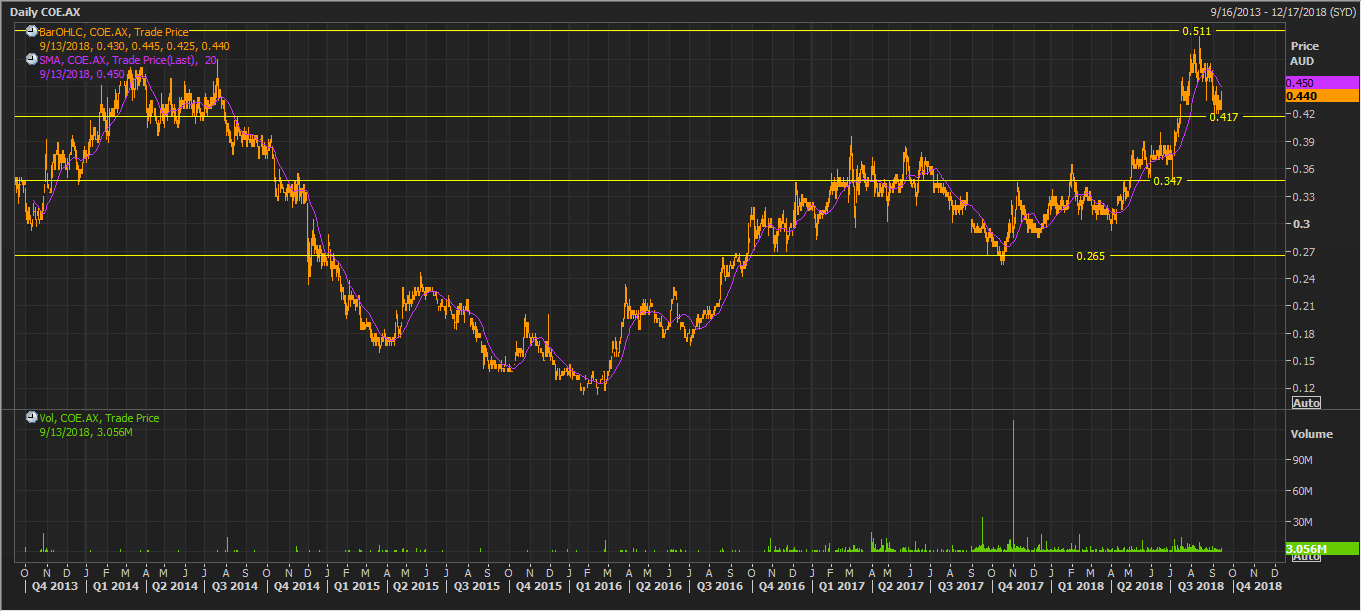
COE Daily Chart (Source: Thomson Reuters)
Disclaimer
The advice given by Kalkine Pty Ltd and provided on this website is general information only and it does not take into account your investment objectives, financial situation or needs. You should therefore consider whether the advice is appropriate to your investment objectives, financial situation and needs before acting upon it. You should seek advice from a financial adviser, stockbroker or other professional (including taxation and legal advice) as necessary before acting on any advice. Not all investments are appropriate for all people. Kalkine.com.au and associated pages are published by Kalkine Pty Ltd ABN 34 154 808 312 (Australian Financial Services License Number 425376). The information on this website has been prepared from a wide variety of sources, which Kalkine Pty Ltd, to the best of its knowledge and belief, considers accurate. You should make your own enquiries about any investments and we strongly suggest you seek advice before acting upon any recommendation. Kalkine Pty Ltd has made every effort to ensure the reliability of information contained in its newsletters and websites. All information represents our views at the date of publication and may change without notice. To the extent permitted by law, Kalkine Pty Ltd excludes all liability for any loss or damage arising from the use of this website and any information published (including any indirect or consequential loss, any data loss or data corruption). If the law prohibits this exclusion, Kalkine Pty Ltd hereby limits its liability, to the extent permitted by law to the resupply of services. There may be a product disclosure statement or other offer document for the securities and financial products we write about in Kalkine Reports. You should obtain a copy of the product disclosure statement or offer document before making any decision about whether to acquire the security or product. The link to our Terms & Conditions has been provided please go through them and also have a read of the Financial Services Guide. On the date of publishing this report (mentioned on the website), employees and/or associates of Kalkine Pty Ltd do not hold positions in any of the stocks covered on the website. These stocks can change any time and readers of the reports should not consider these stocks as advice or recommendations.
 AU
AU

 Please wait processing your request...