.png)
Stocks’ Details
Magnis Energy Technologies Ltd
Q2FY20 Cash Flow Update for the Period Ended 31st December 2019: Magnis Energy Technologies Ltd (ASX: MNS) is involved in lithium-ion battery technology manufacturing across Australia & the USA, coupled with pre-mine development of its Nachu Graphite project in Tanzania.
MNS declared its quarterly cash flow statement, wherein the business reported net cash used in operating activities of $1.122 million,which includes $0.276 million used for exploration and evaluation, $0.489 million used for staff costs and $0.464 million for administration and corporate costs. The business exited the December quarter with cash and cash equivalents of $0.433 million.
Cash Flow Outlook: As per the guidance for Q3FY20, the company estimates cash outflows of $1.903 million, which includes $0.412 million of exploration and evaluation expense, staff costs at $0.459 million, and administration and corporate costs at $0.575 million.
.png)
Projected Cash Flow (Source: Company Reports)
December Quarter Trading Update: On 30th January 2020, the company stated that it has implemented a binding engineering, procurement and construction contract with Metallurgical Corporation of China to deliver a turn-key solution for a 240,000 tpa graphite production facility at the Nachu Project. The report also revealed that Professor M. Stanley Whittingham, a non-executive Director of the company, was awarded the 2019 Nobel Prize in Chemistry, considering his efforts in developing the lithium-ion battery.
Stock Recommendation: As per ASX, the stock of MNS is trading below the average of its 52-week low-high of $0.074 and $0.375, offering a good opportunity for accumulation. During FY19, current ratio of the company stood at 5.44x as compared to the previous year’s ratio of 1.44x. This indicates that the company is now in a healthier position to pay off its current liabilities utilizing its current assets. Considering the performance in December quarter, healthy business prospects, sector-specific scenario, and current trading levels, we recommend a “Speculative Buy” rating on the stock at the current market price of $0.105, down by 4.545% on January 30, 2020.
Core Lithium Limited
Acquisition Synergies & Higher Investment in Drilling Program are Key Catalysts: Core Lithium Limited (ASX: CXO) is engaged in the production & exploration of lithium and base metals via enhancement of its Finniss Lithium Project, situated in the Northern Territory in Australia.
December ’19 Quarter Highlights: During the period, the company remained on track to continue its Mineral Resource development and exploration drilling program at the Finniss Project. The company also completed the buyout of the Walanbanba project located near the Barrow Creek (ABC) Lithium Project. The company also revealed consistent and thick high-grade spodumene pegmatite drill intersections at the BP33 and Carlton deposits.
The company reported a net operating cash outflow of $3,071K for the quarter. The company exited the quarter with cash and cash equivalents of $4,001K.For the coming quarter, cash outflow is expected to be $1,331k, which includes $353K of exploration and evaluation expense, staff costs at $336K and administration and corporate costs at $198K.
.png)
Projected Cash Flow (Source: Company Reports)
Stock Recommendation: As per ASX, the stock is trading close to its 52-weeks low of $0.031,offering a good opportunity for accumulation. As on 30th January2020, the company’s market capitalisation stands at ~$28.53 million, with 792.52 million outstanding shares. During FY19, current ratio of the company stood at 5.17x. higher than the industry median of 1.87x. The company plans to boost the mine-life and initiate mining and construction in the coming years. Considering the recent developments, including the acquisition of lithium project, world-class pegmatite intersection at the Finniss project, price movement and current trading levels, we give a “Speculative Buy” recommendation on the stock at the current market price of $0.037, up 2.778% on 30th January2020.
Yowie Group Ltd
Q2FY20 Highlights for the Period Ended 31st December 2019: Yowie Group Ltd (ASX: YOW) is a worldwide brand licensing company, with specialisation in the expansion & development of consumer products designed to promote learning.
During Q2FY20, the company reported a decline of 49% in net sales on a year over year basis and the figure stood at US$2.092 Mn. The decline in revenue was due to difficult market conditions along with stiff competition after the launch of a new chocolate line by a key global competitor. The company’s EBITDA loss was US$955k in Q2FY20 against US$576k in the previous year.
Cash Flow Update for the Period Ended 31st December 2019:Yowie Group Ltd declared its quarterly cash flow statement, wherein the business reported net cash used in operating activities at $0.640 million, which includes $2.272 million used for product manufacturing and operating costs, $0.508 million used for staff costs and $0.888 million for administration and corporate costs. The business exited the December quarter with cash and cash equivalents of $12.485 million.
.png)
Cash Flow Details (Source: Company Reports)
What to Expect: For the coming quarter, the company estimates cash outflows of $4 million. The company expects to report lower-than-expected revenue growth in FY20 on the back soft sales in December quarter and stiff competition. Further, based on the current trend, the company expects a negative impact on EBITDA along with a negative operating cash flow in the coming two quarters.
.png)
Cash Flow Estimates (Source: Company Reports)
Stock Recommendation: As per ASX, the stock is trading above the average of its 52-weeks low-high of $0.037 and $$0.073. As on 30th January2020, the company’s market capitalisation stands at ~$13.75 million, with 218.3 million outstanding shares. Gross margin of the company stood at 45.1% in FY19 versus 39.5% of the industry median. The stock of YOW is trading at a price to book multiple of 0.4x on TTM basis as compared to the industry median (Consumer Non-Cyclicals) of 1.9x. Therefore, considering the above factors, we give a “Hold” recommendation on the stock at the current market price of $0.061 per share, down 3.175% as on 30th January 2020, on the back of tepid outlook, difficult market conditions and increasing competition.
SportsHero Limited
Encouraging Response for Kita Garuda App: SportsHero Limited (ASX: SHO) is engaged in the advancement of the sports gamification platform and has a market capitalization of $10.83 Mn as on 30th January 2020. Recently, the company informed on the positive initial user and engagement outcomes of the soft launch of its ‘Kita Garuda app’, built for the Football Association of Indonesia (“PSSI”). A substantial rise in downloads and reviews for the app portrayed its growth potential.
September Quarter Key Takeaways: SportsHero Limited declared its quarterly cash flow statement, wherein the business reported net cash used in operating activities at $928K, which includes $356K used for product manufacturing and operating costs, $185K used for staff cost and $279K for administration and corporate costs. The business exited the September quarter with cash and cash equivalents of $1.518 million.
Cash Flow Outlook: In the coming quarter, the company is expecting cash outflow to be $485K, after making major payments for staff costs of $200K, and administration and corporate costs of $95K. Product manufacturing and operating costs for the quarter are expected to be $150K.
.png)
Cash Flow Estimates (Source: Company Reports)
Stock Recommendation: As per ASX, the stock is trading close to its 52-weeks low of $0.029,offering a good opportunity for accumulation. As on 30th January2020, the company’s market capitalisation stands at ~$10.83 million, with 328.21 million outstanding shares. The stock has generated a positive return of ~6.45% on a year-to-date basis. Considering the long-term partnership with PSSI, successful release of Kita Garuda app, current trading levels, and the scalability of the business, we give a “Speculative Buy” recommendation on the stock at the current market price of $0.030 per share, down 9.091% as on 30th January 2020.
Splitit Payments Ltd
Acceptance to AFIA Draft Code: Splitit Payments Ltd (ASX: SPT) is a provider of credit card-based instalment solution to merchants & businesses. On 30th January 2020, the company responded with the acceptance of the draft Code of Practice for buy now pay later (BNPL) providers issued for consultation by the Australian Finance Industry Association (AFIA).
Splitit Payments Collaborates with Stripe: On 28th January 2020, the company revealed that it has entered into a partnership agreement with Stripe. The partnership agreement will integrate SPT’s solution with Stripe Connect, to simplify merchant on-boarding & improve merchant experience.
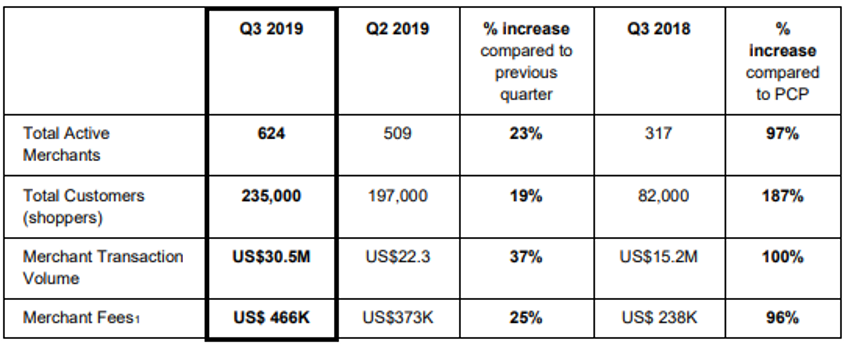
September quarter Key Takeaways: During the period, the company’s total active merchants increased 97% year over year and came in at 624. Total customers reached 235,000, up 187% year over year. Merchant Transaction Volume stood at US$30.5 million, an increase of 100% on y-o-y basis. Merchant fees increased ~96% from the year ago period.
Key Metrics (Source: Company Reports)
Stock Recommendation: As per ASX, the stock is trading below the average of its 52-week low-high of $0.305 and $2.00, respectively, proffering an opportunity for accumulation. As on 30th January2020, the company’s market capitalisation stands at ~$205.61 million, with 311.53 million outstanding shares. Gross margin of the company stood at 90.4% in FY19 versus 74.5% of the industry median. The company is well-funded to accelerate merchant acquisition and partnerships in the near term. The company will continue sourcing unique customers and boosting transaction volumes, to aid growth in merchant fees in the coming quarter. On TTM basis, the stock is trading at a price/Book multiple of 4.0x, lower than the industry average (Software and IT Services) of 4.5x. Considering the returns, trading levels and decent outlook, we recommend a “Speculative Buy” rating on the stock at the current market price of $0.685, up 3.788% as on 30th January 2020.
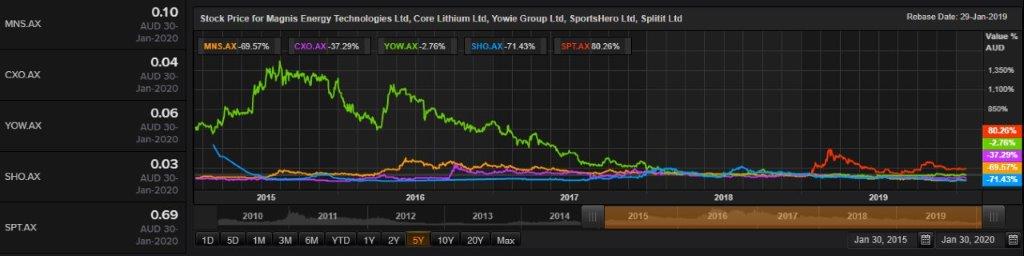
Comparative Price Chart (Source: Thomson Reuters)
Disclaimer
The advice given by Kalkine Pty Ltd and provided on this website is general information only and it does not take into account your investment objectives, financial situation or needs. You should therefore consider whether the advice is appropriate to your investment objectives, financial situation and needs before acting upon it. You should seek advice from a financial adviser, stockbroker or other professional (including taxation and legal advice) as necessary before acting on any advice. Not all investments are appropriate for all people. Kalkine.com.au and associated pages are published by Kalkine Pty Ltd ABN 34 154 808 312 (Australian Financial Services License Number 425376). The information on this website has been prepared from a wide variety of sources, which Kalkine Pty Ltd, to the best of its knowledge and belief, considers accurate. You should make your own enquiries about any investments and we strongly suggest you seek advice before acting upon any recommendation. Kalkine Pty Ltd has made every effort to ensure the reliability of information contained in its newsletters and websites. All information represents our views at the date of publication and may change without notice. To the extent permitted by law, Kalkine Pty Ltd excludes all liability for any loss or damage arising from the use of this website and any information published (including any indirect or consequential loss, any data loss or data corruption). If the law prohibits this exclusion, Kalkine Pty Ltd hereby limits its liability, to the extent permitted by law to the resupply of services. There may be a product disclosure statement or other offer document for the securities and financial products we write about in Kalkine Reports. You should obtain a copy of the product disclosure statement or offer document before making any decision about whether to acquire the security or product. The link to our Terms & Conditions has been provided please go through them and also have a read of the Financial Services Guide. On the date of publishing this report (mentioned on the website), employees and/or associates of Kalkine Pty Ltd do not hold positions in any of the stocks covered on the website. These stocks can change any time and readers of the reports should not consider these stocks as advice or recommendations.
 AU
AU

 Please wait processing your request...