.png)
Stocks’ Details
Carnarvon Petroleum Limited
Received Positive Result on Dorado Contingent Resource Estimates: Carnarvon Petroleum Limited (ASX: CVN) is a small-cap oil & gas company with the market capitalization of circa $511.65 Mn as of October 04, 2018. During the quarter, CVN and its Joint Venture partner Quadrant Energy commenced drilling the Phoenix South-3 and Dorando-1 wells in the Bedout Sub-basin of the Australian North West Shelf with the objective of confirming commercial quantities of gas and condensate (very light oil) to underpin a development in the area. As of now, these wells are targeting significant quantities of gas and condensate which has the potential to deliver significant value to shareholders. Following this, it has recently released the Dorado Contingent Resource Estimate wherein it is estimated to be 171 mmbbls oil, 552bcf of gas, and 16mmbbl of condensate on a 2C basis. This summarised total oil equivalent of 282 MMboe. The company has 20% of this and 1C oil is 82mmbbl, with 3C at 320mmbbl. As at June 30, 2018, the Company had a cash balance of $63.6 million with $3.9 Mn exploration spend and reported profit for the year against last year’s loss position. Moreover, the key benefit will be to have better processes in the Phoenix South-3, Dorado-1 and Buffalo-10 wells with prudent cost savings.
.png)
Tremendous Oil Numbers Even on 1C basis (Source: Company Reports)
Meanwhile, the share price has risen 207.14% in the past three months as of October 03, 2018 and traded at close to a higher level. In our view, the company holds decent opportunity underpinned by the potentiality for its portfolio of oil & gas assets that include two near-term oil developments and other ongoing development. Hence, we give a “Speculative Buy” recommendation on the stock at the current market price of $0.465 (up 8.14% on October 04, 2018).
Cooper Energy Limited
Strategic Partnership for Overall growth: Cooper Energy Limited (ASX: COE) announced that Casino Henry JV has signed a one-year new gas sales agreement with Origin Energy Retail Limited at current market prices. The objective of this deal is to provide supply to Origin Energy from the joint venture. Further, the company has also entered into a new agreement with Lochard Energy for processing at the Iona Gas Plant for a minimum of 1 year and a maximum of 3 years to support a smooth transition to the Minerva Gas Plant in due course. The company is also targeting two exploration wells in the offshore Otway basin gas in 2020 with the ability to tie-back to spare capacity in the Minerva gas plant. Moreover, the Casino Henry joint venture also holds the adjoining VIC/P44 exploration permit and VIC/RL11 and VIC/RL12 retention licenses which allow for more exploration activity in the region. Meanwhile, the share price has risen 22.67 percent in the past three months as at October 03, 2018 and traded at reasonable PE level of 25.56x. Based on the following developments, we give a “Buy” recommendation on the stock at the current price of $0.475.
Sundance Energy Australia Limited
YoY Rise in the Top Line: In half year ended June 2018, Sundance Energy Australia Limited (ASX: SEA) garnered total revenues amounting to US$52.7 million which implies the YoY growth of 18.7%.The YoY increase in the revenues was witnessed in the all the product offerings of the company. However, the highest growth rate of 62.8% was encountered in the Natural gas liquids sales. The company witnessed a YoY rise in the oil sales of 14.6% thanks to the elevated pricing levels. However, increased prices got partially offset by a decline in the production volumes. During the same period, natural gas sales witnessed an increase of 25.7% on the YoY basis. This increase was helped by a rise in the production which got partially offset by a decline in the prices of the products.
.png)
Performance (Source: Company Reports)
Two technical indicators have been applied on the daily chart of Sundance Energy Australia Limited by considering the default values. Both the technical indicators are showing bullish momentum. MACD has crossed the signal line and is moving upward representing the bullish crossover. The stock price has crossed the exponential moving average and is moving upward. However, on October 4, 2018, the stock price is trading at A$0.091 and is trading in the higher range. As a result, we give a “Speculative Buy” rating on the stock given more momentum expected in the stock. However, the company has a market capitalization of $592.96 million.
Buru Energy Limited
A look at revenues and cash flows: Buru Energy Limited (ASX: BRU) ended half year, June 2018 by garnering revenues amounting to A$9.4 million. During the same period, the company’s income after tax amounted to A$30.7 million. However, in the June quarter, the company saw net cash outflow from the operations amounting to A$2.6 million. The primary reason for the cash outflow was significant expenses incurred in regard to payments for the production activities. However, the company received payments amounting to A$5.2 million.
In June quarter, the company garnered cash of A$13.04 million from the investing activities thanks to the proceeds from the tenements as well as property, plant and equipment.
.png)
Performance (Source: Company Reports)
A technical indicator, MACD, has been applied on the daily chart of Buru Energy Limited. After careful determination, it was observed that the MACD line has crossed the signal line and is expected to move upward. Thus, the crossover implies a bullish crossover. Therefore, we give a “Speculative Buy” rating on the stock at the current market price of A$0.265 as on October 4, 2018. The company had a market capitalization of $112.34 million.
3D Oil Limited
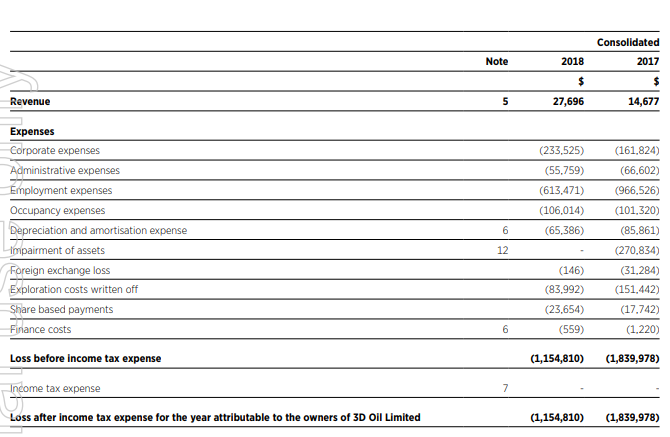
YoY increase in the revenues: 3D Oil Limited (ASX: TDO) witnessed a significant amount of losses in FY 2018 primarily because of a rise in the expenses. The company generated revenues amounting to $0.027 million in FY 2018 which implies an increase on the YoY basis. In FY 2017, it had revenues of $0.014 million. The company incurred post-tax losses amounting to $1.15 million in FY 2018 while in the previous year it was $1.83 million. Further, the losses have declined in FY 2018 on the YoY basis primarily because of lower administrative, employment, depreciation and amortization, foreign exchange loss as well as finance costs. However, the exploration costs which were written off in FY 2018 were lower than FY 2017 and impairment costs of assets were zero in FY 2018 while in FY 2017 it was $0.27 million.
Performance (Source: Company Reports)
On the daily chart of 3D Oil Limited (ASX: TDO), MACD (Moving Average Convergence Divergence) indicator has been applied and the default values have been taken into consideration. As per the observation, MACD line has just crossed the signal line and might move upwards. Therefore, we have a “wait and watch” view on the stock for better opportunity. TDO traded at $0.135, up 8% on October 4, 2018.
Disclaimer
The advice given by Kalkine Pty Ltd and provided on this website is general information only and it does not take into account your investment objectives, financial situation or needs. You should therefore consider whether the advice is appropriate to your investment objectives, financial situation and needs before acting upon it. You should seek advice from a financial adviser, stockbroker or other professional (including taxation and legal advice) as necessary before acting on any advice. Not all investments are appropriate for all people. Kalkine.com.au and associated pages are published by Kalkine Pty Ltd ABN 34 154 808 312 (Australian Financial Services License Number 425376). The information on this website has been prepared from a wide variety of sources, which Kalkine Pty Ltd, to the best of its knowledge and belief, considers accurate. You should make your own enquiries about any investments and we strongly suggest you seek advice before acting upon any recommendation. Kalkine Pty Ltd has made every effort to ensure the reliability of information contained in its newsletters and websites. All information represents our views at the date of publication and may change without notice. To the extent permitted by law, Kalkine Pty Ltd excludes all liability for any loss or damage arising from the use of this website and any information published (including any indirect or consequential loss, any data loss or data corruption). If the law prohibits this exclusion, Kalkine Pty Ltd hereby limits its liability, to the extent permitted by law to the resupply of services. There may be a product disclosure statement or other offer document for the securities and financial products we write about in Kalkine Reports. You should obtain a copy of the product disclosure statement or offer document before making any decision about whether to acquire the security or product. The link to our Terms & Conditions has been provided please go through them and also have a read of the Financial Services Guide. On the date of publishing this report (mentioned on the website), employees and/or associates of Kalkine Pty Ltd do not hold positions in any of the stocks covered on the website. These stocks can change any time and readers of the reports should not consider these stocks as advice or recommendations.
 AU
AU
 Please wait processing your request...