.png)
Stocks’ Details
WAM Research Limited
Solid Investment Portfolio & Enhancing Shareholders Value are the key Catalysts: WAM Research Limited (ASX: WAX) is a listed investment company that provides exposure to a diversified portfolio of undervalued growth companies. The market capitalisation of the company stood at ~$283.39 Mn as on 17th February 2020.
1HFY20 Financial Highlight for the Period Ended 31 December 2019: In 1HFY20, the company recorded operating profit before tax of $14.6 million, up a whopping 152.8% year over year. Net profit after tax stood at ~$11 million, up 159.3%, due to robust investment portfolio performance. The company’s Board continued to enhance shareholder returns through the payment of fully franked interim dividends of 4.9 cents per share in 1HFY20. Ever since the company formed, WAM Research has paid 104.30 cents per share in fully franked dividends to its shareholders. The company currently has an annual dividend yield of 6.58%.
.png)
1HFY20 Key Financial Highlights (Source: Company Reports)
Portfolio Update of WAX as at 31 December 2019: WAX portfolio increased by 8% on a year-to-date basis as compared to S&P/ASX All Ordinaries Accumulation Index, which increased by 3.6% in the same time span and the portfolio outperformed the S&P/ASX All Ordinaries Accumulation Index by 4.4%.
.png)
Performance of WAX’s Portfolio (Source: Company Reports)
Stock Recommendation: The company will continue to carry out investment activities, which is primarily investing in equities on the ASX to achieve its goals. The stock is trending at the upper band of its 52-week trading range of $1.210 to $1.525. The stock has generated a decent return of 10.49% in the last six months. The stock has a price to book value of 1.3x on TTM basis, which is much lower as compared to the industry average of 4.3x on TTM basis. Therefore, considering the decent dividend-related parameters, valuation and current trading levels, we give a “Hold” recommendation on the stock at the current market price of $1.52 per share, up 3.051% as on 17th February 2020, taking cues from the release related to financial results.
WAM Microcap Limited
Operating Profit up ~312% Year over Year in 1HFY20:WAM Microcap Limited (ASX: WMI) is a listed investment and reporting company. The entity is mainly an investor in equities listed on the Australian stock exchange.
1HFY20 Financial Highlight for the Period Ended 31 December 2019: In 1HFY20, the company recorded a profit before tax of $27.29 million, which soared 311.9% from the prior corresponding period. Net profit after tax came in at ~$19.69 million, up 333.1%, due to strong investment portfolio performance and growth in the asset. The company’s Board declared a fully franked interim dividends of 3 cents per share in 1HFY20, up 33.3% year over year. Since inception, WMI has paid 12.75 cents per share in fully franked dividends to its shareholders.
.png)
1HFY20 Key Financial Highlights (Source: Company Reports)
Portfolio Update of WMI as at 31 December 2019: WMI portfolio increased by 18.5% on a year-to-date basis as compared to S&P/ASX All Ordinaries Accumulation Index, which increased by 3.9% in the same time span and the portfolio outperformed the S&P/ASX All Ordinaries Accumulation Index by 14.6%.
.png)
Performance of WMI’s Portfolio (Source: Company Reports)
Stock Recommendation: WMI remains on track to enhance shareholders’ capital through regular dividends, which is the key focus in the company’s investment process. The stock is trending at the upper band of its 52-week trading range of $1.127 to $1.585. The stock has generated a decent return of 24.22% in the last six months andthe stock is available at a P/E multiple of 31.3x. The stock has a price to book value of 1.1x on TTM basis, which is much lower as compared to the industry average of 4.3x on TTM basis. Therefore, considering the decent dividend-related parameters, portfolio performance, and current trading levels, we give a “Hold” recommendation on the stock at the current market price of $1.575 per share, up 0.639% as on 17th February 2020.
WAM Leaders Limited
Operating Profit After Tax up 201.9% Year Over Year: WAM Leaders Limited (ASX: WLE) is a listed investment company, which largely invests in equities listed on ASX and offers investors with diversified portfolio of undervalued growth companies.
Portfolio Update and Financial Highlight as at 31 December 2019: The investment portfolio of WLE increased 6.6% in the six months to December 2019, outperforming the S&P/ASX 200 Accumulation Index by 3.5%. S&P/ASX All Ordinaries Accumulation Index increased by 3.1% in the same time span.
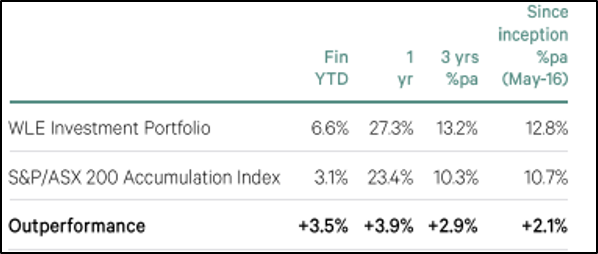
Performance of WLE’s Portfolio (Source: Company Reports)
The company reported a net profit from ordinary activities after tax of $43.3 million, an increase of 201.9% year over year.The company recorded a rise of 185.8% in profit before tax on a year over year basis which came in at $56.2 million, mainly due to robust investment portfolio performance and a rise in asset over the period. The company declared FY19 dividend of 3 cents per share and an interim dividend of 3.25 cents per share for FY2020.
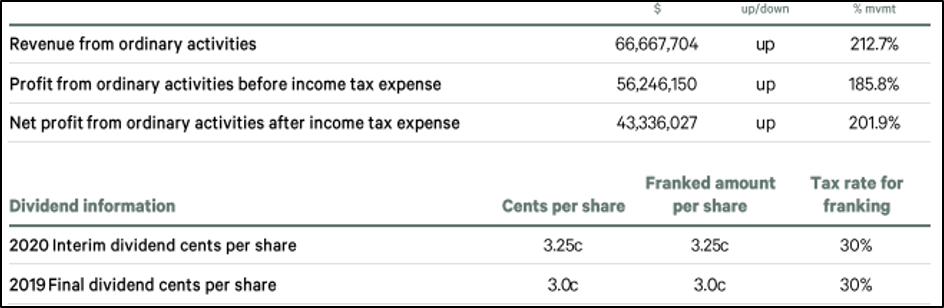
1HFY20 Key Financial Highlights (Source: Company Reports)
Stock Recommendation: The stock of WLE is trading at $1.325 with a market cap of ~$1.04 billion. The stock has generated returns of 16.23% in the last six months. The stock has an annual dividend yield of 4.72% and a P/E multiple of 6.4x. The company remains on track to seek new opportunities, irrespective of market conditions. Therefore, considering the aforesaid facts, we maintain a “Hold” recommendation on the stock at the current market price of $1.325 per share as on 17th February 2020.
Elanor Investors Group
Core Earnings up ~84.1% Year Over Year:Elanor Investors Group (ASX: ENN) owns and manages real estate backed operating businesses and investment funds. The market capitalisation of the company stood at ~$256.12 Mn as on 17th February 2020.
1HFY20 Financial Highlight for the Period Ended 31 December 2019: Funds Under Managementfor the period increased by 46.1% year over year to $1,679 Mn. The company’s ASX Listed funds under management stood at $731 million, up 127% year over year. During the period, the company recognised two new managed funds with a combined gross asset value of $176.8 m as at 31 December 2019. Annualised recurring Funds Management fees came in $12.1 Mn, up 18.6% year over year. The company’s core earnings soared 84.1% and stood at 12.4 Mn. The company maintained 90% of core earnings as payout ratio.

1HFY20 Financial Highlights (Source: Company Reports)
Balance Sheet Details: Total asset as at 31 December 2019 stood at $280.1 Mn, up from $231.3 Mn reported as at 31 December 2018. Total borrowing at the end of the period stood at $87.8 Mn, with net assets amounting to $177.2 Mn. Total Gearing ratio came in at 24.4% at the end of the period, as compared to 26.1% reported in the prior corresponding period.
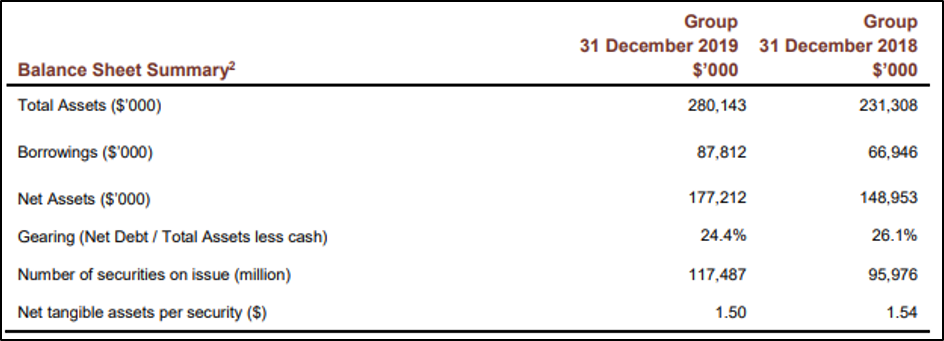
Balance Sheet Sneak Peek (Source: Company Reports)
Stock Recommendation: The stock of ENN is trading at $2.18 and is trending towards the upper band of its 52-week trading range of $1.615 to $2.400. The stock has generated returns of 29.76% in the past one year. The stock has an annual dividend yield of 8.78% and a P/E multiple of 13.59x. The company’s robust pipeline in its key investment sector continuously focusses on retail real estate, commercial office real estate, tourism and leisure sectors, which is a key positive. The stock has a price to book value of 1.6x on TTM basis, lower as compared to the industry average of 4.3x on TTM basis. Therefore, considering the above parameters, returns and current trading levels, we have a watch stance on the stock at the current market price of $2.18 per share as on 17th February 2020.
NAOS Small Cap Opportunities Company Limited
Regular Buy-Back Program & Regular Dividend are Key Positives: NAOS Small Cap Opportunities Company Limited (ASX: NSC) is a specialist fund manager and a listed investment company that offers investors with exposure to high-quality, undervalued small cap companies. Recently, the company announced an on-market share Buy-Back Program (Buy-Back Program) during March 2019. Till now, the company has bought back 89,77,559 shares under the Buy-Back Program for a total consideration of around $59,52,116.
Investment Report Update as at 31 January 2020: NSC portfolio increased by 2.5% for the month of January, as compared to S&P/ASX small Ordinaries Accumulation Index, which increased by 3.38% in the sametime span. Since Inception the company’s portfolio increased by 2.27%.
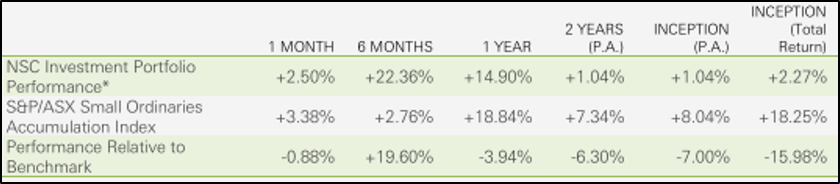
Performance of NSC’s Portfolio (Source: Company Reports)
Regular Stream of Fully Franked Dividends: As at January 31, 2020, the company paid a dividend of 1.00 cents per share (100% franked), which demonstrated regular stream of fully franked dividends paid by the company to its shareholders. The company currently has an annual dividend yield of 5.1%.
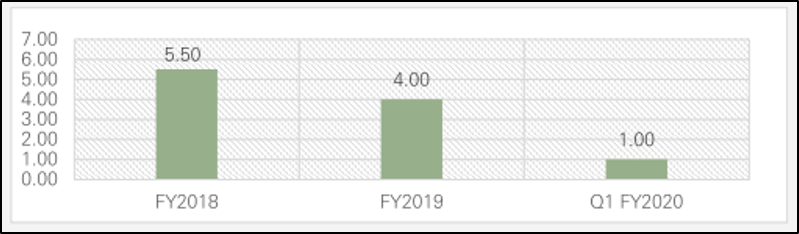
Dividend (Source: Company Reports)
Stock Recommendation: The company’s initiative to focus more on concentrated investment portfolio and providing a regular stream of fully franked dividends, are likely to provide satisfactory returns along with NTA growth over the long-term. Notably, in the past six months, the stock provided a return of 26.55% to its shareholders. The stock of NSC is trending towards the upper band of its 52-week trading range of $0.540 to $0.775.The stock has generated returns of 26.55% in the last six months. Therefore, considering the above parameters, returns and current trading levels, we give a “hold” recommendation on the stock at the current market price of $0.71 per share, down 0.699% as on 17th February 2020.
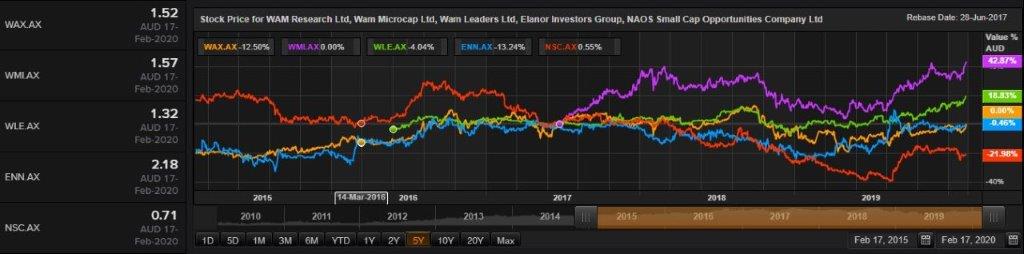
Comparative Price Chart (Source: Thomson Reuters)
Disclaimer
The advice given by Kalkine Pty Ltd and provided on this website is general information only and it does not take into account your investment objectives, financial situation or needs. You should therefore consider whether the advice is appropriate to your investment objectives, financial situation and needs before acting upon it. You should seek advice from a financial adviser, stockbroker or other professional (including taxation and legal advice) as necessary before acting on any advice. Not all investments are appropriate for all people. Kalkine.com.au and associated pages are published by Kalkine Pty Ltd ABN 34 154 808 312 (Australian Financial Services License Number 425376). The information on this website has been prepared from a wide variety of sources, which Kalkine Pty Ltd, to the best of its knowledge and belief, considers accurate. You should make your own enquiries about any investments and we strongly suggest you seek advice before acting upon any recommendation. Kalkine Pty Ltd has made every effort to ensure the reliability of information contained in its newsletters and websites. All information represents our views at the date of publication and may change without notice. To the extent permitted by law, Kalkine Pty Ltd excludes all liability for any loss or damage arising from the use of this website and any information published (including any indirect or consequential loss, any data loss or data corruption). If the law prohibits this exclusion, Kalkine Pty Ltd hereby limits its liability, to the extent permitted by law to the resupply of services. There may be a product disclosure statement or other offer document for the securities and financial products we write about in Kalkine Reports. You should obtain a copy of the product disclosure statement or offer document before making any decision about whether to acquire the security or product. The link to our Terms & Conditions has been provided please go through them and also have a read of the Financial Services Guide. On the date of publishing this report (mentioned on the website), employees and/or associates of Kalkine Pty Ltd do not hold positions in any of the stocks covered on the website. These stocks can change any time and readers of the reports should not consider these stocks as advice or recommendations.
 AU
AU

 Please wait processing your request...