.png)
Stocks’ Details
Stockland
Robust Growth in Statutory Profit: Stockland (ASX: SGP) owns, manages and develops numerous assets, which include shopping centres, office and industrial assets, etc. The market capitalisation of SGP stood at $10.44 Bn as on 12th March 2020. Recently, the company has appointed Sharmila Tsourdalakis on the role of Chief Innovation, Marketing and Technology Officer, which will be effective from 27th April 2020. For the 1HFY20, the company reported a rise of 68.1% in statutory profit, which amounted to $504 million. This reflects a positive net revaluation of $199 million. Due to anticipated second-half skew, funds from operations of the company stood at $384 million, down by 5.6% on pcp.
For the same time period, Stockland declared a distribution per security of 13.5 cents per share, which indicates a payout ratio of 84%. At the current market price of $4.050, the annual dividend yield of SGP stood at 6.3%, which is higher than the industry average (Residential & Commercial REITs) of 5.3% on TTM basis.
.png)
Funds from Operations (Source: Company Reports)
Guidance for FY20: SGP is expecting to deliver FFO growth of approx. 1% throughout its commercial property business in FY20 on the face of the assumption that there will be no material change in market conditions. It anticipates reporting FFO per security of 37.4 cents along with distribution per security of 27.6 cents in FY20.
Valuation Methodology: P/E Multiple Based Relative Valuation
.png)
P/E Based Valuation (Source: Thomson Reuters)
Note: All forecasted figures have been taken from Thomson Reuters, NTM: Next Twelve Months
Stock Recommendation:The company is of the view that it has achieved strong momentum on the delivery of its strategic priorities, which include a rise of 7% in workplace and logistics allocation over the last 18 months. We have valued the stock using P/E based relative valuation method, and for the purpose, we have taken peers such as Scentre Group (ASX: SCG), Vicinity Centres (ASX: VCX) and Charter Hall Retail REIT (ASX: CQR) and arrived at a target price, which is offering an upside of lower double-digit (in percentage terms). Hence, considering the guidance for FY20 and growth in statutory profit, we give a “Buy” recommendation on the stock at the current market price of $4.050 per share, down by 7.534% on 12th March 2020.
Lendlease Group
Decent Growth in Urbanisation Pipeline:Lendlease Group (ASX: LLC) is engaged in the retail property management, asset management and development in the Asia Pacific, Europe, and the Americas. During 1HFY20, LLC witnessed significant growth in its urbanisation pipeline. The company also wrapped up another world class urban precinct and made progress in the divestment of the Engineering business. LLC reported core business profit after tax amounting to $308 million, which helped the company in generating a return on equity of 9.6%.
For the six months ended 31st December 2019, the company declared an interim distribution of 30 cents per stapled security. Lendlease will be paying the said distribution on 17th March 2020.
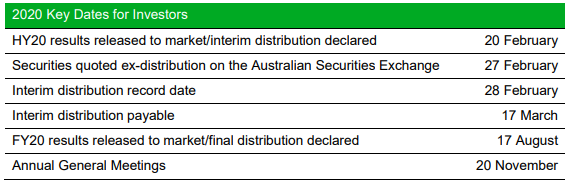
2020 Key Dates (Source: Company Reports)
Near-Term Opportunities:Going forwards, LLC is expecting near-term commercial and residential conversion opportunities throughout its major urbanisation projects. Out of these, a number of opportunities would be playing a major role for rising earnings for 2HFY20.
Valuation Methodology: P/CF Multiple Based Relative Valuation
.png)
P/CF Based Valuation (Source: Thomson Reuters)
Note: All forecasted figures have been taken from Thomson Reuters, NTM: Next Twelve Months
Stock Recommendation:Focus of LLC revolves around driving value for shareholders and maintaining a strong financial position along with robust capital partner relationships. Debt to equity of the company stood at 0.60x in 1H FY20 as compared to the industry median of 1.00x. We have valued the stock using P/CF-based relative valuation method and arrived at a target price, which is offering an upside of lower double-digit (in percentage terms). Thus, in light of deleveraged balance sheet, focus on generating value for shareholders and valuation, we give a “Buy” recommendation on the stock at the current market price of $14.410 per share, down by 6.185% on 12th March 2020.
Vicinity Centres
Strong Results in Subdued Market Conditions: Vicinity Centres (ASX: VCX) is an Australian REIT, which owns and manages shopping centres with a market capitalisation of $7.42 Bn as on 12th March 2020. VCX has bought back 231,868,043 shares at the consideration of $589,668,426 on 12th March 2020 with respect to daily share buy-back notice. During subdued economic conditions, VCX delivered robust results for 1H FY20 with statutory net profit after tax amounting to $242.8 million. It also reported funds from operations of $337.0 million, indicating comparable growth of 1.5%. These strong results imply continuing benefits from portfolio enhancement, development completions as well as active tenant remixing.
For the six months ended 31st December 2019, the company declared a distribution of 7.70 cps with a payout ratio of 94.9% of adjusted FFO. At the current market price of $1.775 per share, the annual dividend yield of the company stood at 7.92%. The below picture depicts an idea of debt maturity profile:
.png)
Debt Maturity Profile (Source: Company Reports)
Revised Guidance for FFO:The company has revised its guidance for FY20 and expects FFO per security in the range of 17.2 cents to 17.4 cents from 17.6 cents to 17.8 cents on the back of current trends observed throughout VCX’s portfolio, and assumptions for the remainder of 2H FY20.
Valuation Methodology: EV/Sales Multiple Based Relative Valuation
.png)
EV/Sales Based Valuation (Source: Thomson Reuters)
Note: All forecasted figures have been taken from Thomson Reuters, NTM: Next Twelve Months
Stock Recommendation:Net margin of the company stood at 38.1% in 1H FY20, reflecting YoY growth of 2.5%. This reflects that the company has improved its capability to convert its top-line into the bottom-line. We have valued the stock using EV/Sales based relative valuation method, and for the purpose, we have taken peers such as Goodman Group (ASX: GMG), Stockland Corporation Ltd (ASX: SGP), Charter Hall Retail REIT (ASX: CQR), etc., and arrived at a target price, which is offering an upside of lower double-digit (in percentage terms). Therefore, considering strong results in 1HFY20 and improved net margins, we give a “Buy” recommendation on the stock at the current market price of $1.775 per share, down by 10.127% on 12th March 2020.
Scentre Group
Strong Demand from Retail Partners: Scentre Group (ASX: SCG) is engaged in the development and management of property with a market capitalisation of $15.4 Bn as on 12th March 2020. Recently, Director Andrew William Harmos has made a change to holdings in the company on 11th March 2020 by acquiring 10,000 SCG securities at the consideration of $2.96 per security. For the 12 months to 31 December 2019, the company reported Funds from Operations amounting to $1.345 billion, which was in-line with the forecast for the period.
The company experienced continuous strong demand from its retail and brand partners along with portfolio occupancy of 99.3%. For the shareholders, the company declared a distribution of 22.60 cents per security, reflecting a rise of 2.0%.
.png)
Financial Overview (Source: Company Reports)
What to Expect: For the 12 months to 31st December 2020, the company is expecting operating earnings in the range of 24.75 cents and 24.80 cents per security, this will reflect the growth of around 3.1% on a pro-forma basis.
Valuation Methodology: P/E Multiple Based Relative Valuation
.png)
P/E Based Valuation (Source: Thomson Reuters)
Note: All forecasted figures have been taken from Thomson Reuters, NTM: Next Twelve Months
Stock Recommendation: The Group possesses a strong financial position along with interest cover at 3.6 times and FFO/Debt of 10.3%. SCG has been given “A” grade credit ratings by S&P, Fitchand Moody’s during FY19. We have valued the stock using P/E based relative valuation method, and for the purpose, we have taken peers such as Stockland Corporation Ltd (ASX: SGP), Vicinity Centres (ASX: VCX) and Charter Hall Retail REIT (ASX: CQR) and arrived at a target price, which is offering an upside of lower double-digit (in percentage terms). Thus, considering the growth in distribution per security during FY19, strong financial position and ratings by agencies, we give a “Buy” recommendation on the stock at the current market price of $2.700 per share, down by 8.163% on 12th March 2020.
Cromwell Property Group
Stealth Takeover by Foreign Investor:Cromwell Property Group (ASX: CMW) is an internally managed Australian REIT and also work as a property fund manager. The market capitalisation of the company stood at $2.86 Bn as on 12th March 2020. CMW recently through a release has asked its shareholder to vote against stealth takeover from ARA Asset Management through ARA Real Estate Investors XXI Pte Ltd. CMW is a strong and consistent performer, which reported a rise of 104.6% in statutory profit, which amounted to $227.3 million in 1H FY20.
For the 1HFY20, the company declared a distribution of $97.5 million, reflecting a rise of 27% over pcp. Five year (FY15-FY19) average annual dividend yield of the company stood at 5.79%. Moreover, at CMP of $1.050, the annual dividend yield of the company stood at 6.73%, which is higher than the industry median (Residential & Commercial REITs) of 5.6% on TTM basis.
.png)
Financial Performance (Source: Company Reports)
FY20 Distribution Guidance: CMW’s business is well-placed to address possible risks, strong balance sheet along with liquidity, proforma gearing in the target range, long debt tenor and long WALE. The company expects to pay a distribution of 7.50 cents per security in FY20.
Valuation Methodology: P/E Multiple Based Relative Valuation
.png)
P/E Based Valuation (Source: Thomson Reuters)
Note: All forecasted figures have been taken from Thomson Reuters, NTM: Next Twelve Months
Stock Recommendation: Return on equity of the company stood at 9.3% in 1HFY20 against 4.7% of the industry median. Current ratio of CMW stood at 0.86x in 1HFY20 as compared to the industry median of 0.63x. This reflects that CMW is in a decent position to address its short-term obligation against the peer group. We have valued the stock using P/E based relative valuation method, and for the purpose, we have taken peers such as National Storage REIT (ASX: NSR), Growthpoint Properties Australia Ltd (ASX: GOZ), Aventus Group (ASX: AVN), etc., and arrived at a target price, which is offering an upside of lower double-digit (in percentage terms). Hence, considering the decent liquidity position and current trading levels, we give a “Buy” recommendation on the stock at the current market price of $1.050 per share, down by 4.11% on 12th March 2020.
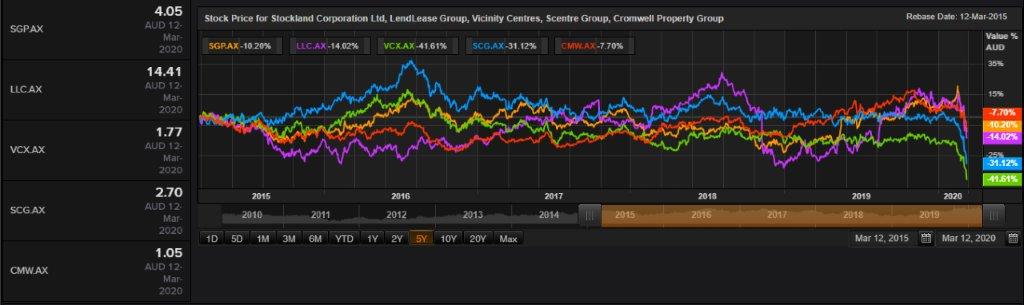
Comparative Price Chart (Source: Thomson Reuters)
Disclaimer
The advice given by Kalkine Pty Ltd and provided on this website is general information only and it does not take into account your investment objectives, financial situation or needs. You should therefore consider whether the advice is appropriate to your investment objectives, financial situation and needs before acting upon it. You should seek advice from a financial adviser, stockbroker or other professional (including taxation and legal advice) as necessary before acting on any advice. Not all investments are appropriate for all people. Kalkine.com.au and associated pages are published by Kalkine Pty Ltd ABN 34 154 808 312 (Australian Financial Services License Number 425376). The information on this website has been prepared from a wide variety of sources, which Kalkine Pty Ltd, to the best of its knowledge and belief, considers accurate. You should make your own enquiries about any investments and we strongly suggest you seek advice before acting upon any recommendation. Kalkine Pty Ltd has made every effort to ensure the reliability of information contained in its newsletters and websites. All information represents our views at the date of publication and may change without notice. To the extent permitted by law, Kalkine Pty Ltd excludes all liability for any loss or damage arising from the use of this website and any information published (including any indirect or consequential loss, any data loss or data corruption). If the law prohibits this exclusion, Kalkine Pty Ltd hereby limits its liability, to the extent permitted by law to the resupply of services. There may be a product disclosure statement or other offer document for the securities and financial products we write about in Kalkine Reports. You should obtain a copy of the product disclosure statement or offer document before making any decision about whether to acquire the security or product. The link to our Terms & Conditions has been provided please go through them and also have a read of the Financial Services Guide. On the date of publishing this report (mentioned on the website), employees and/or associates of Kalkine Pty Ltd do not hold positions in any of the stocks covered on the website. These stocks can change any time and readers of the reports should not consider these stocks as personalised advice.
 AU
AU

 Please wait processing your request...