Oil Search Limited
.png)
OSH Details
Material Progress in Alaska: Oil Search Limited (ASX: OSH) is engaged in the exploration, development and production of oil and gas resources, with 98% of the Company assets in Papua New Guinea. As on 20th December 2019, the market capitalisation of the company stood at $11.34 billion.The company’s Board has approved entry into Front-End Engineering and Design (FEED) phase of Pikka Unit Development, subject to joint venture approval and finalisation of required third-party agreements, which are expected in early 2020. For the third quarter of 2019, total production was marginally lower than the prior quarter and stood at 6.81 mmboe. In the same time span, revenue of the company went down by 5% to US$361.1 million, reflecting lower product sales and timing of shipments.
.png)
Financial Performance (Source: Company Reports)
Growth Opportunities: The basis of design and assumption for FEED is likely to start an early production system (EPS) targeting up to 30,000 bopd, in 2022. The company’s 2019/2020 winter exploration and construction activities are progressing well on the North Slope. The winter development work is anticipated to result in laying of over 1.4 million cubic yards (1.1 million cubic metres) of gravel as well as construction of over 11 miles (18 kilometres) of gravel roads, 56 acres of gravel pads and 192-foot (59 metre) bridge.
Valuation Methodology: EV/Sales Multiple Approach
.png)
EV/Sales Multiple (Source: Thomson Reuters)
Note: All forecasted figures and peers have been taken from Thomson Reuters, NTM-Next Twelve Months
Stock Recommendation: As per ASX, the stock gained 7.20% on YTD basis and 1.09% in the last one month. For 1H19, EBITDA margin stood at 71.7%, higher than the industry median of 36.2%. For the same period, net margin of the company was 20.8% as compared to the industry median of 18.4%. This indicates that the company has been able to effectively control its costs and is capable of converting its revenue to net profit. On TTM basis, the stock is available at a price to earnings multiple of 18.67x as compared to the industry median (Energy) of 24.3x. Considering the above mentioned factors and outlook, we have valued the company using one relative valuation method, i.e., EV/Sales multiple approach and arrived at a target price of lower single-digit upside (in percentage terms). Hence, we recommend a “Buy” rating on the stock at the current market price of $7.420, down 0.269% on December 20, 2019.
.jpg)
OSH Daily Technical Chart (Source: Thomson Reuters)
Boral Limited
.png)
BLD Details
Decent Rise in Revenue and Stability in Balance Sheet: Boral Limited (ASX: BLD) is in the business of manufacturing and supplying of building and construction material. As on 20th December 2019, the market capitalisation of the company stood at $5.28 billion. Despite the challenging conditions, revenue of the company went up by 4% and stood at $5,801 million in FY19 and EBITDA increased by 2% to $1.03 billion. BLD reported a decline in net debt, which was down to $2.19 billion as compared to $2.45 billion in the prior year.
.png)
Financial Performance (Source: Company Reports)
What to Expect: The company has reaffirmed FY20 NPAT outlook guidance and expects it to be in the range of 5% to 15% lower in FY 2020 as compared to FY 2019. It also anticipates the property earnings to range between $55 million to $65 million. The company expects EBITDA to be broadly similar to 2H EBITDA of the previous year, before taking into account the additional earnings expected from USG Boral transaction with Knauf. BLD has delivered US$32 million of synergies from the Headwaters acquisition and is on track to deliver a four-year synergy target of US$115 million in FY2021.
Valuation Methodology: P/E Based Valuation Approach
.png)
P/E Multiple Approach (Source: Thomson Reuters)
Note: All forecasted figures and peers have been taken from Thomson Reuters, NTM-Next Twelve Months
Stock Recommendation: As per ASX, the stock is trading slightly towards its 52-week low level of $3.930, proffering a decent opportunity for accumulation. Over the period of FY15 to FY19, the company witnessed a CAGR of 7.79% in revenue and a CAGR of 11.64% in gross profit. During FY19, EBITDA margin of the company showed an improvement on the previous year and stood at 16.1% as compared to 15.5% in FY18. Thus, considering the current trading levels, CAGR in revenue and gross profit and valuation multiples, we have valued the stock, using one relative valuation approach, i.e., Price to Earnings multiple and have arrived at a target price with higher single-digit upside (in percentage terms). Hence, we recommend a “Buy” rating on the stock at the current market price of $4.480, down by 0.444% on December 20, 2019.
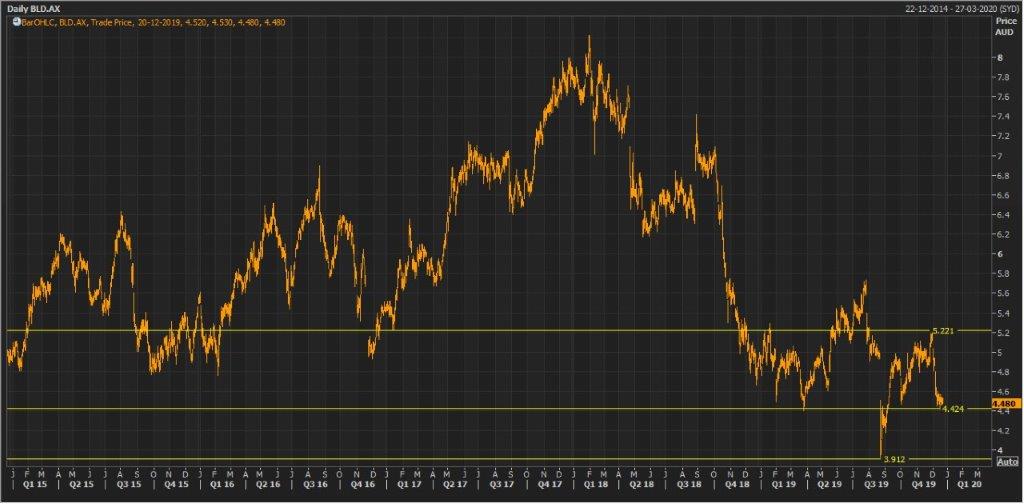
BLD Daily Technical Chart (Source: Thomson Reuters)
Collection House Limited
.png)
CLH Details
Decent Rise in Revenue and EBIT: Collection House Limited (ASX: CLH) provides debt collection services and the purchase of consumer debt. As on 20th December 2019, the market capitalisation of the company stood at $147.63 million. The company has recently announced the resignation of Anthony Rivas from the position of Managing Director and Chief Executive Officer, effective from 24 November 2019. During FY19, revenue of the company went up by 12% to $161.1 million, mainly due to the second transaction with Balbec Capital LP, PDL growth and a positive revenue recognition change under AASB 9. Earnings Before Interest & Tax (EBIT) came in at $51.3 million, up by 18% from $43.4 million in FY18. This was primarily driven by the performance and lower amortisation charge incurred under AASB 9. This resulted in the EPS of 22 cents per share, above its guidance.
.png)
Financial Performance (Source: Company Reports)
Expected Growth Opportunities: The company has started well in FY 2020 and is confident of the outlook for Cash Collections, PDL purchases and profit growth. For FY 2020, CLH has given guidance for its cash collection and expects it to be between $145 million to $155 million. Statutory EPS is expected to come between 23cps to 24cps, equating to growth of up to 14%.
Valuation Methodology: EV/Sales Valuation Multiple Approach
.png)
EV/Sales Multiple (Source: Thomson Reuters)
Note: All forecasted figures and peers have been taken from Thomson Reuters, NTM-Next Twelve Months
Stock Recommendation: As per ASX, the stock is trading close to its 52-week low of $1.03. Over the period of FY15 - FY19, the company witnessed a CAGR of 6.34% in revenue. During FY19, Return on Equity and net margin went up to 14.1% and 19.1% from 13.2% and 18.2%, respectively. Considering the current trading levels, revenue CAGR, improvement in margins and modest outlook, we have valued the stock, using one relative valuation method, i.e., EV to sales multiple and arrived at a target price of lower double-digit upside (in percentage terms). Hence, we recommend a “Buy” rating on the stock at the current market price of $1.080, up 3.846% on December 20, 2019.

CLH Daily Technical Chart (Source: Thomson Reuters)
Jupiter Mines Limited
.png)
JMS Details
Positive Cash with Low Cost of Production: Jupiter Mines Limited (ASX: JMS) is engaged in the operation of the Tshipi Manganese Mine in South Africa and the sale of manganese ore. As on 20th December 2019, the market capitalisation of the company stood at $568.11 million. The overall annualised sales of Tshipi are on track to meet FY2020 target, with its low cost of production despite the fall in manganese priceany is focusing to deliver tonnes. For the third quarter ended 30 November 2019, low grade production was ahead of the target year to date. However, Tshipi’s cost of production for the year to date stood at ZAR31.51/dmtu. For the half-year period ended 31 August 2019, Tshipi recorded a net profit after tax of ZAR1.5 billion and paid ZAR1.75 billion of dividends to its shareholders.
.png)
Tshipi net profit after tax (Source: Company Reports)
Valuation Methodology: Price to Earnings Based Valuation
.png)
P/E Based Valuation (Source: Thomson Reuters)
Note: All forecasted figures and peers have been taken from Thomson Reuters, NTM-Next Twelve Months
Stock Recommendation: As per ASX, the stock of JMS gave a return of 20.83% on YTD basis and a return of 11.54% in the last one month. The stock is inclined towards its 52-week low of $0.230. Over the period of FY15 - FY19, the company witnessed a CAGR of 56.21% in revenue. We have valued the stock using price to earnings based relative valuation method and the arrived at a target price of lower double-digit upside (in percentage terms). Hence, we recommend a “Buy” rating on the stock at the current market price of $0.280, down by 3.448% on December 20, 2019.
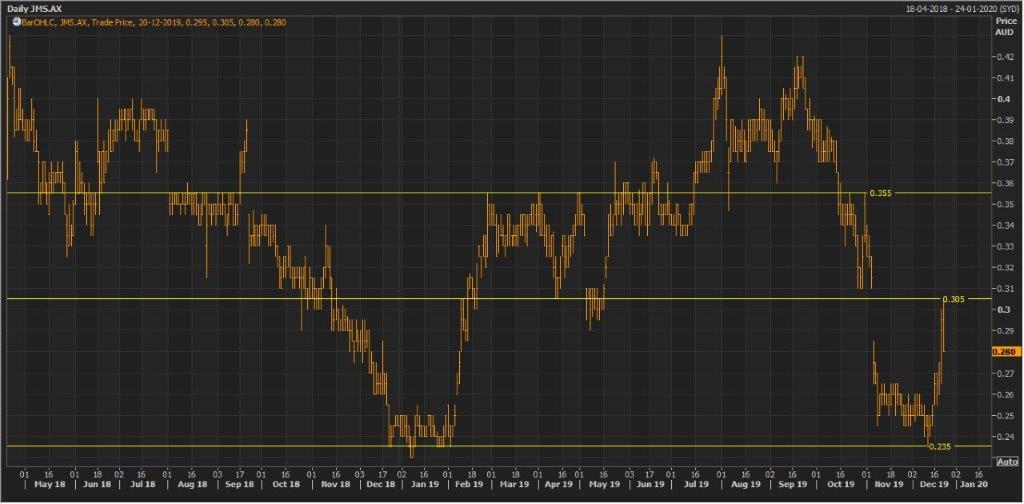
JMS Daily Technical Chart (Source: Thomson Reuters)
OceanaGold Corporation
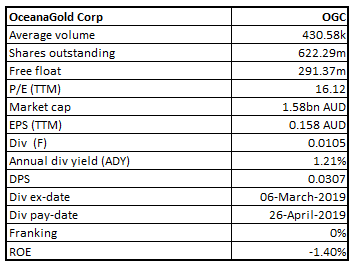
OGC Details
Extension of Credit Facility:OceanaGold Corporation (ASX: OGC) is a mid-tier, multinational gold mining company with a market capitalisation of $1.58 billion as on December 20, 2019. On 25th November 2019, the company announced that it has amended its existing $200 million Revolving Credit Facility with its banking partners, reflecting the strong confidence that the company’s lenders have in its business. The key changes include the elimination of 2019 amortisation or “step-down” with facility remaining at $200 million, combined with the extension of the facility now maturing on 31st December 2021. The company announced that Dr Nora L. Scheinkestel has resigned from the Board of Directors.
What to Expect:The company is optimistic about the growth opportunities, particularly at Waihi Gold Mine in New Zealand, where it is transitioning from existing Correnso Underground to Martha Underground. The company expects 12- month gap in production from when Correnso finishes in early 2020 to start of production from new Martha Mine. Further, the company expects broader value creation from the Waihi district study, which is expected to come out in the first half of 2020. With respect to Haile Gold Mine, the company expects to make improvements by decreasing its cost base and by increasing productivities while expanding the mine.
Valuation Methodologies: EV/Sales Valuation Approach
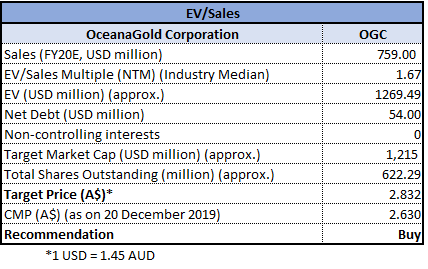
EV/Sales Valuation Approach (Source: Thomson Reuters)
Note: All forecasted figures and peers have been taken from Thomson Reuters, NTM-Next Twelve Months
Recommendation: As per ASX, the stock is trading towards its 52-week low. We have valued the stock using EV/Sales multiple based relative valuation approach and arrived at a target price of higher single-digit upside (in percentage terms). Considering the company’s extension of credit facility, its decent outlook, current trading levels and valuation, we give a “Buy” rating on the stock at the current market price of $2.630 per share, up by 3.543% on 20th December 2019.
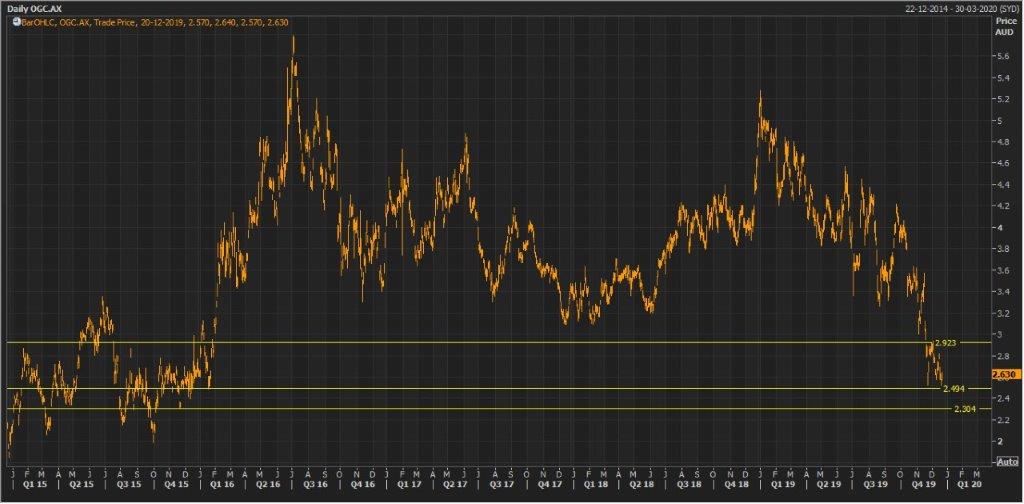
OGC Daily Technical Chart (Source: Thomson Reuters)
Disclaimer
The advice given by Kalkine Pty Ltd and provided on this website is general information only and it does not take into account your investment objectives, financial situation or needs. You should therefore consider whether the advice is appropriate to your investment objectives, financial situation and needs before acting upon it. You should seek advice from a financial adviser, stockbroker or other professional (including taxation and legal advice) as necessary before acting on any advice. Not all investments are appropriate for all people. Kalkine.com.au and associated pages are published by Kalkine Pty Ltd ABN 34 154 808 312 (Australian Financial Services License Number 425376). The information on this website has been prepared from a wide variety of sources, which Kalkine Pty Ltd, to the best of its knowledge and belief, considers accurate. You should make your own enquiries about any investments and we strongly suggest you seek advice before acting upon any recommendation. Kalkine Pty Ltd has made every effort to ensure the reliability of information contained in its newsletters and websites. All information represents our views at the date of publication and may change without notice. To the extent permitted by law, Kalkine Pty Ltd excludes all liability for any loss or damage arising from the use of this website and any information published (including any indirect or consequential loss, any data loss or data corruption). If the law prohibits this exclusion, Kalkine Pty Ltd hereby limits its liability, to the extent permitted by law to the resupply of services. There may be a product disclosure statement or other offer document for the securities and financial products we write about in Kalkine Reports. You should obtain a copy of the product disclosure statement or offer document before making any decision about whether to acquire the security or product. The link to our Terms & Conditions has been provided please go through them and also have a read of the Financial Services Guide. On the date of publishing this report (mentioned on the website), employees and/or associates of Kalkine Pty Ltd do not hold positions in any of the stocks covered on the website. These stocks can change any time and readers of the reports should not consider these stocks as advice or recommendations.
 AU
AU

 Please wait processing your request...