Lyft, Inc.
.png)
LYFT Details
Posted 63% Revenue Growth aided by Higher Active Riders: Lyft, Inc. (NASDAQ-GS: LYFT) operates as a transportation service provider and offers affordable rides to its users.
Q3FY19 Operational Highlights for the Period ended 30 September 2019: LYFT announced its quarterly highlights, wherein the company reported revenue at $955.598 million, as compared to $584.951 million in the previous corresponding period. The business reported 27% y-o-y growth in revenue per active rider at $42.82 followed by 28% y-o-y growth in active riders at 22.314 million. The company reported the cost of revenue at $580.714 million as compared to $322.614 million in the previous corresponding quarter. Research and development expenses stood higher at $288.272 million from $77.168 million in Q3FY18. Sales and marketing expenses declined to $163.858 million, as compared to $241.015 million in Q3FY18. General and administrative expenses came in at $263.820 million, as compared to $120.348 million in Q3FY18. The company reported higher a loss from operation at $490.860 million from $268.675 million in the previous corresponding quarter due to higher operating expenses. The company posted a net loss of $463.477 million as compared to $249.161 million in pcp.
.png)
Q3FY19 Business Highlights (Source: Company Reports)
Outlook: For the fourth quarter of FY19, the company expects revenue within the range between $975 million to $986 million, resulting in a growth in between 46% and 47%. Adjusted EBITDA loss for Q4FY19 is anticipated between $160 million and $170 million. Revenue for FY19 is expected between $3.57 billion and $3.58 billion with an annual growth rate of ~66% on a y-o-y basis. The company expects its FY19 adjusted EBITDA loss between $708 million and $718 million.
Valuation Methodology: Enterprise Value to Sales Multiple Approach
.png)
Enterprise Value to Sales Based Valuation (Source: Company Reports)
Note: All forecasted figures and peers have been taken from Thomson Reuters, NTM-Next Twelve Months
Stock Recommendation:The stock of LYFT is quoting at $46.84 with a market capitalization of $13.94 billion. Thebusiness reported record revenue growth driven by higher active riders and revenue per active rider, while the business intends to increase its engagement through product innovation and execution.The stock is trading close to the average of its 52-week low-high trading range of $24.86 to $48.66, respectively. Considering the above factors, we have valued the stock using one relative valuation method, i.e., Enterprise Value to Sales based approach. For this, we have taken peers like Uber Technologies Inc (NYSE: PEP), Amazon.com Inc (NYSE: AMZN) and Alphabet Inc (NASDAQ: GOOGL) and arrived at a target price with lower double-digit upside (in % terms). Hence, we give a “Buy” rating on the stock at the closing price of $46.84 per share, down by 2.84% on 29 January 2020.
.jpg)
LYFT Daily Technical Chart (Source: Thomson Reuters)
Marathon Petroleum Corporation
.png)
MPC Details
Q4FY19 Capacity Utilization Stood at 94%:Marathon Petroleum Corporation (NYSE: MPC) is a leading, integrated, downstream energy company.
Q4FY19 Operational Highlights for the Period ended 31 December 2019:The company recently released its fourth-quarter results for FY19, wherein top-line stood at $841 million as compared to $2,017 million in 4QFY18. Segment adjusted EBITDA came in at $1.5 billion, declined from $2.3 billion in Q4FY18. The business reported lowed R&M earnings due to narrower sweet and sour crude differentials partially offset by higher blended crack spreads. During the quarter, R&M margin stood at $15.55 per barrel. The capacity utilization of crude oil stood at 94%.
.png)
Q4FY Operational Highlights (Source: Company Reports)
FY19 Operational Highlights:The company posted its FY19 sales at $5576 million as compared to $5,571 million in FY18. Net income attributable to MPC during FY19 came in at $2,637 million, stood lower at $2,780 million in FY18. The company reported segment adjusted EBITDA at $4.8 billion in FY19, as compared to $5.1 billion in FY18.
Valuation Methodology: Price to Earnings Multiple Approach
.png)
Price to Earnings value Based Valuation (Source: Thomson Reuters)
Note: All forecasted figures and peers have been taken from Thomson Reuters, NTM-Next Twelve Months
Stock Recommendation:The stock of MPC is quoting at $53.59 with a market capitalization of $34.79 billion. The stock made a 52-week low and high of $43.96 to $69.65.The companyrealized a synergy of $420 million in 4QFY19, largely from Refining and Marketing segment, including $62 million from catalyst formulation improvements at multiple refineries, $55 million in crude supply optimization in the Mid-Continent region, and $15 million in marine optimization.Considering the above factors, we have valued the stock using one relative valuation method, i.e., Price to earnings multiple based approach. For this, we have taken peers like Valero Energy Corp (NYSE: VLO), Phillips 66 (NYSE: PSX), Chevron Corp (NYSE: CVX) and arrived at a target price with lower double-digit upside (in % terms). Hence, we give a “Buy” rating on the stock at the closed price of $53.59, up 1.25% as on 29 January 2020.
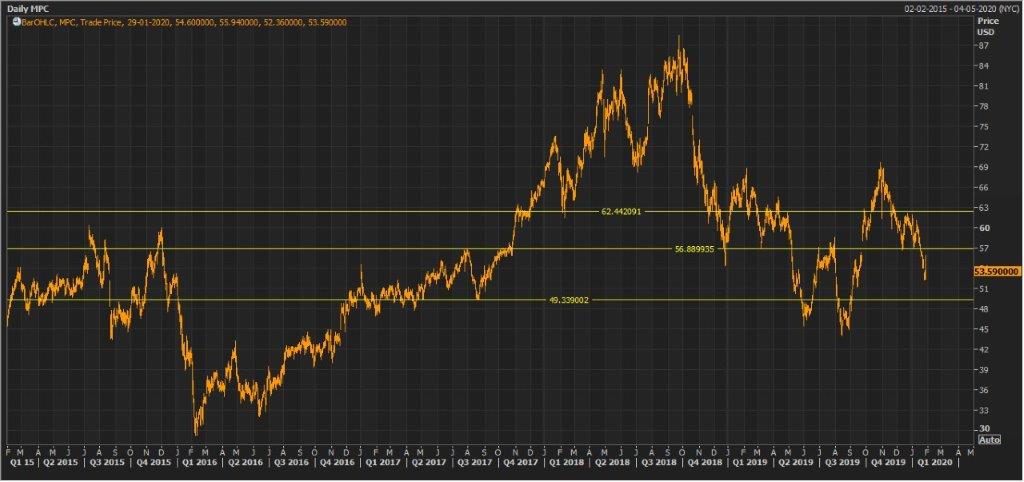
MPC Daily Technical Chart (Source: Thomson Reuters)
Exxon Mobil Corporation
.png)
XOM Details
Posted 3% y-o-y Higher Production in Q4FY19:Exxon Mobil Corporation (NYSE: XOM) operates in oil exploration and operates in both upstream and downstream activities.
Q3FY19 Operational Highlights for the Period ended 30 September 2019: XOM announced its quarterly results, wherein the company reported total revenue and other income at $65,049 million, as compared to $76,605 million in the previous corresponding period.Crude oil and product purchase stood at $35,290 million while production and manufacturing expenses stood at $8,848 million during the third quarter of FY19. The business posted its selling, general and administrative expenses at $2,753 million, as compared to $2,892 million in Q3FY18. The business reported net income, including non-controlling interests at $3,247 million, as compared to $6,446 million in the previous corresponding period.The company reported lower realizations by $1,510 million, mainly due to lower liquids realizations.
.png)
Q3FY19 Income Statement Highlights (Source: Company Reports)
Valuation Methodology: Price to Cash Flow Based Approach
.png)
Price to Cash Flow Based Valuation (Source: Company Reports)
Note: All forecasted figures and peers have been taken from Thomson Reuters, NTM-Next Twelve Months
Stock Recommendation:The stock of XOM is quoting at $64.11 with a market capitalization of $271.25 billion. The stock made a 52-week low and high of $64.63 and $83.49.During the third quarter, on an oil-equivalent basis, the business reported 3% y-o-y higher production while liquids production totaled at 2.4 million barrels per day, up 106,000 barrels per day driven by growth. Considering the above factors, we have valued the stock using one relative valuation method, i.e., Price to Cash Flow multiple approach. For this, we have taken peers like Valero Energy Corp (NYSE: VLO), Phillips 66 (NYSE: PSX), Chevron Corp (NYSE: CVX) and arrived at a target price with higher single-digit upside (in % terms). Hence, we give a “Buy” rating on the stock at the closed price of $64.11, down 0.84% as on 29 January 2020. ;
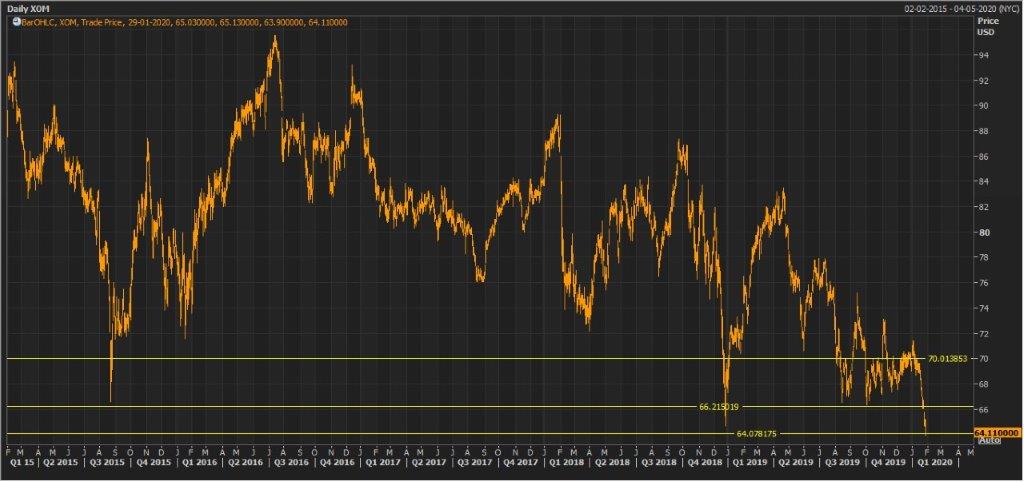
XOM Daily Technical Chart (Source: Thomson Reuters)
Dollar Tree, Inc.
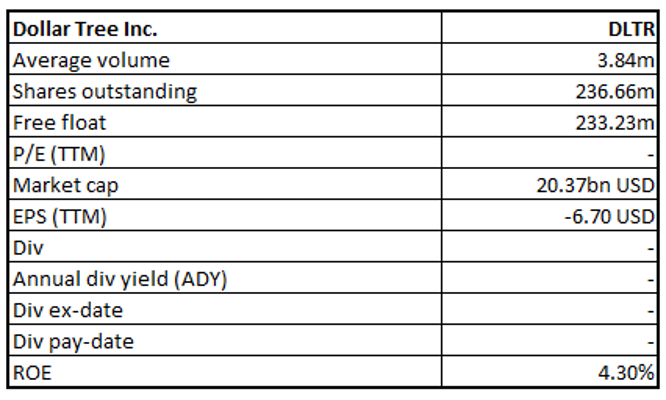
DLTR Details
Reported Improved Top-line in Q3FY19:Dollar Tree, Inc. (NASDAQ: DLTR), a Fortune 200 company, is a leading operator of discount variety stores that has served North America for more than thirty years.
3QFY19 Key Highlights for the Period ended 02 November 2019:DLTR announced its quarterly results, wherein, the company reported net sales at $5.75 billion, depicting a growth of 3.7% on y-o-y basis. Same-store sales for the Dollar Tree segment and Family Dollar segment witnessed a growth of 2.8% and 2.3%, respectively, largely aided by increases in both average ticket and transaction count.The business another robust period in terms of sales performance for both brands, Dollar Tree and Family Dollar. With the ongoing store optimization efforts and initiatives to drive sales, DLTR executed more than 1,150 Family Dollar H2 renovations, nearly 200 Dollar Tree re-banners and more than 1,000 Dollar Tree Snack Zones. Operating income came in at $358.4 million, as compared to $387.8 million in the previous corresponding period. The business reported a net income of $255.8 million as compared to $281.8 million in the previous corresponding period.
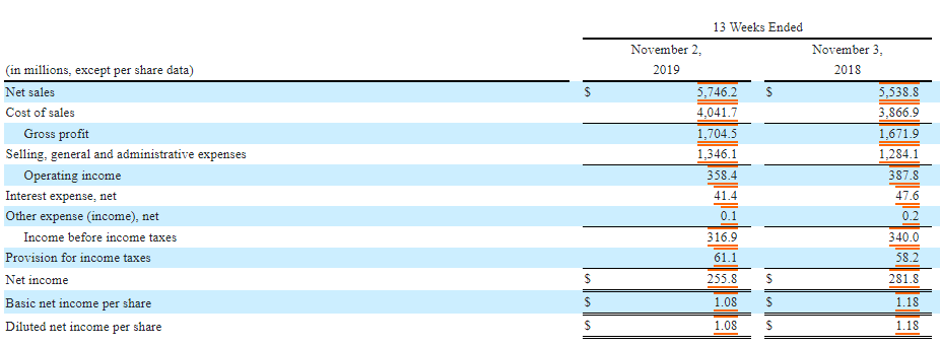
Q3FY19 Income Statement Highlights (Source: Company Reports)
Valuation Methodology: Price to Earnings Multiple Approach
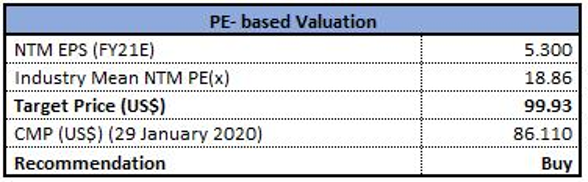
Price to Earnings value Based Valuation (Source: Thomson Reuters)
Note: All forecasted figures and peers have been taken from Thomson Reuters, NTM-Next Twelve Months
Stock Recommendation:The stock of DLTR is quoting at $86.11 with a market capitalization of $20.37 billion. The stock is trading near the lower band of its 52-week trading range of $86.19 to $119.71. The business has a wider presence across more than 15,200 retail discount stores spread over 48 states and five Canadian provinces while it reported a y-o-y growth of 2.4% in comparable store net sales on a constant currency term during Q3FY19. Considering the above factors, we have valued the stock using one relative valuation method, i.e., Price to earnings multiple approach. For this, we have taken peers like Walmart Inc (NYSE: WMT), Target Corp (NYSE: TGT), Kroger Co (NYSE: KR), etc. and arrived at a target price with lower double-digit upside (in % terms). Hence, we give a “Buy” rating on the stock at the closed price of $86.11, down 0.75% as on 29 January 2020.
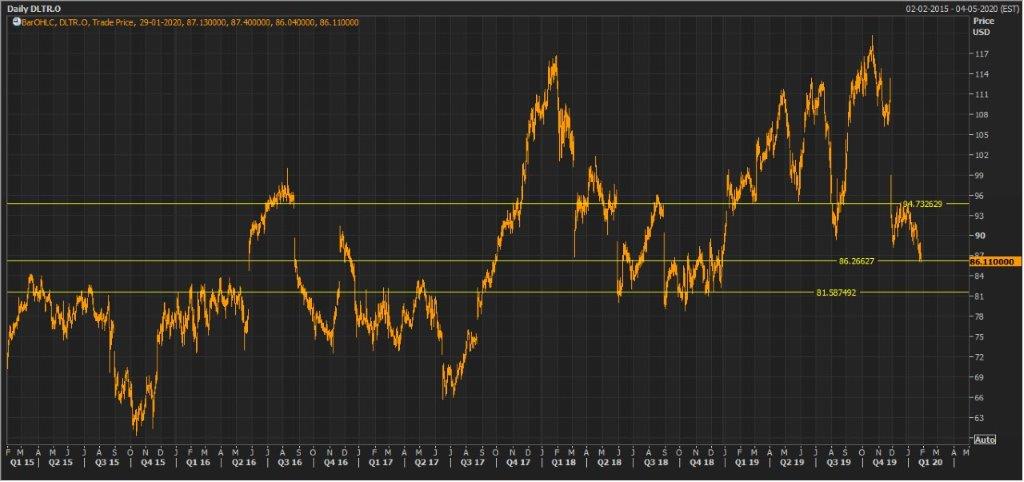
DLTR Daily Technical Chart (Source: Thomson Reuters)
Disclaimer
The advice given by Kalkine Pty Ltd and provided on this website is general information only and it does not take into account your investment objectives, financial situation or needs. You should therefore consider whether the advice is appropriate to your investment objectives, financial situation and needs before acting upon it. You should seek advice from a financial adviser, stockbroker or other professional (including taxation and legal advice) as necessary before acting on any advice. Not all investments are appropriate for all people. Kalkine.com.au and associated pages are published by Kalkine Pty Ltd ABN 34 154 808 312 (Australian Financial Services License Number 425376). The information on this website has been prepared from a wide variety of sources, which Kalkine Pty Ltd, to the best of its knowledge and belief, considers accurate. You should make your own enquiries about any investments and we strongly suggest you seek advice before acting upon any recommendation. Kalkine Pty Ltd has made every effort to ensure the reliability of information contained in its newsletters and websites. All information represents our views at the date of publication and may change without notice. To the extent permitted by law, Kalkine Pty Ltd excludes all liability for any loss or damage arising from the use of this website and any information published (including any indirect or consequential loss, any data loss or data corruption). If the law prohibits this exclusion, Kalkine Pty Ltd hereby limits its liability, to the extent permitted by law to the resupply of services. There may be a product disclosure statement or other offer document for the securities and financial products we write about in Kalkine Reports. You should obtain a copy of the product disclosure statement or offer document before making any decision about whether to acquire the security or product. The link to our Terms & Conditions has been provided please go through them and also have a read of the Financial Services Guide. On the date of publishing this report (mentioned on the website), employees and/or associates of Kalkine Pty Ltd do not hold positions in any of the stocks covered on the website. These stocks can change any time and readers of the reports should not consider these stocks as advice or recommendations.
 AU
AU

 Please wait processing your request...