Facebook, Inc.
.png)
FB Details
To Pay $550 million over a Privacy Lawsuit:Facebook, Inc. (NASDAQ: FB) builds useful and engaging products that enable users to connect and share with friends and family via mobile devices, personal computers, virtual reality headsets, and in-home devices.
FY19 Operational Highlights for the Period ended 31 December 2019:FB announced its fourth-quarter and annual results, wherein top-line posted a growth of 25% to $21,082 million in the quarter. Total cost and expenses, and higher tax provisions impacted the net income during the quarter which came in at $7,349 million with a yoy growth of 7%. On similar lines, diluted EPS at $2.56 in Q4FY19 posted a growth of 8% on yoy basis. FY19 revenue stood at $70,697 million, up 27% on y-o-y basis.Advertising revenue stood at $69,855 million as compared to $55,013 million in the previous corresponding period.Research and development expenses stood at $13,600 million as compared to $10,273 million in FY18. Research and development expense as a percentage of the total revenue stood at 19% during FY19. Marketing and sales expenses stood at $9,876 million, up 26% on y-o-y basis on account of higher marketing cost, payroll and benefits cost, and community and product operations costs. The company reported general and administrative expenses at $10,465 million, higher than $3,451 million in FY18, due to $5 billion FTC settlement expenses recorded in the first six months of FY19 and an increase in other legal-related costs. Net income came in at $18,485 million as compared to $22,112 million in FY18.
On 02 December 2019, the company filed a petition with the U.S. Supreme Court seeking review of the decision of the Ninth Circuit, which was rejected. However, on January 15, 2020, the parties agreed to a settlement amount of $550 million, which is likely to be paid by FB, subject to the approval by the court.
.png)
FY19 Financial Highlights (Source Company Reports)
Valuation Methodology: Enterprise Value to Sales Multiple Approach
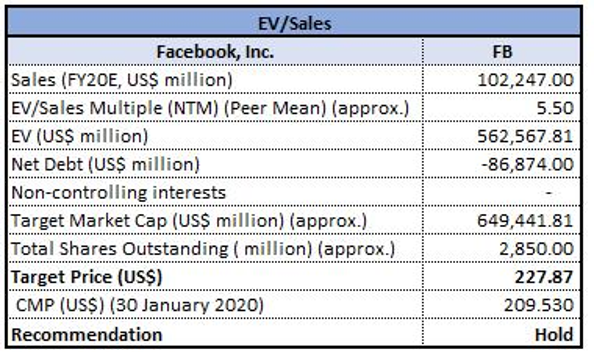
Enterprise Value to Sales Based Valuation (Source: Company Reports)
Note: All forecasted figures and peers have been taken from Thomson Reuters, NTM-Next Twelve Months
Stock Recommendation:The stock of FB is quoting at $209.53 with a market capitalization of $597.52 billion. The stock is trading at the upper band of its 52-week low-high of $145.7 - $224.2, respectively. The stock has delivered a positive return of 2.085% and 9.329% during the last one month and three months, respectively. The company reported a strong financial year as the community and business continue to grow, while the business is focused on building services that help people to stay connected. Considering the current trading levels, price movement and business prospect, we have valued the stock using Enterprise Value (EV) to Sales based relative valuation method. For this, we have taken peers like Apple Inc (NYSE: FB), Twitter Inc (NYSE: TWTR) Alphabet Inc (NASDAQ: GOOG), etc., and arrived at a target price with higher single-digit upside (in % terms). Hence, we give a “Hold” rating on the stock at the closing price of $209.53 per share, down by 6.14% as on 30 January 2020.
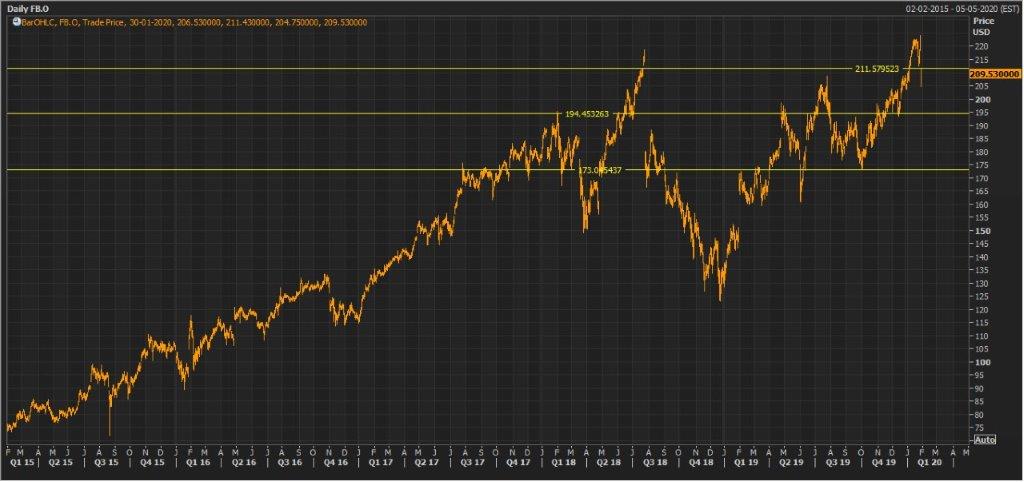
FB Daily Technical Chart (Source: Thomson Reuters)
Alphabet Inc.
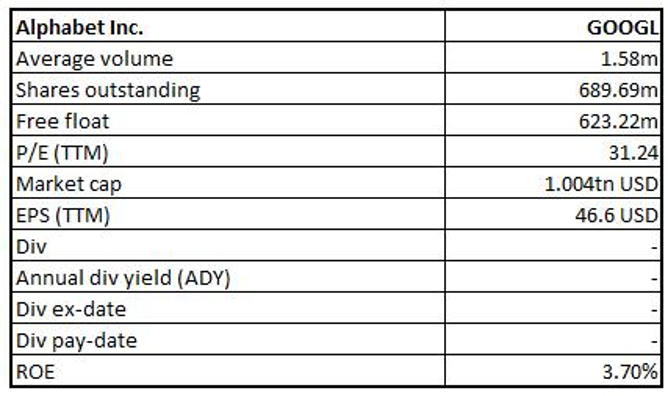
GOOGL Details
Top-line Grew by 20% on y-o-y Basis: Alphabet Inc. (NASDAQ: GOOGL) offers a wide range of products and services likeSearch engine, Maps, Ads, Gmail, Android, Chrome, Google Cloud and YouTube.
Q3FY19 Operational Highlights for the Period ended 30 September 2019: GOOGL during the period, reported revenue of $40,499 million, up 20% on y-o-y basis. The business derived robust growth from Google properties revenues segment at $28,647 million, as compared to $24,054 million in the previous corresponding quarter.Cost of revenue and research & development (R&D) expense stood higher at $17,568 million and $6,554 million, respectively, from $14,281 million and $5,232 million, during the previous corresponding period. During the quarter, R&D expenses stood at 16.2% as a percentage of revenue as compared to 15.5% in pcp. The increase was due to higher compensation expenses and facilities-related costs of $1,017 million, followed by a 21% increase in manpower. Sales and marketing expenses came in at $4,609 million as compared to $3,849 million in the previous corresponding period. The increase was due to higher compensation expenses and facilities-related costs followed by an increase in the advertising and promotional expenses related to higher marketing and promotion-related expenses for Google Search and hardware. Net income stood at $7,068 million as compared to $9,192 million in Q3FY18.
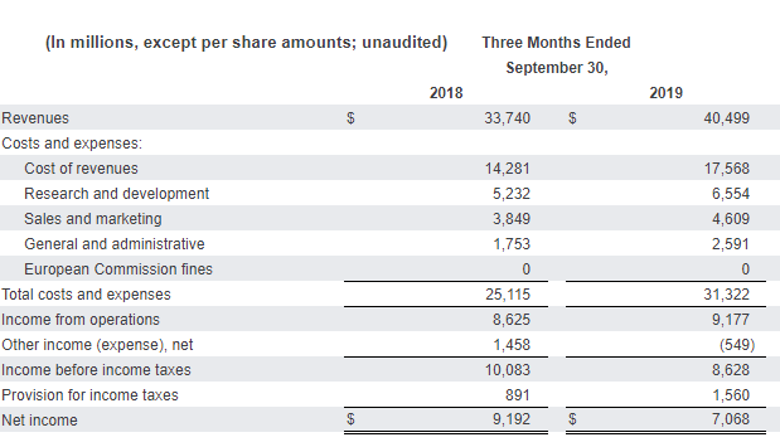
Q3FY19 Income Statement Highlights (Source: Company Reports)
Valuation Methodology: Price to Earnings Multiple Approach
.png)
Price to Earnings value Based Valuation (Source: Thomson Reuters)
Note: All forecasted figures and peers have been taken from Thomson Reuters, NTM-Next Twelve Months
Stock Recommendation:The stock closed at $1,454.25 with a market capitalization of $1,002 billion. The stock is trading at the upper band of its 52-week low-high trading range of $1,027 to $1,500.58, respectively. The stock has delivered a positive return of 8.57% and 15.52% during the last one month and three months, respectively. The business continues to invest thoughtfully in talent and infrastructure to support business expansion, primarily in new avenues like cloud and machine learning. Considering the above factors, we have valued the stock using one relative valuation method, i.e., Price to earnings multiple based approach. For this, we have taken peers like Facebook Inc (NYSE: FB), Twitter Inc (NYSE: TWTR), Netflix Inc (NASDAQ: NFLX), etc., and arrived at a target price with lower double-digit upside (in % terms). Hence, we give a “Hold” rating on the stock at the closing price of $1,454.25 per share, down by 0.17% on 30 January 2020.
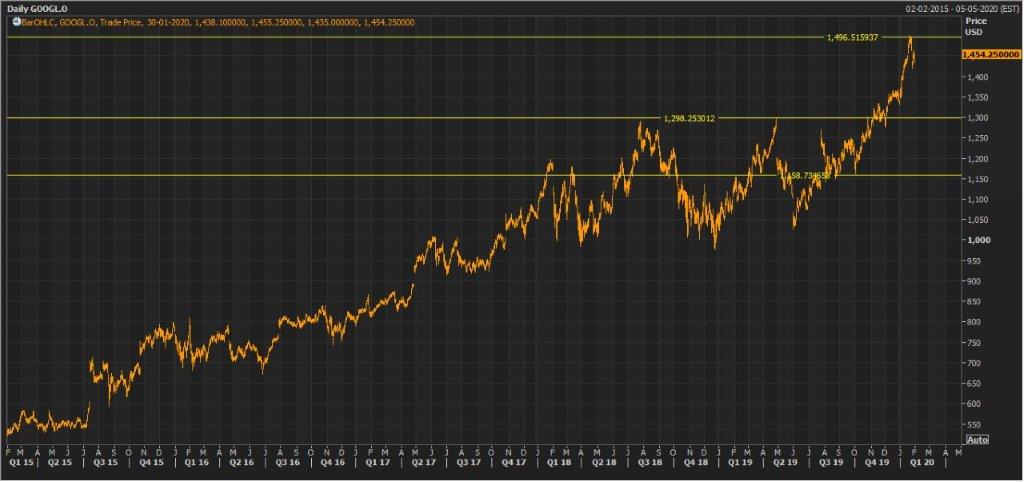
GOOGL Daily Technical Chart (Source: Thomson Reuters)
Tesla, Inc.
TSLA Details
Posted Q4FY19 Operating Margin at 4.9%:Tesla, Inc. (NASDAQ: TSLA) designs, develops, manufactures and sells high-performance fully electric vehicles (EV) and energy generation and storage systems. Additionally, the company installs and maintains such energy systems and sells solar electricity.
4QFY19 Earnings Highlights: The company recently announced its fourth-quarter and full-year results and with this, 2019 proved to be a turning point for TESLA. The company recorded a $359 million GAAP operating income in 4QFY19 with an operating margin at 4.9%. Net income on GAAP stood at $105 million, whereas non-GAAP net income (ex-SBC) came in at $386 million in 4QFY19. Cash and cash equivalent increased to $6.3 billion with free cash flow at $1.0 billion in the quarter, driven by persistent cost control across the business. The company started the production of Model Y in January 2020, which is ahead of schedule. The above model is expected to drive EPA range between 280 miles to 315 miles.
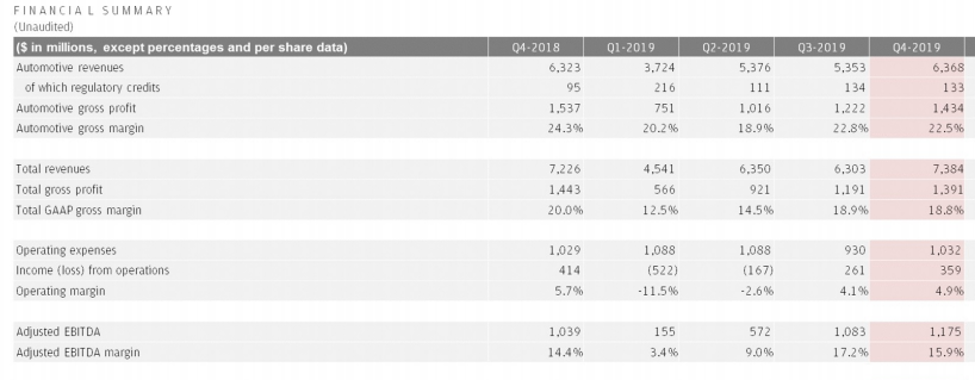
Q4FY19 Financial Highlights (Source: Company Reports)
Guidance:For FY20, the company expects vehicle deliveries to comfortably surpass 500,000 units. Solar and storage deployments are likely to grow at least 50% in FY20. On the profitability front, the company expects a positive GAAP bottom-line, with possible temporary exceptions. The company will continue to focus on continuous volume growth, capacity expansion, and cash generation. The company also updated that the production ramp of Model Y in Fremont has started and is ahead of schedule. Model 3 production in Shanghai continues to ramp while Model Y production in Shanghai is likely to start in 2021.
Stock Recommendation:The stock made its new 52-week high of $650.88 after soaring more than 10% and closed at $640.81 on 30 January 2020 as the results threw surprise in terms of net income and outlook for FY20. The stock has generated stellar returns of 53.18% and 103.48% in the last one month and three months, respectively. Considering the latest results, TSLA’s addressable market for EV, volume growth trajectory, and cash flow generation, we recommend a ‘Hold’ rating on the stock at the closing price of $640.81, up 10.3% as on 30 January 2020.
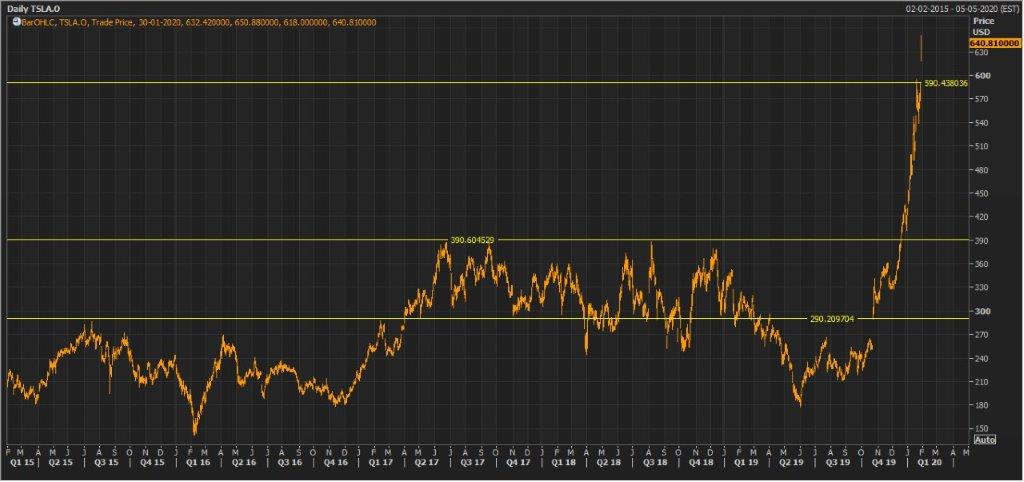
TSLA Daily Technical Chart (Source: Thomson Reuters)
Apple Inc.
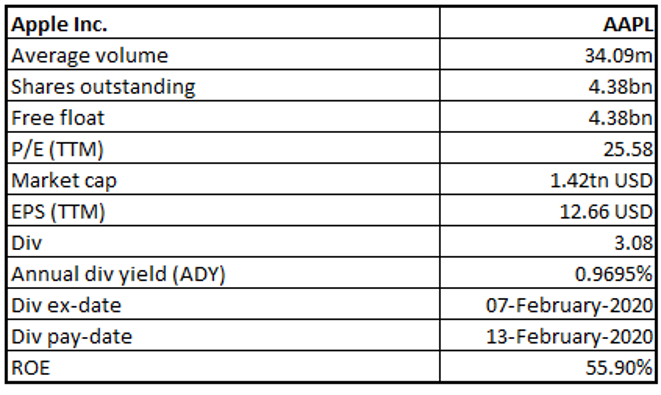
AAPL Details
Reported Robust Bottom-line Growth: Apple Inc. (NASDAQ: AAPL)operates in the manufacturing and selling of mobile phones, computers and other electronic gadgets.
Q1FY20 Operational Highlights for the Period ended 28 December 2019: AAPL reported its full-year results, wherein the company posted revenue of $91,819 million as compared to $84,310 million in the previous corresponding period. The business reported gross margin at $35,217 million, improved from $32,031 million in Q1FY18. Research and development expenses stood at $4,451 million as compared to $3,902 million in Q1FY18. The company posted its selling, general and administrative expenses at $5,197 million as compared to $4,783 million in the previous corresponding period. The company reported its operating income and net income at $25,569 million and $22,236 million as compared to $23,346 million and $19,965 million during the previous corresponding quarter.
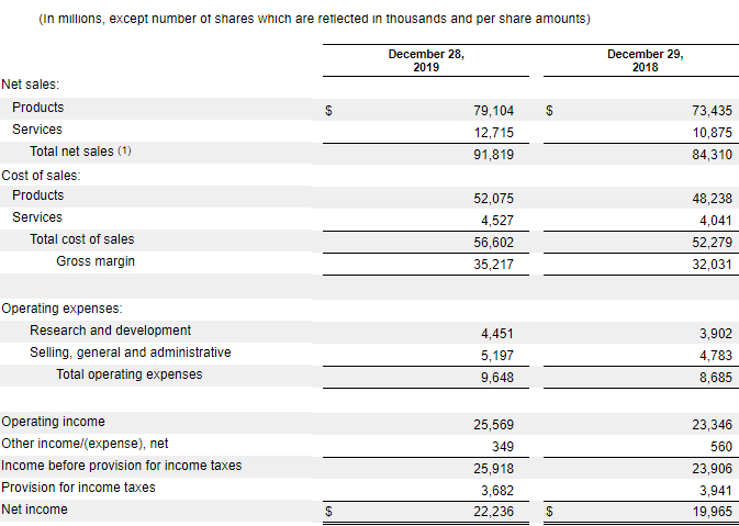
Q1FY20 Income Statement Highlights (Source: Company Reports)
Guidance:The management expects its Q2FY20 revenue within the range of $63 billion and $67 billion while gross margin is expected between 38% and 39%. The company expects its operating expenses between $9.6 billion and $9.7 billion. Tax rate during Q2FY20 is expected at ~16.5%.
Valuation Methodology: Price to Cash Flow based Valuation
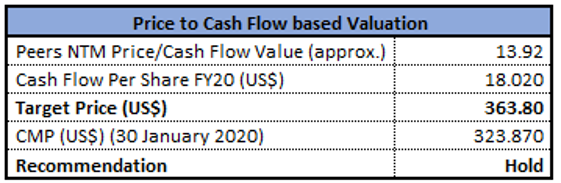
Price to Cash Flow value-based Valuation (Source: Thomson Reuters)
Note: All forecasted figures and peers have been taken from Thomson Reuters, NTM-Next Twelve Months
Stock Recommendation:The stock of AAPL closed at $323.87 with a market capitalization of $1,419 billion. The stock is trading at the upper band of its 52-week trading range of $160.23 - $327.85, respectively. The stock has delivered a positive return of 10.29% and 30.19% during the last one month and three months, respectively.The company returned ~$25 billion to its shareholders during Q1FY20, which includes $20 billion in share repurchases and $3.5 billion in the form of dividends and equivalents. Considering the above factors, we have valued the stock using Price to Cash Flow based relative valuation method. For this, we have taken peers like Microsoft Corp (NYSE: MSFT), Motorola Solutions Inc (NYSE: MSI), Cisco Systems Inc (NASDAQ: CSCO), etc., and arrived at a target price with lower double-digit upside (in % terms). Hence, we give a “Hold” rating on the stock at the closing price of $323.87 per share, down by 0.14% on 30 January 2020.
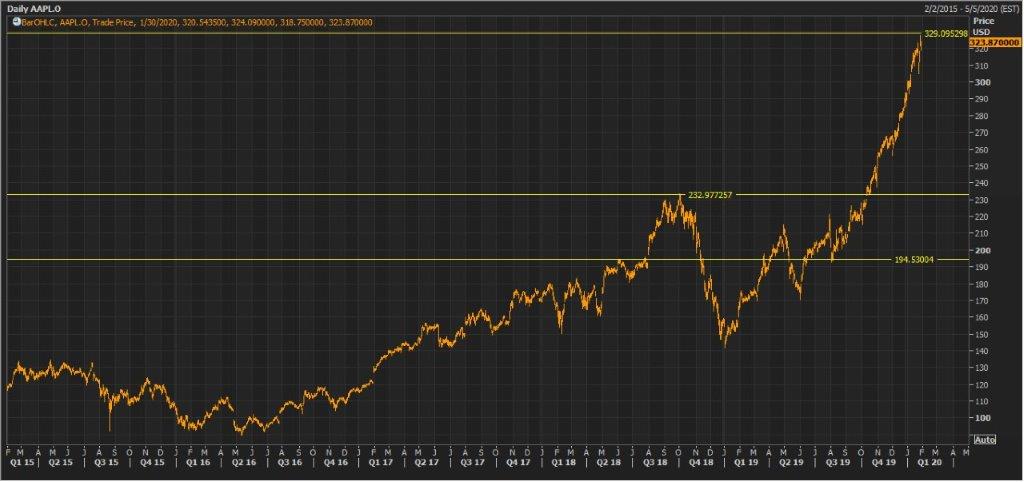
AAPL Daily Technical Chart (Source: Thomson Reuters)
Disclaimer
The advice given by Kalkine Pty Ltd and provided on this website is general information only and it does not take into account your investment objectives, financial situation or needs. You should therefore consider whether the advice is appropriate to your investment objectives, financial situation and needs before acting upon it. You should seek advice from a financial adviser, stockbroker or other professional (including taxation and legal advice) as necessary before acting on any advice. Not all investments are appropriate for all people. Kalkine.com.au and associated pages are published by Kalkine Pty Ltd ABN 34 154 808 312 (Australian Financial Services License Number 425376). The information on this website has been prepared from a wide variety of sources, which Kalkine Pty Ltd, to the best of its knowledge and belief, considers accurate. You should make your own enquiries about any investments and we strongly suggest you seek advice before acting upon any recommendation. Kalkine Pty Ltd has made every effort to ensure the reliability of information contained in its newsletters and websites. All information represents our views at the date of publication and may change without notice. To the extent permitted by law, Kalkine Pty Ltd excludes all liability for any loss or damage arising from the use of this website and any information published (including any indirect or consequential loss, any data loss or data corruption). If the law prohibits this exclusion, Kalkine Pty Ltd hereby limits its liability, to the extent permitted by law to the resupply of services. There may be a product disclosure statement or other offer document for the securities and financial products we write about in Kalkine Reports. You should obtain a copy of the product disclosure statement or offer document before making any decision about whether to acquire the security or product. The link to our Terms & Conditions has been provided please go through them and also have a read of the Financial Services Guide. On the date of publishing this report (mentioned on the website), employees and/or associates of Kalkine Pty Ltd do not hold positions in any of the stocks covered on the website. These stocks can change any time and readers of the reports should not consider these stocks as advice or recommendations.
 AU
AU

 Please wait processing your request...