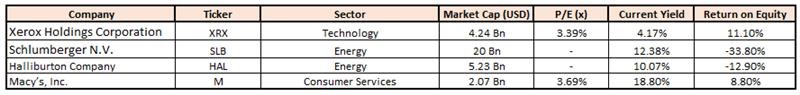
Stocks’ Details
Xerox Holdings Corporation
XRX Acquires Digitex Canada for an Undisclosed Amount: Xerox Holdings Corporation (NYSE: XRX) is a workplace technology company, which is engaged in developing and incorporating software and hardware for organizations of large and small sizes. On 6 March 2020, the company announced that it has bought Digitex Canada, a provider of independent services, software and technology.
Fourth Quarter of FY19 Key Highlights: During the quarter, XRX reported revenues of $2,444 million, down from $2,498 million reported in the year-ago quarter. Revenues for the quarter consisted of a transaction of $77 million related to an OEM license agreement with Fuji Xerox, which was received from FUJIFILM Holdings. Gross margin, during the quarter, stood at 41.6%, as compared to 40% reported in the year-ago quarter. Adjusted EPS for the period came in at $1.33 per share, up from $0.94 per share reported in the year-ago period. The company derives its major chunk of revenue from the Post sale revenue segment, representing ~75% of the total revenue. Equipment sales business accounts for the remaining 25% of XRX’s income.

4HFY19 Key Highlights (Source: Company Reports)
Outlook: For FY20, the company expects adjusted earnings to be in the range of $3.6 and $3.7 per share. It further expects revenues to decline ~4% at constant currency. Adjusted operating margin for FY20 is expected to be ~13%. Operating cash flow from continuing operations is expected to be around $1.3 billion and free cash flow is expected to be ~$1.2 billion
Valuation Methodology:P/E Multiple Based Relative Valuation
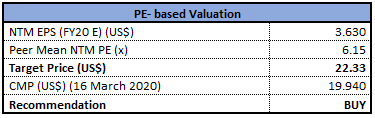
P/E Multiple Based Valuation (Source: Thomson Reuters)
Note: All the forecasted figures are taken from Thomson Reuters, NTM: Next Twelve Months
Stock Recommendation: The stock made a new 52-week low of $17 as on 16 March 2020 and closed at $19.94 with a market capitalization of $4.24 billion. Going forward, the business remains focused on robust innovation capabilities to expand its revenue trajectory by leveraging new and prevailing markets.Considering the aforesaid facts, we have valued the stock using the P/E based relative valuation method. For the purpose, we have taken peers like HP Inc (NYSE: HPQ), NetApp Inc (NASDAQ: NTAP), Hewlett Packard Enterprise Co (NYSE: HPE), and arrived at a target price which is offering a lower double-digit upside (in % terms). Hence, we give a ‘Buy’ recommendation on the stock at the closing price of $19.94, down 16.78% as on 16 March 2020.
Schlumberger N.V.
Higher International Revenues a key Positive: Schlumberger N.V. (NYSE: SLB) is engaged in providing technology for reservoir categorization, production drilling, & processing to the oil and gas industry. The company is set to report its first-quarter FY20 results on 17 April 2020.
4QFY19 Financial Highlights for the Period ended 31 December 2019: During the period, the company reported total revenue at $8,228 million, up marginally 1% year over year. The company reported a net loss at $333 million as compared to a profit of $538 million in the year ago period. International revenues for the period increased 8% year over year to $5.7 billion. North America revenues stood at $2.5 billion, plummeting 14% sequentially, owing to cash flow limitations as well as customer budget exhaustion. Earnings per share for the quarter came in at 24 cents per share, down 38% year over year.
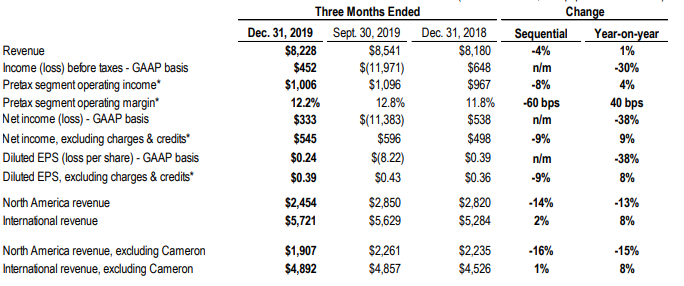
4QFY19 Income Statement Highlights (Source: Company Reports)
Cash Flow & Balance Sheet Details: Cash flow from operations came in at $2.3 billion, whereas free cash flow was $1.5 billion. As of 31 December 2019, the company had ~$2,167 million in cash and short-term investments. Long-term debt stood at $14,770 million, this depicted a debt-to-capitalization ratio of 38.8%.
Outlook: For FY20, the company expects capex spending to be ~$1.7 billion, in-line with FY19. The company remains positive on the growth of its international market, on the back of deepwater activity.
Valuation Methodology: Price to Earnings Multiple Based Relative Valuation
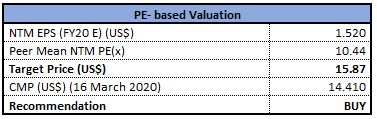
Price to Earnings value Based Valuation (Source: Thomson Reuters)
Note: All forecasted figures and peers have been taken from Thomson Reuters, NTM-Next Twelve Months
Stock Recommendation: The stock of SLB is quoting at $14.41 with a market capitalization of $20 billion. The stock is trading below the average of its 52-week high and low trading range of $48.88 to $12.91, respectively. The increase in international markets as well as robust SIS digital software sales were key positives. Considering the above factors, we have valued the stock using price to earnings multiple based relative valuation method. For this, we have taken peers like National Oilwell Varco Inc (NYSE: NOV), Halliburton Co (NYSE: HAL) and Baker Hughes Co (NYSE: BKR) and arrived at a target price with lower double-digit upside (in % terms). Hence, we give a “Buy” recommendation on the stock at the current market price of $14.41, down 10.83% as on 16 March 2020.
Halliburton Company
International Expansion Remains a Key Catalyst: Halliburton Company (NYSE: HAL) is a top supplier of products and services to the energy industry. The company has two reportable segments namely the Completion and Production segment, and the Drilling and Evaluation segment.
4QFY19 Financial Highlights for the Period ended 31 December 2019: The company reported total revenues of $5,191 million as compared to $5,936 million reported in the year-ago period. Revenue from the Drilling and Evaluation increased 4%, sequentially, and came in at $2.1 billion, on the back of robust activity across all product and in Middle East & Asia. On an adjusted basis, the company reported net income of $285 million, compared to $358 million reported in the previous year quarter. Adjusted net income per share for the quarter stood at 32 cents per share as compared to 41 cents per share in the year-ago period. Cash and cash equivalent at the end of 31 December 2019, came in at $2,268 million.
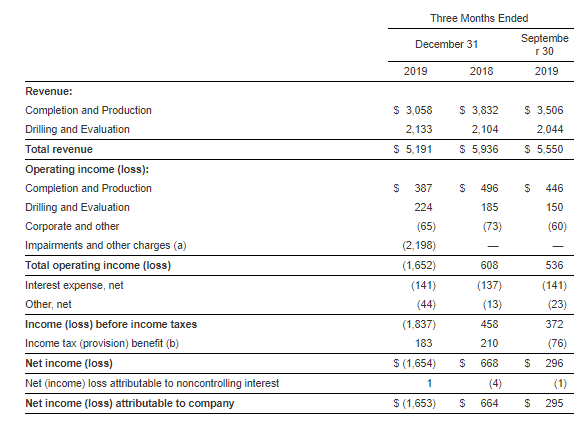
4QFY19 Income Statement Highlights (Source: Company Reports)
Geographical Contribution: During the quarter, revenues from North America came in at $2,333 million, down from $3,341 million. Revenues from Latin America stood at $598 million, down from $607 million reported in the year ago period.Revenues from Europe and Middle East/Asia stood at $883 million and $1,377 million, respectively.
Outlook: HAL remains on track to strengthen its product service lines with a continuous focus on organic growth, investment and acquisitions. Additionally, the company is consistently working to increase operational efficiencies to improve productivity, cost reduction, while enhancing shareholders’ value.
Valuation Methodology: P/CF Multiple Based Relative Valuation
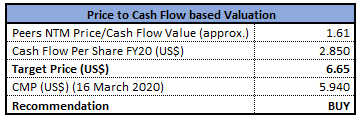
P/CF Based Valuation (Source: Thomson Reuters)
Note: All forecasted figures have been taken from Thomson Reuters, NTM: Next Twelve Months
Stock Recommendation: The stock of HAL witnessed a sharp fall in the last few trading sessions, taking cues from the falling crude oil prices. The stock made a new 52-week low of $5.8 as on 16 March 2020 and closed at $5.94 with a market capitalization of $5.23 billion. The company is aiding its business through international growth, disciplined capital allocation and pricing improvements. Considering the aforesaid facts, current trading levels, business prospects, etc., we have valued the stock using Price to Cash flow based relative valuation method. For this, we have considered peers like Helmerich and Payne Inc (NYSE: HP), Nabors Industries Ltd (NYSE: NBR), Transocean Ltd (NYSE: RIG), to name few., and arrived at a target price which is offering a lower double-digit upside (in % terms). Hence, we give a ‘Buy’ recommendation on the stock at the closing price of $5.94, down 16.92% as on 16 March 2020.
Macy’s, Inc.
Meeting Customer’s Demand & Executing Polaris Strategy are Key Catalysts: Macy’s, Inc. (NASDAQ: M) sells a wide range of merchandise, including apparel and accessories (men’s, women’s and kids'), cosmetics, home furnishings and other consumer goods.
4QFY19 Financial Highlights: During the quarter, the company reported adjusted earnings of $2.12 per share, as compared to $2.73 per share reported in the year-ago period. The department store chain reported net sales of $8,337 million, as compared to $8,455 million reported in the year-ago period. Comparable sales on an owned plus licensed basis declined marginally 0.5%. Revenues from owned basis fell 0.6%. Adjusted EBITDA declined from $1,399 million to $1,160 million. During FY19, the company underlined on Polaris strategy in order to improve its operating performance in the coming years. The company exited the period with cash and cash equivalents of $685 million. Long-term debt amounted to $3,621 million at the end of the period.
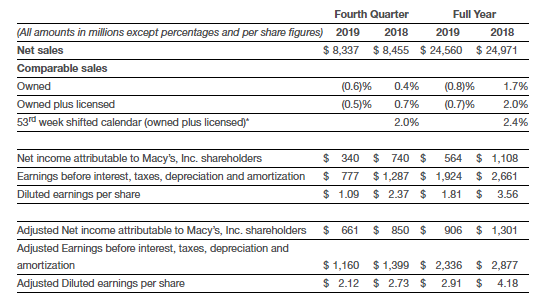
Key Financial Highlights (Source: Company Reports)
Outlook: For FY20, the company anticipates net sales to be in the ambit of $23.6 billion to $23.9 billion. Adjusted EPS is likely to be in the band of $2.45 to $2.65. The company expects gains from asset sale of ~$100 million. Annual tax rate is expected at ~23.25%.
Valuation Methodology:EV/Sales Multiple Based Relative Valuation
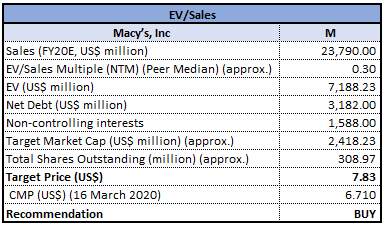
EV/Sales Based Valuation (Source: Thomson Reuters)
Note: All forecasted figures have been taken from Thomson Reuters, NTM: Next Twelve Months
Stock Recommendation: The stock of M closed at $6.71 with a market capitalization of ~$2.07 billion. The stock made a 52-week low and high of $6.5 and $26.33 and is currently trading at the lower band of its 52-week trading range. Notably, Macy’s continues to focus on price optimization, merchandise planning and private label offering to meet customer-oriented demand, that remains key positives for the company. Considering the aforesaid facts, current trading levels, recent price movements and the company’s brand presence, we have valued the stock using Enterprise Value (EV) to Sales based relative valuation method. We have considered peers like Kohls Corp (NYSE: KSS), L Brands Inc (NYSE: LB), Gap Inc (NYSE: GPS) and arrived at a target price of lower double-digit upside (in % terms). Hence, we recommend a ‘Buy’ rating on the stock at the closing price of $6.71, down 16.44% as on 16 March 2020.
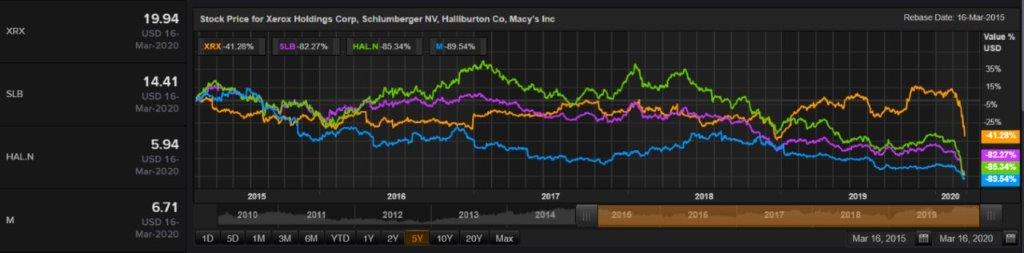
Comparative Price Chart (Source: Thomson Reuters)
Disclaimer
The advice given by Kalkine Pty Ltd and provided on this website is general information only and it does not take into account your investment objectives, financial situation or needs. You should therefore consider whether the advice is appropriate to your investment objectives, financial situation and needs before acting upon it. You should seek advice from a financial adviser, stockbroker or other professional (including taxation and legal advice) as necessary before acting on any advice. Not all investments are appropriate for all people. Kalkine.com.au and associated pages are published by Kalkine Pty Ltd ABN 34 154 808 312 (Australian Financial Services License Number 425376). The information on this website has been prepared from a wide variety of sources, which Kalkine Pty Ltd, to the best of its knowledge and belief, considers accurate. You should make your own enquiries about any investments and we strongly suggest you seek advice before acting upon any recommendation. Kalkine Pty Ltd has made every effort to ensure the reliability of information contained in its newsletters and websites. All information represents our views at the date of publication and may change without notice. To the extent permitted by law, Kalkine Pty Ltd excludes all liability for any loss or damage arising from the use of this website and any information published (including any indirect or consequential loss, any data loss or data corruption). If the law prohibits this exclusion, Kalkine Pty Ltd hereby limits its liability, to the extent permitted by law to the resupply of services. There may be a product disclosure statement or other offer document for the securities and financial products we write about in Kalkine Reports. You should obtain a copy of the product disclosure statement or offer document before making any decision about whether to acquire the security or product. The link to our Terms & Conditions has been provided please go through them and also have a read of the Financial Services Guide. On the date of publishing this report (mentioned on the website), employees and/or associates of Kalkine Pty Ltd do not hold positions in any of the stocks covered on the website. These stocks can change any time and readers of the reports should not consider these stocks as advice or recommendations.
 AU
AU

 Please wait processing your request...