Marathon Petroleum Corporation
.png)
MPC Details
Reported Higher Pipeline Throughputs of 5,245 mbpd: Marathon Petroleum Corporation (NYSE: MPC) is a leading integrated, downstream energy company, which operates through branded locations within the United States, including Marathon brand retail outlets.
FY19 Operational Highlights for the Period ended 31 December 2019: MPC declared its full-year results, wherein the company reported total revenue and other income of $124,880 million, up from $97,102 million in FY18. The increase was due to an increase in the Refining & Marketing segment refined product sales volumes on account of theacquisition of Andeavor. Despite growth in the top line, the business reported income from operations of $5,576 million, up marginally from $5,571 million in FY18. The year was marked by increase in cost of revenue, depreciation expense and selling, general and administrative expenses. The business reported its Pipeline throughputs at 5,245 thousand barrels per day (mbpd), up from 4,177 mbpd in FY18.
.png)
FY19 Income Statement Highlights (Source: Company Reports)
Outlook: For Q1FY20, the company expects the refining and marketing segment to report refining operating costs per barrel at $6.05, while distribution cost is expected at around ~$1,300 million. Depreciation and amortization expenses for the segment are expected at $440 million.
Valuation Methodology: Price to Earnings Multiple Based Relative Valuation
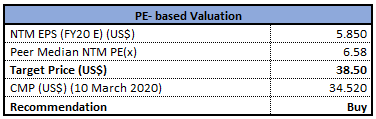
Price to Earnings Based Relative Valuation (Source: Thomson Reuters)
Note: All the forecasted figures are taken from Thomson Reuters, NTM: Next Twelve Months
Stock Recommendation:The stock of MPC is closed at $34.52 with a market capitalization of ~$22.42 billion. The stock made a 52-week low and high of $30.78 and $69.65 and is currently trading at the lower band of the range. With continuous progress of high grading its midstream project backlog, MPLX is targeting positive free cash flow, after capital investments and distributions, in 2021. The stock has corrected 41.16% and 36.63% in the last three months and six-months, respectively. Considering the aforesaid facts, current trading levels and business prospects, we have valued the stock using Price to Earnings based relative valuation method. For the purpose, we have considered peers like Valero Energy Corp (NYSE: VLO), Phillips 66 (NYSE: PSX), PBF Energy Inc (NYSE: PBF), etc., and arrived at a target price with a lower double-digit upside (in % terms). Hence, we give a ‘Buy’ recommendation on the stock at the closing price of $34.52, up 2.07% as on 10th March 2020.
Exxon Mobil Corporation
.png)
XOM Details
Reported Mixed Business Performance: Exxon Mobil Corp (NYSE: XOM) is involved in the exploration and production of crude oil and natural gas. The business also manufactures, trade, transport and sell crude oil, natural gas, petroleum products, petrochemicals and a wide variety of specialty products.
FY19 Business Highlights for the period ended 31 December 2019: XOM came up with its full year results wherein the company posted total revenue and other income of $264,938 million, that declined from $290,212 million in FY18. The business reported total earnings from its upstream segment of $14,442 million, as compared to $14,079 million in FY18. Within the US Segment, the business reported lower prices and unconventional growth which was partly offset by higher expenses. Within the Non-US segment, the business reported higher liquids volumes, partly offset by lower prices, higher production expenses and net unfavorable one-time items. The business reported downstream earnings of $2,323 million, down from $6,010 million, due to lower margins including narrower North America crude differentials within the U.S segment and lower margins including unfavorable mark-to-market derivatives within the non-US segment.
Valuation Methodology: EV/Sales Multiple Based Relative Valuation
.png)
EV/Sales Based Relative Valuation (Source: Thomson Reuters)
Note: All the forecasted figures are taken from Thomson Reuters, NTM: Next Twelve Months
Stock Recommendation:The stock of XOM closed at $43.41 with a market capitalization of ~$183.72 billion. The stock made a 52-week low and high of $40.80 and $83.49 and is currently trading at the lower band of the range.The acquisition of 1.7 million acres for exploration offshore includes 1.2 million acres in the North Marakia Offshore block, which is located approximately five miles offshore Egypt’s northern coast in the Herodotus basin. The above acquisition is expected to deliver improved business prospects in coming years. Considering the aforesaid facts, current trading levels and business prospects, we have valued the stock using EV/Sales based relative valuation method. For the purpose, we have considered peers like Chevron Corp (NYSE: CVX), ConocoPhillips (NYSE: COP) and BP PLC (NYSE: BP), and arrived at a target price with a lower double-digit upside (in % terms). Hence, we give a ‘Buy’ recommendation on the stock at the closing price of $43.41, up 3.7% as on 10th March 2020.
ConocoPhillips

COP Details
FY20 Production Expected Between 1,230 MBOED to 1,270 MBOED: ConocoPhillips (NYSE: COP) is an energy company which offers a wide range of low cost of supply portfolio including resource-rich unconventional plays in North America and conventional assets in North America, Europe, Asia and Australia.
FY19 Operational Highlights for the Period Ended 31st December 2019: COP declared its full year results, wherein the company reported earnings of $7.2 billion, as compared to $6.3 billion in FY18. The business reported full-year production of 1,305 MBOED, up 5% on an underlying basis. Full-year production from the Lower 48 Big 3 unconventionals like Eagle Ford, Bakken and Permian, increased by 22% on y-o-y basis.The business reported reduction of asset retirement obligations and accrued environmental costs by $2.3 billion primarily from closed and pending dispositions. The period was marked by successful execution of Alaska appraisal program followed by an appraisal drilling and commissioning of infrastructure at Montney in Canada.
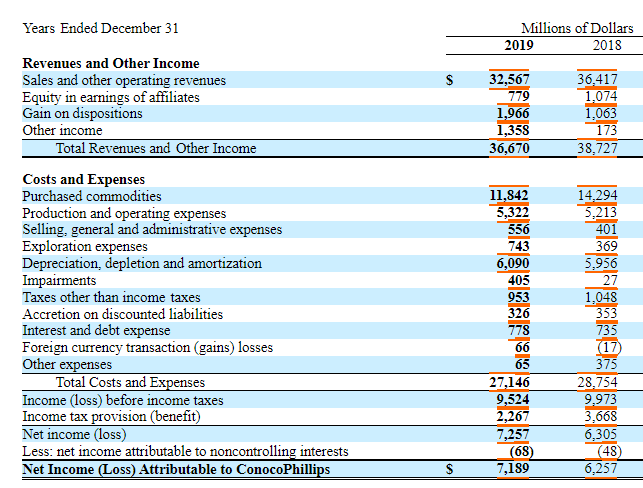
FY19 Income Statement Highlights (Source: Company Reports)
Outlook:For FY20, the company guided for an operating plan capital of $6.5 billion to $6.7 billion which includes funding for ongoing development drilling programs, major projects, exploration and appraisal activities, etc. As per the production guidance, FY20 production is anticipated within the range of 1,230 MBOED to 1,270 MBOED.
Valuation Methodology: Price to Earnings Multiple Based Relative Valuation
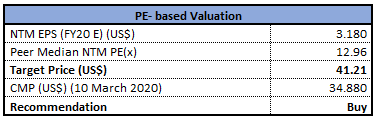
Price to Earnings Based Relative Valuation (Source: Thomson Reuters)
Note: All the forecasted figures are taken from Thomson Reuters, NTM: Next Twelve Months
Stock Recommendation:The stock of COP closed at $34.88 with a market capitalization of ~$37.71 billion. The stock made a 52-week low and high of $32.00 and $69.60 and is currently trading at the lower band of the range.Going forward,the business is expected to deliver sustained value through price cycles due to its strong balance sheet, focus on free cash flow generation, compelling returns of and returns on capital. Considering the aforesaid facts, current trading levels and business prospects, we have valued the stock using Price to Earnings based relative valuation method. For the purpose, we have considered peers like Chevron Corp (NYSE: CVX), Exxon Mobil Corp (NYSE: XOM), Devon Energy Corp (NYSE: DVN), etc., and arrived at a target price with a lower double-digit upside (in % terms). Hence, we give a ‘Buy’ recommendation on the stock at the closing price of $34.88, up 2.38% as on 10th March 2020.
Enterprise Products Partners L.P.
EPD Details
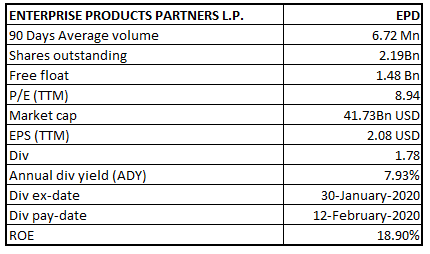
Seeking Investment Across Growth and Sustaining Capital Projects: Enterprise Products Partners L.P. (NYSE: EPD) operates in the exploration, treatment, processing, transportation and storage of natural gas and crude oil.
FY19 Operational Highlights for the Period ended 31 December 2019: EPD came up with its full year results, wherein the business reported total revenues of $32,789.2 million, as compared to $36,534.2 million in FY18 on account of decrease in marketing revenues. Net income stood at $4,687 million, that increased from $4,239 million in FY18 and includes non-cash, mark-to-market losses of $27 million. The business reported total capital investments of $4.7 billion, which includes $4.3 billion of investments in growth capital projects and $325 million of sustaining capital expenditures.General and administrative costs for FY19 grew by $3.4 million from FY18, primarily due to higher employee-related costs partially offset by lower legal costs.
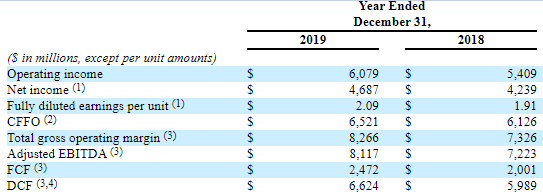
Key FY19 Operating Highlights (Source: Company Reports)
Valuation Methodology: Price to Earnings Multiple Based Relative Valuation
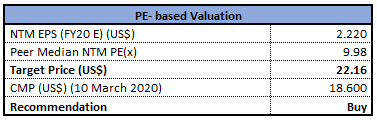
Price to Earnings Based Relative Valuation (Source: Thomson Reuters)
Note: All the forecasted figures are taken from Thomson Reuters, NTM: Next Twelve Months
Stock Recommendation:The stock of EPD closed at $18.60 with a market capitalization of ~$41.74 billion. The stock made a 52-week low and high of $13.88 and $30.87 and is currently trading at the lower band of the range.The company will continue to operate its partnership in a disciplined manner with a long-term focus on providing reliable, value-added services to its customers, generating attractive returns on invested capital, and maintaining a strong balance sheet. Considering the aforesaid facts, current trading levels and business prospects, we have valued the stock using Price to Earnings based relative valuation method. For the purpose, we have considered peers like Plains All American Pipeline LP (NYSE: PAA), ONEOK Inc (NYSE: OKE), Williams Companies Inc (NYSE: WMB), etc., and arrived at a target price with a lower double-digit upside (in % terms). Hence, we give a ‘Buy’ recommendation on the stock at the closing price of $18.60, up 1.92% as on 10th March 2020.
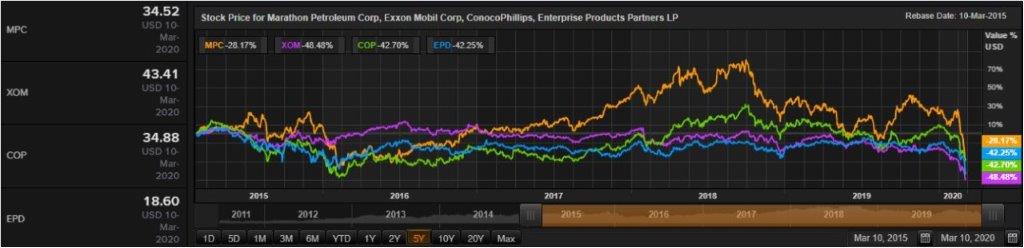
Comparative Price Chart (Source: Thomson Reuters)
Disclaimer
The advice given by Kalkine Pty Ltd and provided on this website is general information only and it does not take into account your investment objectives, financial situation or needs. You should therefore consider whether the advice is appropriate to your investment objectives, financial situation and needs before acting upon it. You should seek advice from a financial adviser, stockbroker or other professional (including taxation and legal advice) as necessary before acting on any advice. Not all investments are appropriate for all people. Kalkine.com.au and associated pages are published by Kalkine Pty Ltd ABN 34 154 808 312 (Australian Financial Services License Number 425376). The information on this website has been prepared from a wide variety of sources, which Kalkine Pty Ltd, to the best of its knowledge and belief, considers accurate. You should make your own enquiries about any investments and we strongly suggest you seek advice before acting upon any recommendation. Kalkine Pty Ltd has made every effort to ensure the reliability of information contained in its newsletters and websites. All information represents our views at the date of publication and may change without notice. To the extent permitted by law, Kalkine Pty Ltd excludes all liability for any loss or damage arising from the use of this website and any information published (including any indirect or consequential loss, any data loss or data corruption). If the law prohibits this exclusion, Kalkine Pty Ltd hereby limits its liability, to the extent permitted by law to the resupply of services. There may be a product disclosure statement or other offer document for the securities and financial products we write about in Kalkine Reports. You should obtain a copy of the product disclosure statement or offer document before making any decision about whether to acquire the security or product. The link to our Terms & Conditions has been provided please go through them and also have a read of the Financial Services Guide. On the date of publishing this report (mentioned on the website), employees and/or associates of Kalkine Pty Ltd do not hold positions in any of the stocks covered on the website. These stocks can change any time and readers of the reports should not consider these stocks as advice or recommendations.
 AU
AU

 Please wait processing your request...