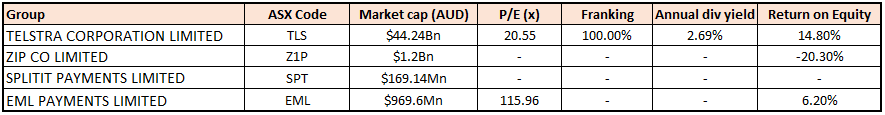
Stocks’ Details
Telstra Corporation Limited
Strong Momentum on T22 Strategy:Telstra Corporation Limited (ASX: TLS) is engaged in offering telecommunications and information services for domestic and international customers.
FY19 Results Highlights: During the year, total income on reported basis stood at $27.8 billion, down 3.6% on prior corresponding year. Reported EBITDA for the period stood at $8.0 billion, down 21.7% on prior year. Reported net profit after tax for the period stood at $2.1 billion, down 39.6% on prior corresponding year. Underlying EBITDA for the period amounted to $7.8 billion, down 11.2% on prior corresponding period. During the period, the company absorbed around $600 million of negative recurring EBITDA headwind due to the impact of nbn. Excluding the in-year nbn headwind, underlying EBITDA saw a fall of 4%.
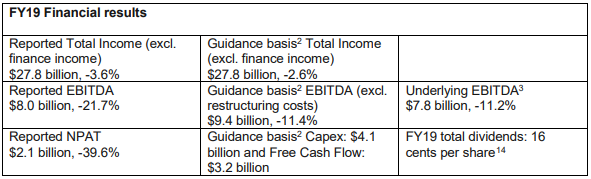
FY19 Results (Source: Company Reports)
FY20 Guidance: Total income guidance for FY20 was revised from the earlier range of $25.7 - $27.7 billion to $25.3 - $27.3 billion. Underlying EBITDA will now be in the range of $7.4 - $7.9 billion, as compared to the previous guidance of $7.3 - $7.8 billion. Guidance for capital expenditure remained unchanged in the range of $2.9 - $3.3 billion. Net one-off, nbn DA receipts less nbn net C2C, is expected to be in the range of $1.3 - $1.7 billion, against the previous guidance of $1.6 - $2.0 billion.
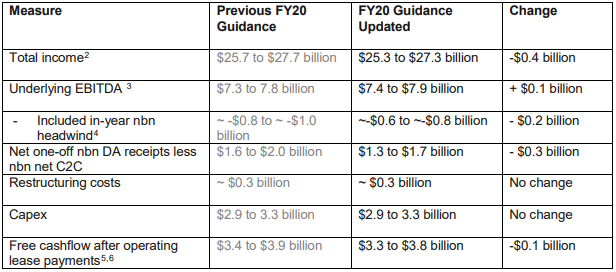
FY20 Guidance (Source: Company Reports)
Stock Recommendation: The stock of the company generated a return of 17.21% over a period of 1-year. During FY19, the company progressed well on its T22 strategy. The company simplified the Consumer & Small Business’s fixed and mobile plans in the market, reducing the number of plans from 1800 to 20. The period was marked by commercial launch of 5G services across 10 cities in Australia. Over the next 12 months, 5G coverage is expected to reach into at least 35 Australian cities. In-line with the strategy to monetise up to $2 billion in assets, the company recently reached $1 billion in asset monetisation through part sale of an unlisted property trust to a Charter Hall-led consortium. Currently, the stock is trading towards its 52-week high level of $3.978 with PE multiple of 20.55x. Based on the aforesaid factors, we give a “Hold” recommendation on the stock at the current market price of $3.640, down 2.151% on 02 September 2019.
Zip Co Limited
Rapid Growth in FY19:Zip Co Limited (ASX: Z1P) provides a point-of-sale credit and payment solution to consumers and retail finance solutions to merchants.
Debt Funding: The company recently announced that it has priced its first issuance from the Zip Master Trust, with the deal significantly oversubscribed and closed at $500 million. The settlement of the deal is expected to be completed on 05 September 2019.
FY19 Results Highlights: During the year, the company generated revenue amounting to $84.2 million, up 138% on prior corresponding period. Transaction volume for the period was reported at $1,128.5 million, up 108% on pcp. At the end of the period, the company had more than 1.3 million customers and 16,000 partners on its platform. Reported cash EBTDA for the year stood at $9.2 million, as compared to a loss of $8.8 million in FY18.

FY19 Highlights (Source: Company Reports)
Outlook: In FY20, the company is aiming at 2.5 million customers with an active ZIP account and $2.2 billion in annualised transaction volume.It is looking at local expansion through strategic deals with banks and partners & instalment launch for business. Global expansion will see integration of PartPay, increasing market share in New Zealand and launch in the UK.
Stock Recommendation: The stock of the company generated excellent returns of 208.60% in the last 1-year. Currently, the stock is priced close to its 52 weeks high level of $3.980.During FY19, the company continued rapid growth in customer accounts, transactions and revenue, with a number of strategies in place to expand both, locally and globally. Considering the aforesaid facts, higher returns in terms of stock price and the current trading levels, we suggest investors to closely watch the stock at the current market price of $3.430, up 0.587% on 02 September 2019, and wait for better entry levels.
Splitit Payments Limited
Exuberant Growth Across Key Performance Metrics:Splitit Payments Limited (ASX: SPT) is a technology company providing cross-border credit card-based instalment solutions to businesses and retailers.
H1FY19 Financial Highlights: During the six months ended 30 June 2019, the company reported revenue from continuing operations amounting to US$798,000, up 193% on prior corresponding period. Gross profit for the period amounted to US$721,000, up 468% on prior corresponding period. Following the IPO in January 2019, the company reported a strong cash position of US$23.7 million as at 30 June 2019. Research and development cost during the period, increased from US$482,000 to US$1.0 million, reflecting the development of additional functionalities and applications.
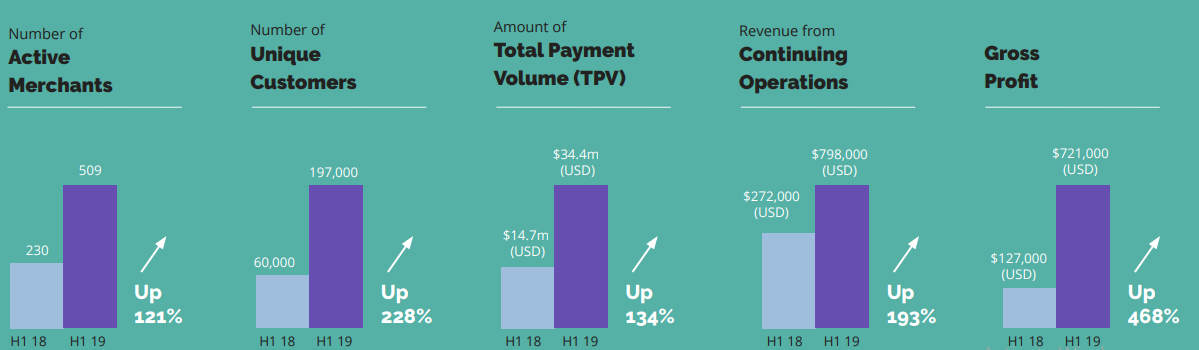
Key Performance Metrics (Source: Company Reports)
FY19 Outlook: The company has a growing sales pipeline of more than 700 potential merchants and is also looking forward to several new potential strategic partners across its target geographies. Growth in merchant fees in the second half will be supported by strong growth in unique customers and transaction volumes.
Stock Recommendation: The stock of the company generated negative returns of 11.29% and 20.29% over a period of 1 month and 3 months, respectively. In 1H19, the company witnessed a strong growth across all key metrics. Active merchants grew to 509, up 121% on prior corresponding period. Total payment volume for the period increased to US$34.4 million, rising 134% on prior corresponding period value of US$14.7 million. The number of unique customers increased substantially by 228% to 197,000. In addition, the company has in place new commercial partnerships to rapidly scale merchant numbers, including partnership with EFTPay in 1HFY19 and GHL & Ally Commerce in 2HFY19. Currently, the stock is priced close to its 52 weeks low level of $0.305. Hence, considering the aforesaid facts and current trading levels, we give a “Speculative Buy” recommendation on the stock at the current market price of $0.505, down 8.182% on 02 September 2019, which seems to be a profit booking after soaring ~37.5% on 30 August 2019.
EML Payments Limited
FY19 Revenue and EBITDA Exceeded Guidance:EML Payments Limited (ASX: EML) is engaged in providing prepaid payment services in Australia, Europe and North America.
Highlights of Financial Performance in FY19: Group revenue during the period was reported at $97.2 million, up 37% on prior corresponding year. Group EBITDA for the period amounted to $29.1 million, up 40% on prior corresponding period. Group underlying cash conversion of EBITDA stood at 75.6%.
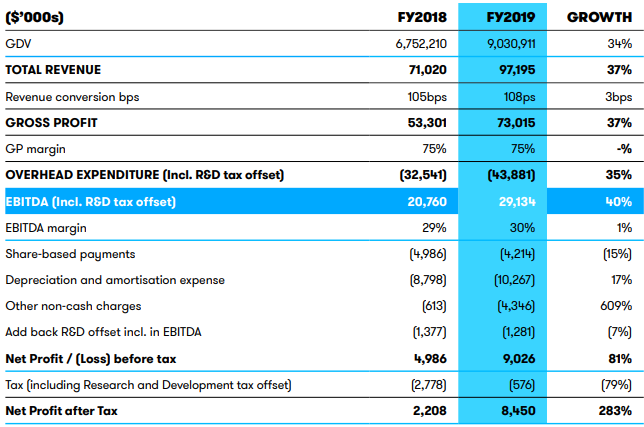
P&L Statement (Source: Company Reports)
Business-wise Performance: Revenue for the gift & incentive segment was reported at $66.4 million, up 42% in comparison to $46.6 million in pcp.This came on the back of new German malls customer launched in October 2018, AMF restructured in North America providing additional cash of $7.1 million and full year contributions from Nordics & PerfectCard acquisitions. Revenue of Virtual Account Numbers stood at $6.4 million, up 165% on pcp on the back of rapid growth of customers using enhanced processing service. General Purpose Reloadable segment accounted for revenue of $23.9 million, up 11% on pcp.
Stock Recommendation: The stock generated a return of 115.08% over a period of 1-year. The company has a track record of EBITDA growth with 5-year CAGR of 82% over the period covering FY15 to FY19. During FY19, the company’s revenue and EBITDA exceeded the guidance provided, with revenue growth across all segments. The period was also marked by a record gross debit volume of $9.03 billion, up 34% on prior year. EBITDA margin for the year stood at 30%, as compared to the prior corresponding period margin of 29%. The company acquired Flex-e-Card group, contribution from which is expected to be seen in FY20. Given the aforesaid factors, we give a “Hold” recommendation on the stock at the current market price of $3.820, down 0.779% on 02 September 2019.
.PNG)
Daily Comparative Chart (Source: Thomson Reuters)
Disclaimer
The advice given by Kalkine Pty Ltd and provided on this website is general information only and it does not take into account your investment objectives, financial situation or needs. You should therefore consider whether the advice is appropriate to your investment objectives, financial situation and needs before acting upon it. You should seek advice from a financial adviser, stockbroker or other professional (including taxation and legal advice) as necessary before acting on any advice. Not all investments are appropriate for all people. Kalkine.com.au and associated pages are published by Kalkine Pty Ltd ABN 34 154 808 312 (Australian Financial Services License Number 425376). The information on this website has been prepared from a wide variety of sources, which Kalkine Pty Ltd, to the best of its knowledge and belief, considers accurate. You should make your own enquiries about any investments and we strongly suggest you seek advice before acting upon any recommendation. Kalkine Pty Ltd has made every effort to ensure the reliability of information contained in its newsletters and websites. All information represents our views at the date of publication and may change without notice. To the extent permitted by law, Kalkine Pty Ltd excludes all liability for any loss or damage arising from the use of this website and any information published (including any indirect or consequential loss, any data loss or data corruption). If the law prohibits this exclusion, Kalkine Pty Ltd hereby limits its liability, to the extent permitted by law to the resupply of services. There may be a product disclosure statement or other offer document for the securities and financial products we write about in Kalkine Reports. You should obtain a copy of the product disclosure statement or offer document before making any decision about whether to acquire the security or product. The link to our Terms & Conditions has been provided please go through them and also have a read of the Financial Services Guide. On the date of publishing this report (mentioned on the website), employees and/or associates of Kalkine Pty Ltd do not hold positions in any of the stocks covered on the website. These stocks can change any time and readers of the reports should not consider these stocks as advice or recommendations.
 AU
AU

 Please wait processing your request...