Contact Energy Limited
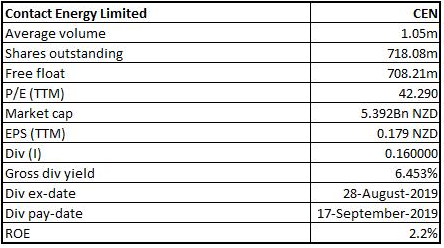
CEN Details
Focussed On Delivering On Transformation Programme: Contact Energy Limited (NZX: CEN) is one of New Zealand’s largest energy generators and retailers, who are committed to a sustainable, low carbon energy future for New Zealand. The company has a market capitalisation of ~$5.39 billion on 17th February 2020.
For the six months period ended 31st December 2019, the company reported statutory profit of $59 million, down by $217 million than the pcp. The earlier profit included Rockgas profit of $10 million and the $172 million gain on the sale of both Rockgas and Ahuroa gas storage. EBITDAF from continuing operations stood at $221 million, down by 21% due to lower sales to commercial and industrial customers, rising thermal generation costs and strong financial performance under unique wholesale market conditions in the prior period. The company declared an ordinary interim dividend of 16 cents per share and the target for the full-year ordinary dividend remains at 39 cents per share.
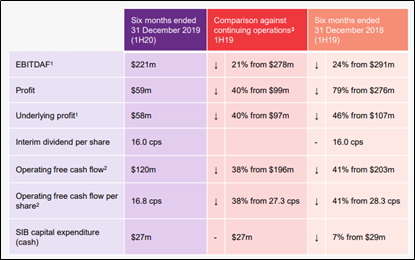
Financial Highlights (Source: Company Reports)
Contact Secures Gas Supply: The company has secured an agreement with gas producer OMV New Zealand to secure 37 petajoules (PJ) of gas to be delivered from 2021 to 2025. OMV have also notified CEN that it would supply at least 6.3PJ of Contact’s 10PJ entitlement from Maui in 2021. The company has entered into an additional new 3.6PJ gas agreement with an undisclosed third party for delivery in 2020.
Outlook: The company is focussed on delivering on its transformation programme to reduce controllable costs, and capture value from scale efficiencies through geothermal development and leveraging its customer systems and lean operating model. CEN is working with commercial and industrial customers to deliver reductions to their carbon footprints by connecting them with low-carbon, reliable electricity.
Valuation Methodology:
EV/EBITDA Based Approach
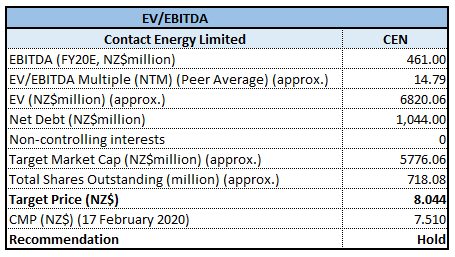
EV/EBITDA Based Valuation (Source: Thomson Reuters), NTM: Next Twelve Months
Note: All forecasted figures and peers have been taken from Thomson Reuters
Technical Overview:
Monthly Chart -
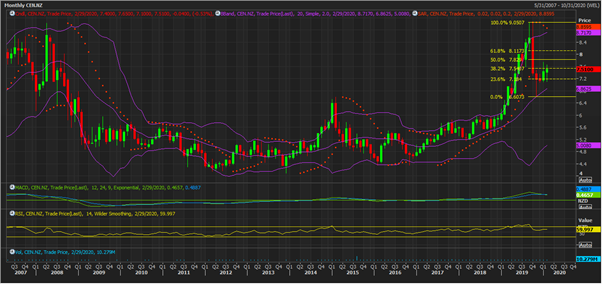
Source: Thomson Reuters
Weekly Chart -
Source: Thomson Reuters
Daily Chart -
Source: Thomson Reuters
Note: Purple colour lines are Bollinger bands, yellow colour horizontal lines are retracement lines and orange colour dotted line is Parabolic SAR.
The stock having experienced good correction, seems to be taking technical rebound wherein it has taken resistance around $7.8 which happens to be 50% retracement level. If this level is broken decisively and stock gives closing above it, then it might even move up to $9.09 where it will face with strong resistance. Intermediary resistance for the stock is seen around $8.11. On the downside, $7.18 which happens to be 23.6% retracement level may be acting as strong support for the stock.
The performance of technical tools such as MACD with positive cross-over on monthly and daily charts but slightly below signal line on weekly chart; and RSI with reading above 50 on all timeframes of charts reflect upon inherent strength of the stock.
At the time of technical analysis, it was 2:50 pm in Auckland, New Zealand.
Stock Recommendation: The stock has given a total return of ~1.62% and ~8.95% in the time period of one month and 3 months, respectively. We have valued the stock using a relative valuation method, i.e., the EV/EBITDA approach, and arrived at a target price of higher single-digit growth (in percentage terms).
Considering the expected upside, we give a “Hold” recommendation on the stock at the current market price of $7.510 per share down by 0.53% on February 17, 2020.
Vector Limited
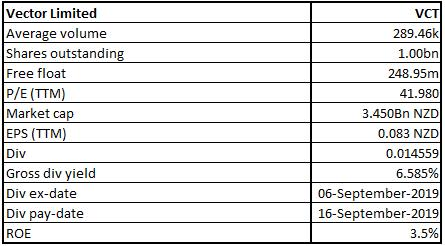
VCT Details
Operational Performance in 1HFY20: Vector Limited (NZX: VCT) is New Zealand’s leading network infrastructure company which runs a portfolio of businesses delivering energy and communication services to more than one million homes and commercial customers across the country. The market capitalisation of the company stood at ~$3.45 billion on 17th February 2020. In the six-months to December 31, 2019, total ICP connection numbers increased by 1.6% to 576,352 compared with the same period last year. Grid connection point (GXP) volume increased by 0.1% on the equivalent period, a good improvement from the previous quarter, which witnessed volumes decline due to an unseasonably warmer winter.
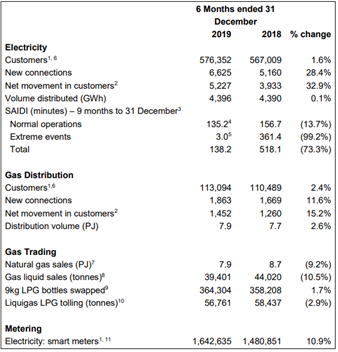
Operational Highlights (Source: Company Reports)
Outlook for FY20: The company’s revised approach for Vector Communications and newly consolidated Vector PowerSmart business are already gaining traction, and the company expects to report progress, and improved profitability. The company’s gas trading business will continue to adapt and seek new opportunities in challenging market conditions.
Valuation Methodology:
P/E Based Valuation
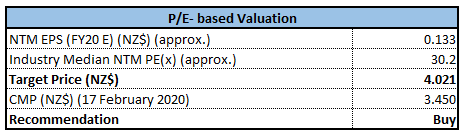
P/E Based Valuation (Source: Thomson Reuters), *NTM: Next Twelve Months
Technical Overview:
Monthly Chart -
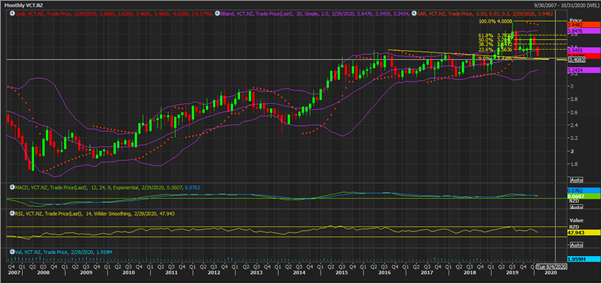
Source: Thomson Reuters
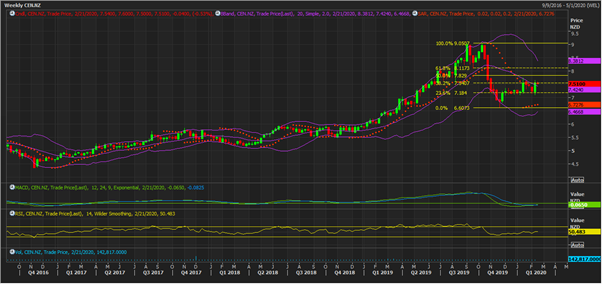
Weekly Chart –
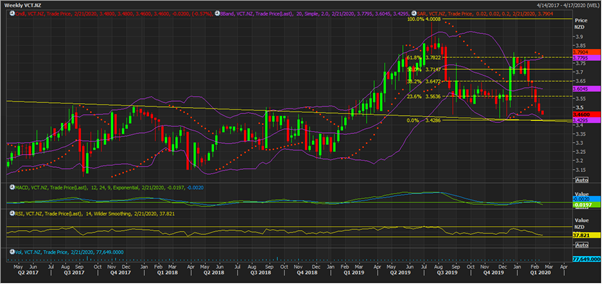
Source: Thomson Reuters
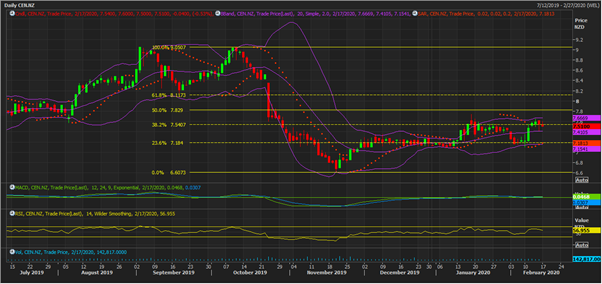
Daily Chart -
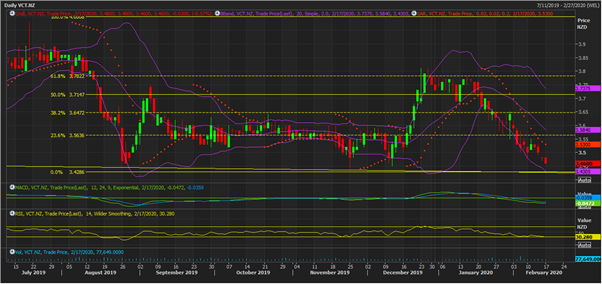
Source: Thomson Reuters
Note: Purple colour lines are Bollinger bands, yellow colour horizontal lines are retracement lines and orange colour dotted line is Parabolic SAR.
The stock is in down trend and is heading towards its 100-retracement level of $3.42 of recent past high and low. The stock is likely to take support around $3.42 and on any technical rebound in the stock price from there, will meet with resistance around $3.65 which happens to be 38.2% retracement level.
Technical tools such as MACD bearish cross-over on weekly and daily chart but with positive cross-over on monthly chart; and RSI reading below 50 on all timeframes of charts suggest near-term downtrend. However, RSI reading of 30 on daily chart suggest that the stock is in oversold zone and it might undergo technical rebound.
At the time of technical analysis, it was 2:50 pm in Auckland, New Zealand.
Stock Recommendation: Over the period of FY15 to FY19, the company has registered a CAGR of 3.40% in top-line. The company’s gross profit has registered a CAGR of 3.16% during the same time span. Currently, the stock is trading at the below average of its 52-week trading range of $3.4 and $3.98 and, thus, it can be said that the stock is offering a decent opportunity for accumulation. We have applied P/E based valuation and the target price reflects the growth of lower double-digit (in
% terms).
Considering CAGR in top-line, decent outlook, current trading levels and expected upside, we give a “Buy” recommendation on the stock at the current market price of NZ$3.450 per share down by 0.86% on 17th February 2020.
Infratil Limited
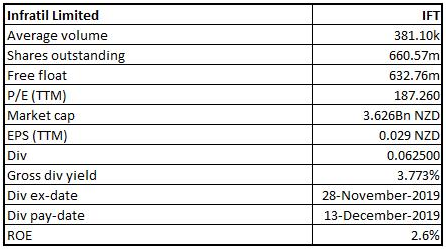
IFT Details
Interim Dividend of 6.25 Cents Per Share Declared: Infratil Limited (NZX: IFT) invests in the growth sectors and it principally has investment in energy, transport as well as social infrastructure businesses. The market capitalisation of the company stood at around $3.62 billion on 17th February 2020. The company reported net parent surplus of $56.4 million in the 6 months to September 30, 2019, down from $58.5 million in the prior period due to unfavourable foreign exchange and derivative movements of $16.4 million. Underlying EBITDAF from continuing operations was $289.4 million up from $284.6 million in the prior year, which included an initial two-month contribution from Vodafone of $39.1 million. Also, the company declared an interim dividend of 6.25 cents per share.
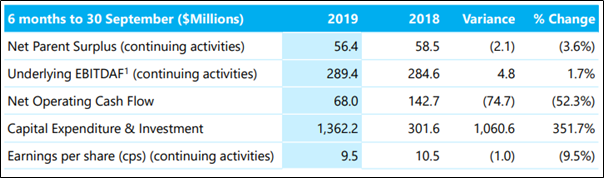
Financial Highlights (Source: Company Reports)
Infratil Promises To Development Of Renewables In Europe: The company has announced an initial investment in Galileo Green Energy, LLC (GGE). It was added that Infratil would invest in GGE in conjunction with the New Zealand Superannuation Fund, the Commonwealth Superannuation Corporation and the Morrison & Co Growth Infrastructure Fund. The company will own a 40% interest in GGE, with each of its Co-Investors owning a 20% interest.
GGE will invest in the development of wind, solar PV energy projects and storage solutions across all of Europe, including its largest markets, Italy, Spain, France, Germany and the UK.
Outlook for FY2020: Tilt Renewables Limited, which Infratil is a 65% shareholder in, made an announcement that it entered into an agreement to sell 270 MW Snowtown 2 wind farm to an entity wholly-owned by funds managed by Palisade Investment Partners Limited and First State Super, which involves an enterprise value amounting to A$1,073 million. Infratil provides earnings guidance on a ‘continuing operations’ basis which means that operations that are disposed of during the year are excluded from the earnings guidance. This approach is applied for the entire year. The reduction in Infratil’s full year Underlying EBITDAF from continuing operations because of the sale of Snowtown 2 would be around A$74 million. This resulted in the revised Underlying EBITDAF from continuing operations (which excludes International Portfolio Incentive Fee) guidance range of $575 Mn- $615 Mn for FY2020.
Valuation Methodology:
P/CF Based Valuation
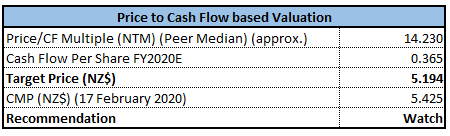
P/CF Based Valuation (Source: Thomson Reuters), *NTM: Next Twelve Months
Technical Overview:
Monthly Chart -
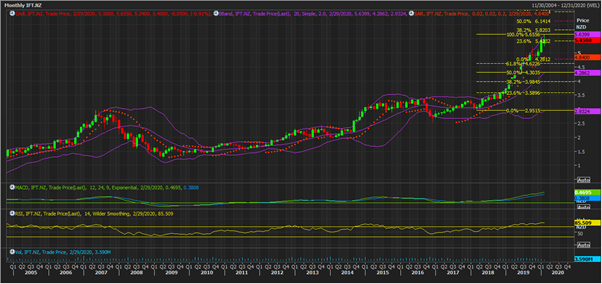
Source: Thomson Reuters
Weekly Chart –
Source: Thomson Reuters
Daily Chart -
Source: Thomson Reuters
Note: Purple colour lines are Bollinger bands, yellow colour horizontal lines are retracement/projection lines and orange colour dotted line is Parabolic SAR.
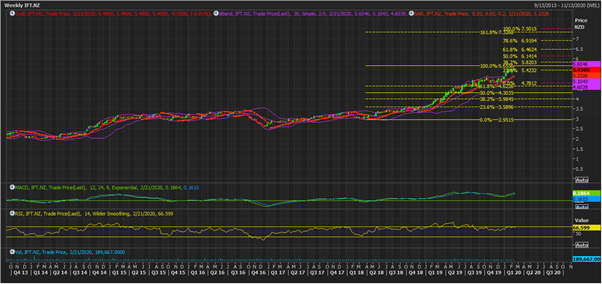
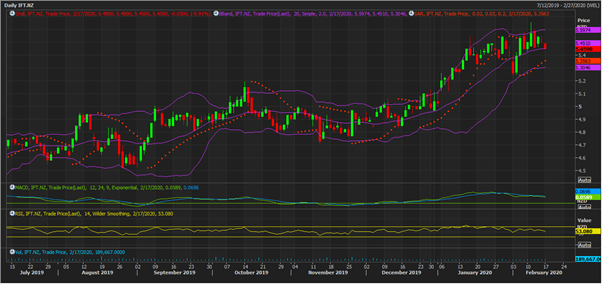
The stock has been in bull-run and in the process, it has entered into highly overbought zone as evident from RSI reading of 85 and above on monthly chart. However, RSI reading of 66.5 and 53.0 on weekly and daily charts respectively provide room for the stock to appreciate in near-term. MACD has positive cross-over on all timeframes of charts suggesting strength in bullish momentum for the stock.
All-in-all, we believe that the stock has limited upside and downside with strong resistance around $5.82 and strong support around $4.62. Prudence lies in the fact that investor should wait for better entry price.
At the time of technical analysis, it was 2:50 pm in Auckland, New Zealand.
Stock Recommendation: Currently the stock is trading above the average of 52 weeks low high of $3.824 and $5.655 and, therefore, the stock might witness some correction. We have valued the stock using P/CF-based valuation and arrived at a target price, which is offering a downside of lower single-digit (in percentage terms).
Based on its current trading position and expectations that the stock price might witness a decline, we have a Watch stance on the stock at the current price of NZ$5.490 per share down by 0.18% on February 17, 2020.
Wellington Drive Technologies Limited
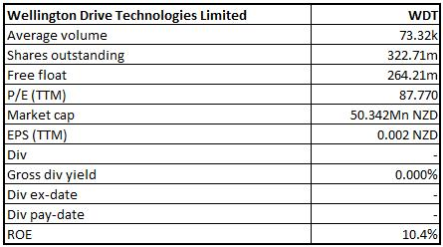
WDT Details
Gross Margin Improved: Wellington Drive Technologies Limited (NZX: WDT) is a leading provider of IoT solutions, cloud-based fleet management platforms, proximity marketing solutions, energy-efficient electronic motors and connected refrigeration control solutions. The market capitalisation of the company stood at around $50.34 million on 17th February 2020.
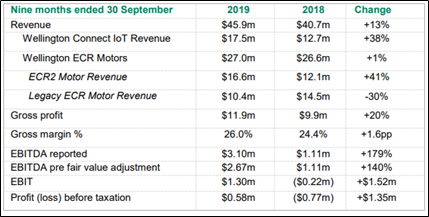
The company has announced its unaudited trading results for the nine months ended September 2019 and the third quarter of 2019. For the nine months ended 30th September 2019, the company delivered 13% revenue growth, with revenue at $45.9 million, compared to $40.7 million for the same period last year. Revenue from IoT products was 38% higher, revenue from the ECR2 motor platform was 41% higher and revenue for legacy motor products declined consistent with forecast. Gross margin improved from 24.4% to 26.0% reflecting lower unit costs for Wellington’s ECR2 and SCS Connect products and the increasing IoT product share.
Financial Metrics (Source: Company Reports)
Impact of Coronavirus on Wellington: The company is closely monitoring the impact of the 2019 Novel Coronavirus (nCov) on its supply chain operations. As a result of the nCoV emergency and measures put in place in China by the local and central government, Wellington is expecting an impact on product supply. This is due to government restrictions on factory openings, restrictions in movement of people and port and logistics facility closures. The company expects to release its FY19 results by the end of February 2020. There is no impact to 2019 as a result of NCov related issues with revenue and profits expected to be consistent with guidance.
Technical Overview:
Monthly Chart -
Source: Thomson Reuters
Weekly Chart –
Source: Thomson Reuters
Daily Chart –
Source: Thomson Reuters
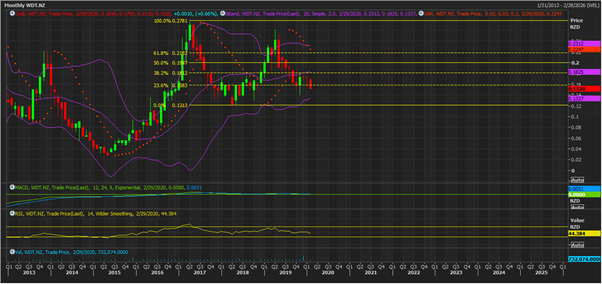
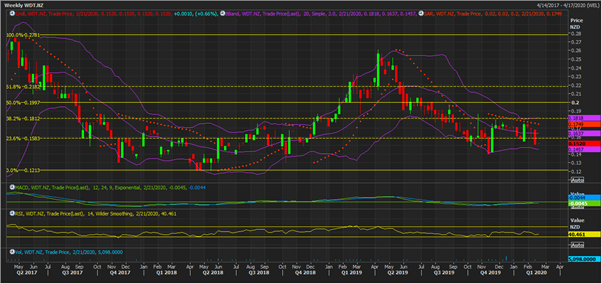
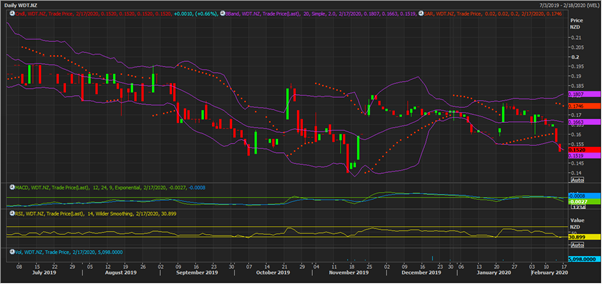
Note: Purple colour lines are Bollinger bands, yellow colour horizontal lines are retracement lines and orange colour dotted line is Parabolic SAR.
The stock is in down trend trading below key 20 period SMA on all timeframes of charts. It is likely to take good support around $0.12 which happens to be 100% correction level whereas $0.18 which happens to be 38.2% retracement level of recent past high and low of the stock price, should provide as strong resistance.
Technical indicators such as MACD with bearish cross-over and RSI reading below 45 on all timeframes of charts suggest continuance of weaker trend in near-term.
At the time of technical analysis, it was 2:50 pm in Auckland, New Zealand.
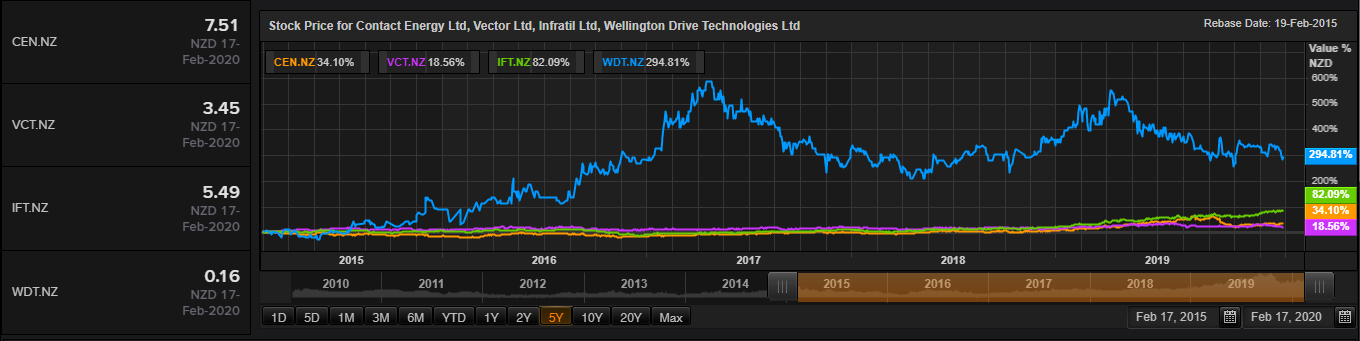
Stock Recommendation: The company’s EBITDA margin stood at 7.3% at the end of June 2019. The stock price has corrected 6.21% in the time period of last one month, and it has fallen by 20.91% in the span of previous 6 months. The company is expected to report results for FY 2019 soon and we advise the market participants to closely track its earnings.
Therefore, we have a watch stance on the stock at the current market price of $0.156 per share, up by 3.31% on February 17, 2020.
Disclaimer
The advice given by Kalkine Pty Ltd and provided on this website is general information only and it does not take into account your investment objectives, financial situation or needs. You should therefore consider whether the advice is appropriate to your investment objectives, financial situation and needs before acting upon it. You should seek advice from a financial adviser, stockbroker or other professional (including taxation and legal advice) as necessary before acting on any advice. Not all investments are appropriate for all people. Kalkine.com.au and associated pages are published by Kalkine Pty Ltd ABN 34 154 808 312 (Australian Financial Services License Number 425376). The information on this website has been prepared from a wide variety of sources, which Kalkine Pty Ltd, to the best of its knowledge and belief, considers accurate. You should make your own enquiries about any investments and we strongly suggest you seek advice before acting upon any recommendation. Kalkine Pty Ltd has made every effort to ensure the reliability of information contained in its newsletters and websites. All information represents our views at the date of publication and may change without notice. To the extent permitted by law, Kalkine Pty Ltd excludes all liability for any loss or damage arising from the use of this website and any information published (including any indirect or consequential loss, any data loss or data corruption). If the law prohibits this exclusion, Kalkine Pty Ltd hereby limits its liability, to the extent permitted by law to the resupply of services. There may be a product disclosure statement or other offer document for the securities and financial products we write about in Kalkine Reports. You should obtain a copy of the product disclosure statement or offer document before making any decision about whether to acquire the security or product. The link to our Terms & Conditions has been provided please go through them and also have a read of the Financial Services Guide. On the date of publishing this report (mentioned on the website), employees and/or associates of Kalkine Pty Ltd do not hold positions in any of the stocks covered on the website. These stocks can change any time and readers of the reports should not consider these stocks as personalised advice.
 AU
AU

 Please wait processing your request...