Qantas Airways Limited
.png)
QAN Details
Robust Outlook: Qantas Airways Limited’s (ASX: QAN) stock climbed up 1.86 per cent on August 29, 2018, owing to positive market sentiments related to the dividend record date of September 06, 2018. However, for FY18, the Group’s domestic flying operations delivered EBIT of $1.1 Bn, which is 25 per cent higher than FY17 and represent a new record for the business. It was mainly driven by the combination of Qantas and Jetstar’s network, schedule and product strengths in the key markets, and supported by capacity discipline driving higher seat factors and higher unit revenue. The management anticipates that the company is on track to achieve $500-600 million of EBIT by 2022. Based on the strong FY18 performance, the Board of Directors declared to reward its shareholder returns up to $500 million, comprising of the fully franked dividend of 10 cents per share to be paid on 10 October 2018 with a record date of 6 September 2018, as well as an on market buy-back of up to $332 million. We expect that the company has a brighter outlook ahead based on its strategic movement to invest in new lounges, new aircraft and in things like the Pilot Academy which will help to raise profitability of the company in the upcoming period.
.png)
FY18 Financial Highlights (Source: Company Reports)
Meanwhile, the stock price has risen 9.51 percent in the past six months as at August 28, 2018 and is trading at a reasonable PE level of 11.52x. While the risks relating to fuel prices hover over the group, strategy on Asia’s growth, loyalty program and diversification may be of help with focus on Project Sunrise coming under spotlight. Hence, we maintain our “Buy” recommendation on the stock at the current price of $ 6.570, considering the aforesaid facts.
.png)
QAN Daily Chart (Source: Thomson Reuters)
Nine Entertainment Co. Holdings Limited
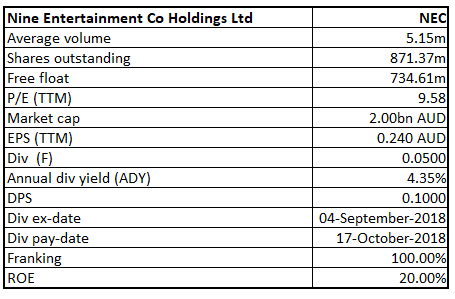
NEC Details
Decent Performance in FY18: Nine Entertainment Co. Holdings Limited (ASX: NEC) delivered decent full-year results wherein total sales grew by 6 percent and amounted to $1,318.2 Mn in FY18 over the last year. It was mainly driven by increased share in the Free-To-Air (FTA) market during the period. Reflecting this top line growth, the group EBITDA increased by 25.1% for the year, despite the headwind of the recently introduced annual spectrum charges, along with some incremental content investment targeted at revenue growth in future years.Net Profit after Tax pre-specific items stood at $156.7 Mn in FY18, exhibiting growth of 26.8 percent on a Y-o-Y basis. Based on strong earnings, Net Debt at 30 June 2018 came in at $121 million, down from $224 million 12 months earlier, which included the proceeds from the sale of the Group’s Willoughby site. In addition to this, the Board of Directors declared a fully franked final dividend of 5 cents per share, bringing the total dividend for FY18 to 10 cps, up 5.3 percent as compared to the prior year and it will be payable on October 17, 2018 with the record date of September 05, 2018.
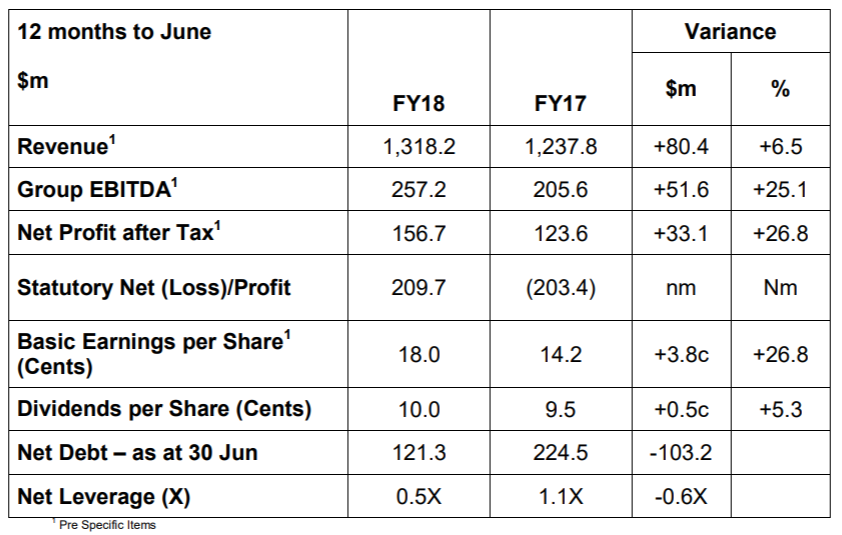
FY18 Financial Highlights (Source: Company Reports)
For the September quarter, Nine’s Metro TV revenues recorded approximately 1% ahead of same time last year, while core Digital advertising revenues came in at around 15% ahead.Based on this, the company stated that for FY19, the EBITDA is expected to be somewhere in the range of $280 Mn to $300 Mn based on the market growth of 1%. Meanwhile, the share price has risen 2.68 per cent in the past three months as at August 28, 2018 and trades close to 52-week high level ($2.665). While the group is under a merger with Fairfax Media (subject to approvals) and there are chances that the revenue may improve going forward; we maintain our “Expensive” recommendation on the stock at the current market price of $2.350.
.png)
NEC Daily Chart (Source: Thomson Reuters)
Platinum Asset (Investment) Management Limited
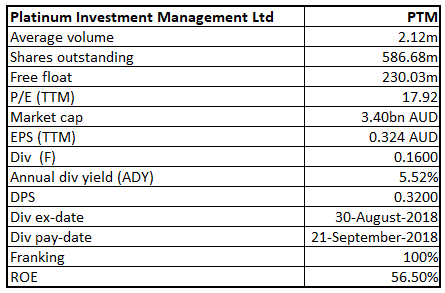
PTM Details
Intention to Maintain Dividend Policy: Platinum Asset Management Limited’s (ASX: PTM) stock tumbled 1.207 percent on August 29, 2018 as there seems to be some profit booking while the stock goes ex-dividend on August 30, 2018. However, for FY18, PTM delivered decent full-year results wherein total sales grew by 5.9 percent and amounted to $353.3 Mn in FY18 over the last year. It was primarily driven by the rise of FUM and performance fees and also supported by the reduction of its total fees and charges for the standard fee option for each of the Platinum Trust Funds and the Platinum Global Fund from 1.5% per annum to 1.35% per annum, from 3 July 2017. Net profit attributable to members stood at $189.2 Mn in FY18, displaying growth of 1.7 percent on a Y-o-Y basis. Profit from ordinary activities after income tax was slightly down due to the impact of the accounting standards, which required the consolidation of one of its offshore vehicles for part of the prior year. Based on the profit figure, the basic and diluted earnings per share (EPS) for the 2018 financial year increased to 32.36 cents per share, from 31.74 cents per share for the previous financial year. Based on the decent performance, the Board of Directors has declared a fully franked final ordinary dividend of 16 cents per share (cps), bringing the total dividend of 32 cents per share and it will be payable on September 21, 2018 with the record date of August 31, 2018. Further, the management notified that the company will maintain their dividend policy in the future under any conditions, but it is subject to the corporate’s earnings.
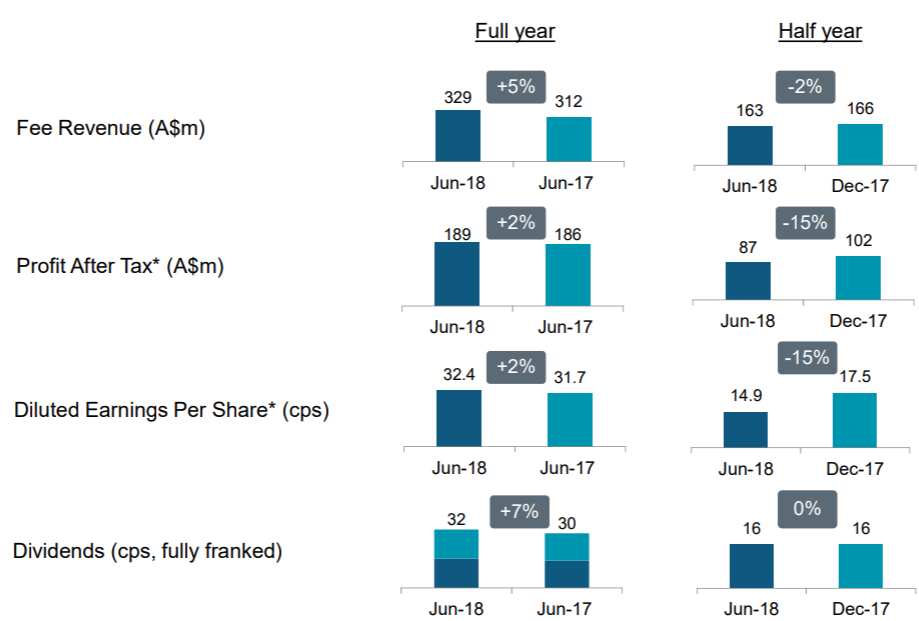
FY18 Operating Performance Highlights (Source: Company Reports)
Meanwhile, the stock has risen 4.50 per cent in the past one month as at August 28, 2018 and currently trades near its 52-week low level of $ 5.200. We maintain our “Expensive” recommendation on the stock at the current market price of $ 5.730, by looking at aforesaid facts and macroeconomic scenario in relation to the US-China Trade war and a rise in US interest rate, and in view of the trading levels (close to 18x the earnings scenario despite the price fall).
.png)
PTM Daily Chart (Source: Thomson Reuters)
BHP Billiton Limited
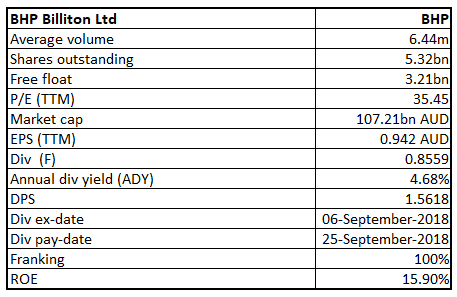
BHP Details
Decent Outlook Ahead: BHP Billiton Limited’s (ASX: BHP) stock climbed up 1.288 percent on August 29, 2018, owing to positive market sentiments related to rising commodity price. For FY18, RoE and RoIC substantially increased from 11.4% and 6.7% to 15.9% and 10.4%, respectively over the prior year. As a result, the company recorded Current ratio and Quick ratio at 2.51x and 2.24x, respectively in FY18 while debt to equity came down to 0.48x from 0.53x during the same period. In the meantime, the stock has risen 9.44 per cent in the past six months as on August 28, 2018 and traded close to a 52-week high of $35.290.
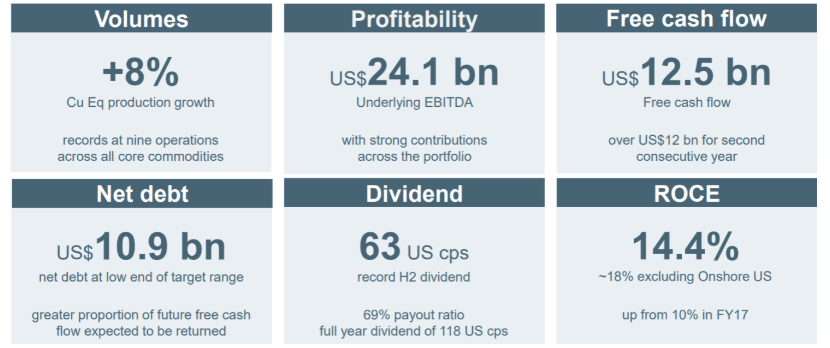
FY18 Financial Dashboard (Source: Company Reports)
The stock has a market capitalization of $107.21 Bn, a price-to-earnings ratio of 35.45x and a beta of 1.26 as of August 29, 2018. By looking at commodity price movement and current trading level, we maintain our “Hold” recommendation at the current market price of $33.810.
.png)
BHP Daily Chart (Source: Thomson Reuters)
Disclaimer
The advice given by Kalkine Pty Ltd and provided on this website is general information only and it does not take into account your investment objectives, financial situation or needs. You should therefore consider whether the advice is appropriate to your investment objectives, financial situation and needs before acting upon it. You should seek advice from a financial adviser, stockbroker or other professional (including taxation and legal advice) as necessary before acting on any advice. Not all investments are appropriate for all people. Kalkine.com.au and associated pages are published by Kalkine Pty Ltd ABN 34 154 808 312 (Australian Financial Services License Number 425376). The information on this website has been prepared from a wide variety of sources, which Kalkine Pty Ltd, to the best of its knowledge and belief, considers accurate. You should make your own enquiries about any investments and we strongly suggest you seek advice before acting upon any recommendation. Kalkine Pty Ltd has made every effort to ensure the reliability of information contained in its newsletters and websites. All information represents our views at the date of publication and may change without notice. To the extent permitted by law, Kalkine Pty Ltd excludes all liability for any loss or damage arising from the use of this website and any information published (including any indirect or consequential loss, any data loss or data corruption). If the law prohibits this exclusion, Kalkine Pty Ltd hereby limits its liability, to the extent permitted by law to the resupply of services. There may be a product disclosure statement or other offer document for the securities and financial products we write about in Kalkine Reports. You should obtain a copy of the product disclosure statement or offer document before making any decision about whether to acquire the security or product. The link to our Terms & Conditions has been provided please go through them and also have a read of the Financial Services Guide. On the date of publishing this report (mentioned on the website), employees and/or associates of Kalkine Pty Ltd do not hold positions in any of the stocks covered on the website. These stocks can change any time and readers of the reports should not consider these stocks as advice or recommendations.
 AU
AU
 Please wait processing your request...