Paragon Care
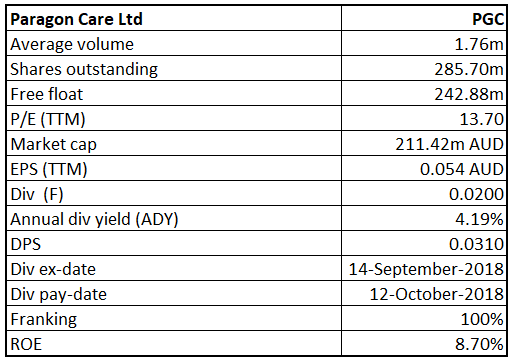
PGC Details
Positive Outlook: Paragon Care Limited (ASX: PGC) is a small-cap company with the market capitalization of circa $211.42 Mn as of September 11, 2018. The company reported FY18 revenue and EBITDA of $136.7 Mn and $19.7 Mn, respectively. The group is expecting FY19 revenue to be around $260 Mn and EBITDA is also expected approximately $36 Mn at the back of full contribution from the FY18 acquisition. Gross margin was up 88bps in FY18 at 40.2% compared to 39.3% in FY17. Net profit after tax came in 7% higher for FY18 at $10.9 Mn compared to $10.2 Mn in FY17. As a result, the Board of Directors declared fully franked final dividend of 2 cents per share for its shareholders and it will be payable on October 12, 2018 with the record date of September 17, 2018. This summarized a total dividend payment of 3.1 cents per share for the full year, representing 3% rise over the previous year. With earning per share (EPS) at 5.4 cents and the full-year dividend of 3.1 cents per fully paid ordinary share for 2018, a dividend per share payout of 57% which is at the higher end of the 40% to 60% company dividend payment policy has been maintained.
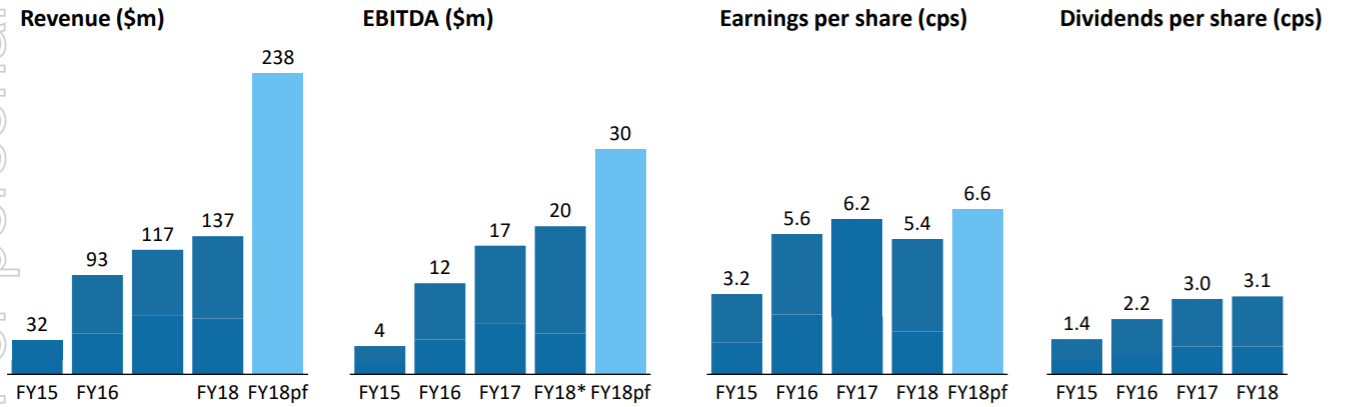
Financial Metric Trend (Source: Company Reports)
Meanwhile, the stock has fallen 14.94 percent in the past three months as at September 10, 2018 and traded at reasonable PE of 13.70x. Hence, we give a “Speculative Buy” recommendation on the stock at the current market price of $ 0.740.
.png)
PGC Daily Chart (Source: Thomson Reuters)
WAM Microcap
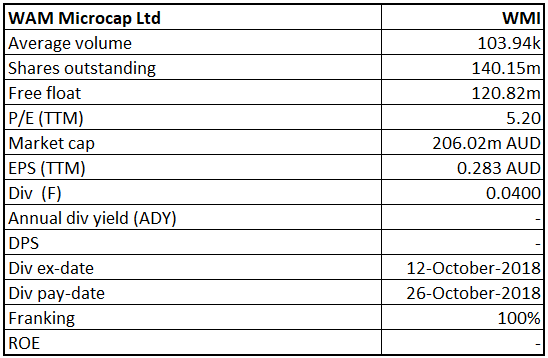
WMI Details
Decent Investment Return Since inception: WAM Microcap Limited (ASX: WMI) reported decent performance for July month wherein WMI Investment Portfolio delivered a 1.0% return in one month (as of 31 July 2018) but was moderately down by 0.2% as compared to S&P/ASX Small Ordinaries Accumulation Index returns of 1.2%. Over the past three years, WMI Investment Portfolio delivered decent returns of 14.8% (as at 31 July 2018) against the benchmark of 8.4%. Since inception, WMI Investment Portfolio generated 17.5% against the S&P/ASX Small Ordinaries Accumulation Index returns of 8.5%. The group has a decent diversified base comprising of 79.7 percent in listed equities and 20.3% in Fixed interest & cash. Moreover, the Group posted Net Tangible Assets (NTA) per share before tax of 122.51 cents as on July 31, 2018 while NTA per share after tax amounted to 119.77 cents. The Group’s investment objectives are to deliver a stream of fully franked dividends, provide capital growth over the medium-to-long term and preserve shareholder capital. Based on the robust performance in FY18, the company has declared a fully franked final ordinary dividend of 2 cents per share (cps) and a special dividend of 2 cps, bringing the total dividend of 4 cents per share and it will be payable on October 26, 2018 with the record date of October 15, 2018.
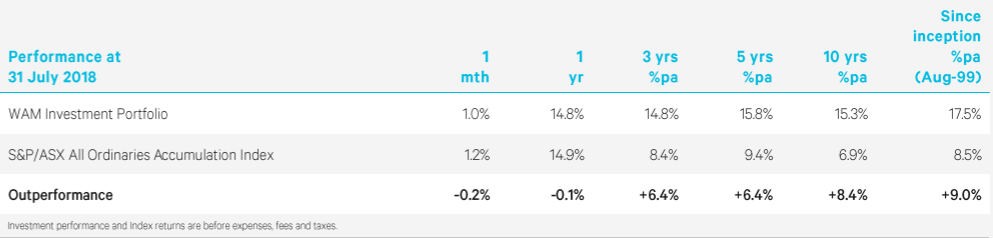
Portfolio Performance (Source: Company Reports)
Meanwhile, the share price climbed up 4.26 per cent in the past three months and traded at 52-week high level of $1.570. By looking its financial performance and capability to maintain investment portfolio return ahead, we maintain our “Speculative Buy” recommendation on the stock at the current market price of $ 1.470.
.png)
WMI Daily Chart (Source: Thomson Reuters)
Australian Vintage
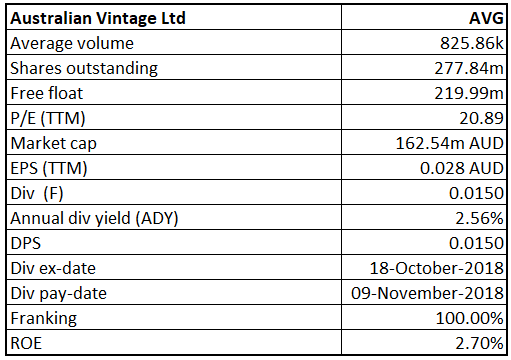
AVG Details
Decent Performance in FY18:Australian Vintage Ltd (ASX: AVG) has maintained its dividend payout in FY18 while the group has a plan for capital expenditure in next 12 months. The revenue for FY18 came in at $264.6 Mn compared to $226.4 Mn in FY17. Net Profit after tax also saw an uptick of 78.8% to $7.7 Mn in FY18 against $4.3 Mn in FY17. AVG recorded basic earnings per share for FY18 at 2.8 cents per share compared to 1.8 cents per share in FY17. Based on the performance, the company has declared a final FY18 dividend of 1.5 cents per share, fully franked, taking full-year dividend to 9.50 cents fully franked. It will be paid on November 09, 2018 to its shareholders with the record date of October 19, 2018. Annual dividend yield stands at 2.56% with the five-year average payout ratio of 52.52%.
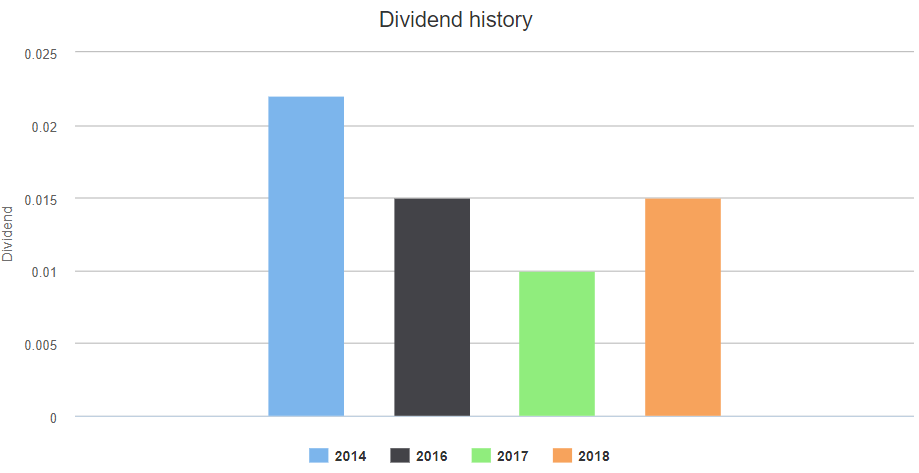
Dividend Trend (Source: ASX)
Meanwhile, the share price climbed up 6.36 percent in the past one month and trades at the higher level. Hence, we uphold our “Speculative Buy” recommendation on the stock at the current market price of $0.595 as the company continues to focus on its three key strategies i.e., growing export business, increase branded sales, and focus on cost control thereby ensuring overall growth momentum in years to come.
.png)
AVGDaily Chart (Source: Thomson Reuters)
Thorney Opportunities
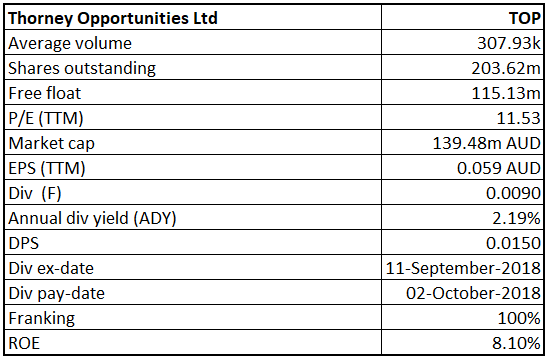
TOP Details
Rise in Dividend: Since inception, Thorney Opportunities Ltd (ASX: TOP) has consistently produced strong growth in its net tangible assets (NTA) and recorded 80.5% growth in NTA after tax. As of 30 June 2018, TOP’s net tangible assets after tax per share stood at 75.7 cents (cps). The NTA performance since 30 June has been particularly strong, with the NTA closing at 78.5 cps, an increase of 3.7% in the first two months of the 2019 financial year.
For FY 18, the Board has declared a final dividend of 0.9 cps, fully franked, an increase of 38.5% when compared to 2017. This summarized a total dividend payment of 1.5 cents per share for the full year, representing a 20% rise over the previous year and equated to a gross yield of about 3.0%. The final dividend will be paid on October 02, 2018 to registered shareholders with the record date of September 12, 2018. The Board is committed to maintaining or increasing dividend payments when possible in the future.
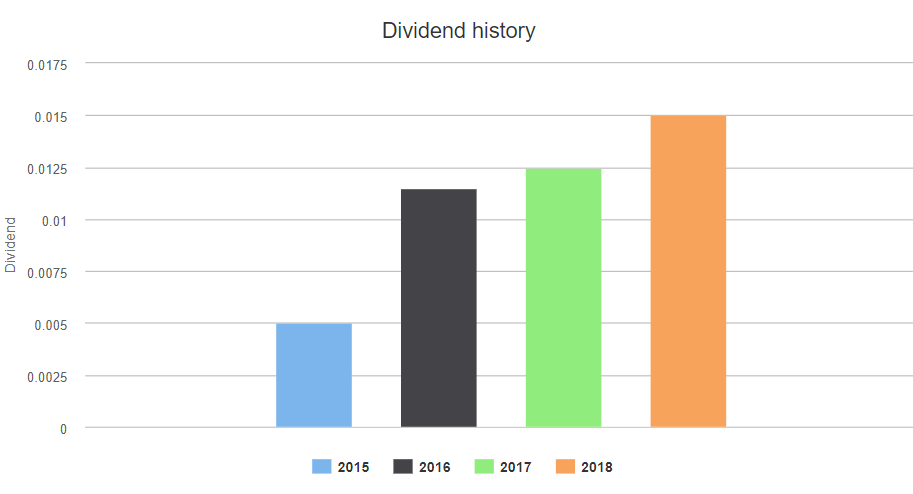
Rise in Dividend (Source: ASX)
Meanwhile, the stock has been under pressure this year generating negative YTD return of 6.16% and traded close to 52-week low of $0.660. By looking at the current trading level and its decent financial performance in FY18, we give a “Speculative Buy” recommendation on the stock at the current market price of $0.695.
.png)
TOP Daily Chart (Source: Thomson Reuters)
Disclaimer
The advice given by Kalkine Pty Ltd and provided on this website is general information only and it does not take into account your investment objectives, financial situation or needs. You should therefore consider whether the advice is appropriate to your investment objectives, financial situation and needs before acting upon it. You should seek advice from a financial adviser, stockbroker or other professional (including taxation and legal advice) as necessary before acting on any advice. Not all investments are appropriate for all people. Kalkine.com.au and associated pages are published by Kalkine Pty Ltd ABN 34 154 808 312 (Australian Financial Services License Number 425376). The information on this website has been prepared from a wide variety of sources, which Kalkine Pty Ltd, to the best of its knowledge and belief, considers accurate. You should make your own enquiries about any investments and we strongly suggest you seek advice before acting upon any recommendation. Kalkine Pty Ltd has made every effort to ensure the reliability of information contained in its newsletters and websites. All information represents our views at the date of publication and may change without notice. To the extent permitted by law, Kalkine Pty Ltd excludes all liability for any loss or damage arising from the use of this website and any information published (including any indirect or consequential loss, any data loss or data corruption). If the law prohibits this exclusion, Kalkine Pty Ltd hereby limits its liability, to the extent permitted by law to the resupply of services. There may be a product disclosure statement or other offer document for the securities and financial products we write about in Kalkine Reports. You should obtain a copy of the product disclosure statement or offer document before making any decision about whether to acquire the security or product. The link to our Terms & Conditions has been provided please go through them and also have a read of the Financial Services Guide. On the date of publishing this report (mentioned on the website), employees and/or associates of Kalkine Pty Ltd do not hold positions in any of the stocks covered on the website. These stocks can change any time and readers of the reports should not consider these stocks as advice or recommendations.
 AU
AU

 Please wait processing your request...