.png)
Stocks’ Details
Cromwell Property Group
Strong and Stable Balance Sheet: Cromwell Property Group (ASX: CMW) is an internally managed Australian Real Estate Investment Trust (A-REIT) and a property fund manager. As on 27 February 2020, the market capitalisation of the company stood at ~$3.08 billion. The company has announced the retirement of Mr Geoffrey H Levy from the position of independent non-executive chair.CMW has recently released its half-year results for the period ending 31 December 2019, wherein it reported strong balance sheet, asset enhancement capabilities and transactional profits. During 1H20, statutory profit witnessed an increase of 104.6% to $227.3 million, up from $111.11 million in 1H19. In the same time span, balance sheet expanded, and total assets increased by $1,494 million.
.png)
1H20 Financial Performance (Source: Company Reports)
Future Expectations and Guidance: CMW is well-positioned to meet possible risks and is focused on continuous execution of ‘Invest to Manage’ strategy. The company has re-affirmed its FY20 operating profit guidance and expects it to be 8.3 cents per share. It also anticipates distributing 7.5 cps, representing an operating profit yield of 7.03% and a distribution yield of 6.36%.
Valuation Methodology: Price to Cash Flow Based Valuation
.png)
Price to Cash Flow Based Valuation (Source: Thomson Reuters)
Note: All the forecasted figures are taken from Thomson Reuters, NTM: Next Twelve Months
Stock Recommendation: As per ASX, the stock of CMW gave a return of 1.29% on YTD basis, and is inclined towards 52-week low of $1.080. This offers a good opportunity for investors to enter the market. During FY19, gross margin of the company stood at 86.7%, higher than the industry median of 72.1%. In the same time span, EBITDA margin of the company witnessed a slight improvement over the past year and stood at 49%, up from 32.2% in FY18. Considering the returns, current trading levels, higher gross margin and decent outlook, we have valued the stock using price to cash flow-based valuation method and arrived at a target upside of lower double-digit (in % terms). Hence, we recommend a “Buy” recommendation on the stock at the current market price of $1.170, down by 0.847% on 27 February 2020.
Vicinity Centres
Improvement in Sales Growth and Strong Investment Grade Credit Ratings: Vicinity Centres (ASX: VCX) is engaged in investment, management, development and leasing of property. As on 27 February 2020, the market capitalisation of the company stood at ~$8.49 billion. Till date, the company has bought back 210,362,861 securities via on-market buyback program for a consideration of $543,222,164.33. The company has recently released its half-year report wherein it reported a steady improvement in sales growth. During 1H20, the company reported a strong balance sheet with strong investment-grade credit ratings and enhanced debt profile. In the same time span, statutory net profit stood at $242.8 million, and FFO per security was 8.95 cents.
.png)
FY20 Interim Results (Source: Company Reports)
What to Expect: The company has revised its FY20 guidance and expects FFO per security to be in the range of 17.2 cents to 17.4 cents. VCX also anticipates maintenance capex in the range of $80 million to $90 million and a dividend payout ratio at the upper end of 95-100% of AFFO.
Valuation Methodology: EV/EBITDA Based Valuation
.png)
EV/EBITDA Based Valuation (Source: Thomson Reuters)
Note: All the forecasted figures are taken from Thomson Reuters, NTM: Next Twelve Months
Stock Recommendation: As per ASX, the stock of VCX is trading close to its 52-week low of $2.220, proffering a decent opportunity for accumulation. During FY19, gross margin and EBITDA margin of the company was in line with the industry margin and stood at 73.7% and 63.1%. Considering the trading levels, decent outlook and strong balance sheet, we have valued the stock using EV/EBITDA relative valuation method and arrived at a target upside of lower double-digit (in percentage terms). Hence, we recommend a “Buy” rating on the stock at the current market price of $2.280, up by 0.885% on 27 February 2020.
Scentre Group
Strong Financial Position: Scentre Group (ASX: SCG) is engaged in property management and development. As on 27 February 2020, the market capitalisation of the company stood at ~$18.75 billion. Till date, the company has bought back 114,511,991 securities via on-market buyback program for a consideration of $436,935,662.17. The company has recently released its half-year results, wherein it reported a slight increase in operating earnings of 1% to $1.287 billion. The company has witnessed strong demand from its retail and brand partners and introduced 344 new brands in its store network. The group has a strong financial position with interest coverage of 3.6 times and a credit rating of ‘A’ by S&P, Fitch and Moody’s.
.png)
Operational and Financial Performance (Source: Company Reports)
Future Guidance: For the 12 months ending 31 December 2020, the company forecasts operating earnings to be between 24.75 to 24.8 cents per share, representing a growth of approximately 3.1%. It also anticipates project income of approximately $28 million and FFO of roughly 25.30 cents per share. The distribution for 2020 is forecasted to grow by 3% and be around 23.28 cents per security.
Valuation Methodology: Price to Earnings Based Valuation
.png)
Price to Earnings Multiple Based Approach (Source: Thomson Reuters)
Note: All the forecasted figures are taken from Thomson Reuters, NTM: Next Twelve Months
Stock Recommendation: As per ASX, the stock of SCG is trading very close to its 52-weeks low level of $3.530, proffering a decent opportunity for accumulation. During FY19, gross margin and EBITDA margin witnessed a slight improvement over the past year and stood at 69.3% and 66%, up from 68.5% and 65.2%, respectively. Considering the current trading levels, improvement in margins and positive guidance, we have valued the stock using price to earnings based relative valuation method and arrived at a target upside of lower double-digit (in percentage terms). Hence, we recommend a “Buy” rating on the stock at the current market price of $3.550, down by 0.838% on 27 February 2020.
Sunland Group Limited
Strong Balance Sheet: Sunland Group Limited (ASX: SDG) is in the business of residential property development and construction. As on 27 February 2020, the market capitalisation of the company stood at ~$227.27 million. The company has recently released its interim results for the period ending 31 December 2019, wherein it reported strong balance sheet capacity with cash balance of $14.3 million and statutory NPAT of $9.4 million. In the same time span, earnings per share stood at 7 cents. The group achieved development margin of 40%, exceeding the target of 20% on returns on costs. The company also intends to undertake off-market buy-back of up to 25% of issued shares, representing a maximum of $6 million worth of shares.
.png)
Key Operational Highlights (Source: Company Reports)
Growth Opportunities: The company is focused on delivering stable and consistent performance and will continue to expand its integrated housing strategy, enabling the company to mitigate the risk through staged delivery. SDG expects niche opportunities for the downsizer market and is anticipating low maintenance luxury dwellings.
Stock Recommendation: As per ASX, the stock of SDG gave a return of 4.73% in the past six months and a return of 5.73% in the last three months. During 1H20, net margin of the company witnessed a substantial improvement over the previous half and stood at 16.4%, up from 8.1% in 2H19. In the same time span, ROE went up to 2.7% from 1.7% in 2H19. On TTM basis, the stock is trading at an EV/Sales multiple of 1.3x, lower than the industry (Financials) median of 6.4x. Considering the returns, improvement in net margin and decent growth opportunities, we recommend a “Speculative Buy” rating on the stock at the current market price of $1.695, up by 2.108% on 27 February 2020, owing to its recent release of interim results.
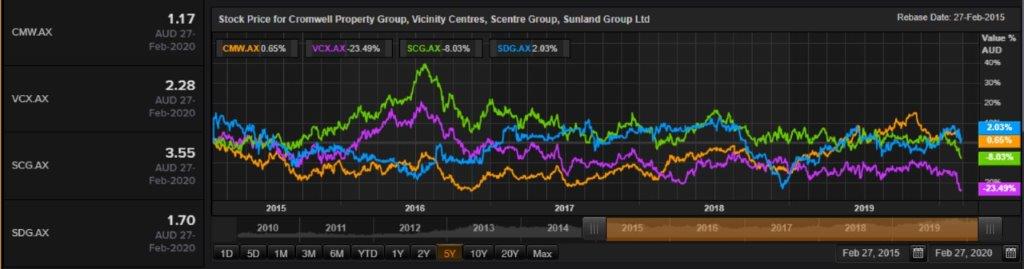
Comparative Price Chart (Source: Thomson Reuters)
Disclaimer
The advice given by Kalkine Pty Ltd and provided on this website is general information only and it does not take into account your investment objectives, financial situation or needs. You should therefore consider whether the advice is appropriate to your investment objectives, financial situation and needs before acting upon it. You should seek advice from a financial adviser, stockbroker or other professional (including taxation and legal advice) as necessary before acting on any advice. Not all investments are appropriate for all people. Kalkine.com.au and associated pages are published by Kalkine Pty Ltd ABN 34 154 808 312 (Australian Financial Services License Number 425376). The information on this website has been prepared from a wide variety of sources, which Kalkine Pty Ltd, to the best of its knowledge and belief, considers accurate. You should make your own enquiries about any investments and we strongly suggest you seek advice before acting upon any recommendation. Kalkine Pty Ltd has made every effort to ensure the reliability of information contained in its newsletters and websites. All information represents our views at the date of publication and may change without notice. To the extent permitted by law, Kalkine Pty Ltd excludes all liability for any loss or damage arising from the use of this website and any information published (including any indirect or consequential loss, any data loss or data corruption). If the law prohibits this exclusion, Kalkine Pty Ltd hereby limits its liability, to the extent permitted by law to the resupply of services. There may be a product disclosure statement or other offer document for the securities and financial products we write about in Kalkine Reports. You should obtain a copy of the product disclosure statement or offer document before making any decision about whether to acquire the security or product. The link to our Terms & Conditions has been provided please go through them and also have a read of the Financial Services Guide. On the date of publishing this report (mentioned on the website), employees and/or associates of Kalkine Pty Ltd do not hold positions in any of the stocks covered on the website. These stocks can change any time and readers of the reports should not consider these stocks as advice or recommendations.
 AU
AU

 Please wait processing your request...