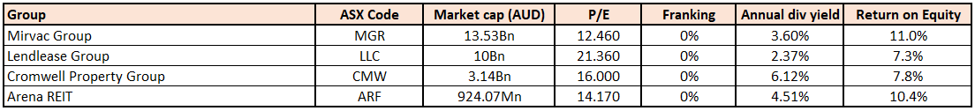
Stocks’ Details
Mirvac Group
Decent Rise in EBIT: Mirvac Group (ASX: MGR) is engaged in real estate investment, development, third party capital management and property asset management. For the half-year ended 31 December 2019, the company reported operating earnings before interest and tax of $460 million, up from $390 million in 1H19. In the same time span, the company’s Statutory profit after tax went down by 5% to $613 million from $648 million in 1H19. This was mainly due to the strong increase in operating earnings which was offset by lower revaluation gains. The company also reported the financial results for 1H20 for Mirvac Property Trust, wherein revenue of the company stoodat $707.4 million with profit before income tax of $546.5 million. Owing to the decent financial performance, the company declared a dividend of 6.1 cents per share on ordinary fully paid shares which will be paid on 28 February 2020.
Portfolio Overview: The company has recently provided an overview of its total portfolio, wherein it stated that it has a total of 55 properties with a book value of $11,895m3. The portfolio has three types of property office, which represents 62% of the portfolio, followed by retail of 30% and industrials of 8%.
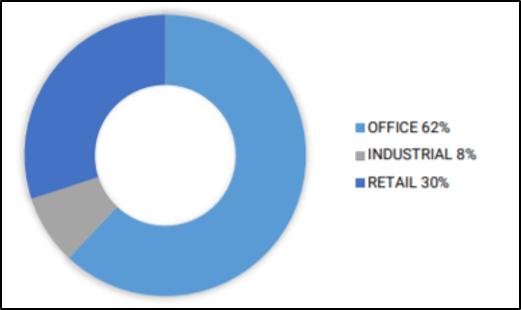
Sector Diversification (Source: Company Reports)
What to Expect: The company is expected to be more resilient against cyclical downturns and is on track to be a record year for apartment settlements. MGR has placed its focus on restocking, unlocking and releasing in response to undersupply in core markets of Sydney and Melbourne. The company has given its EPS guidance and expects a growth of 3-4% in EPS and anticipates it to be between 17.6 to 17.8 cps.
Valuation Methodology: EV/EBITDA Multiple Approach
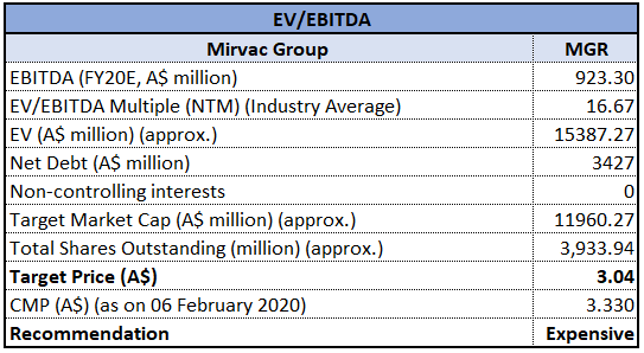
EV/EBITDA Multiple (Source: Thomson Reuters)
Note: All the forecasted figures are taken from Thomson Reuters, NTM: Next Twelve Months
Stock Recommendation: As per ASX, the stock of MGR gave a return of 7.84% on the YTD basis and a return of 6.5% in the past one month. The stock is also trading close to its 52-week high of $3.525. During FY19, gross margin of the company was in line with the previous year and stood at 43.6%. In the same time span, ROE of the company was 11% as compared to the industry median of 9.4%. Considering the returns, trading levels, high ROE and decent outlook, we have valued the stock using EV/EBITDA based relative valuation method and arrived at a downside of higher single-digit (in percentage terms). For the said purpose, we have considered Scentre Group (ASX: SCG), Dexus (ASX: DXS), Lendlease Group (ASX: LLC), etc., as peers. Hence, we give an “Expensive” rating on the stock at the current market price of $3.330, down by 3.198%, owing to its recent release of 1H20 results.
Lendlease Group
Lendlease to divest Engineering business: Lendlease Group (ASX: LLC) operates in the areas of retail property management, asset management and development, large scale urban regeneration and greenfield development projects. The company has recently entered into an agreement to sell its Engineering business to Acciona Infrastructure Asia Pacific for a consideration of $180 million. The transaction is expected to be completed by 1H CY20. In the recently held AGM, the management stated that the core business delivered a strong result with profit after tax of $804 million.
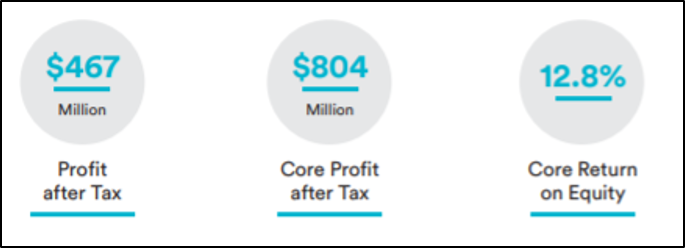
FY19 Financial Performance (Source: Company Reports)
Growth Opportunities: The company started FY20 with a strong financial position and expects gearing to increase target range of 10 to 20%. The company has also started exploring potential capital partners and funding solutions to improve investment returns.
Valuation Methodology: Price to Earnings Multiple Based Approach

Price to Earnings based Multiple Approach (Source: Thomson Reuters)
Note: All the forecasted figures are taken from Thomson Reuters, NTM: Next Twelve Months
Stock Recommendation: As per ASX, the stock of LLC gave a return of 24.11% in the past six months and is inclined towards its 52-weeks’ high level of $19.95. Over the span of 4 years, the company witnessed a CAGR of 5.64% in revenue. During FY19, ROE of the company was 7.3%. Considering the returns, trading levels and decent growth opportunities, we valued the stock using Price/Earnings based valuation methodology and have arrived at a target upside of higher single-digit (in percentage terms). Hence, we recommend a “Hold” rating on the stock at the current market price of $18.370, up by 3.727% on 6 February 2020.
Cromwell Property Group
Extension of On-Market Buyback: Cromwell Property Group (ASX: CMW) is an internally managed Australian Real Estate Investment Trust and a property fund manager. The company has recently announced that Mr. Leon Blitz is appointed for the role of Chair and Mr. Andrew Fay will become Deputy Chair. The company has also announced an extension of its on-market buyback until Friday 15 January 2021.
Decent Rise in AUM and Strong Balance Sheet: In the recently held AGM, the management stated that operating profit for FY19 went up by 11.1% and stood at $174.2 million, up from $156.8 million in last year. In the same time span, the company has reduced its gearing to 35%. The total segment AUM increased by 3.2% to $9 billion. This was mainly due to an increase in retail AUM with the unchanged wholesale AUM.
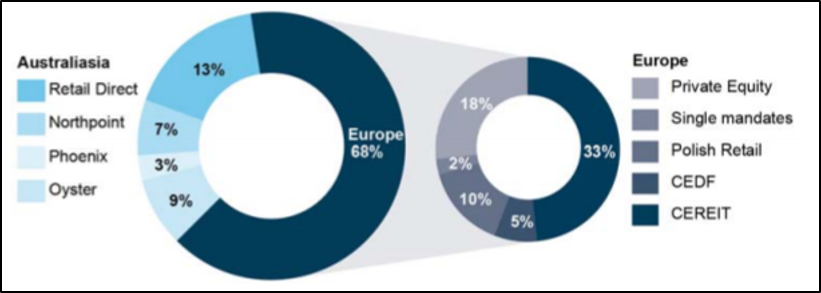
Cromwell Funds Under Management (Source: Company Reports)
What to Expect: The company gave guidance for FY20 operating profit and expects to be at least 8.30 cps and affirmed the distribution guidance at no less than 7.50 cps. This represents an operating profit yield of 6.7% and a distribution yield of 6.0%, respectively.
Valuation Methodology: EV/EBITDA multiple Approach
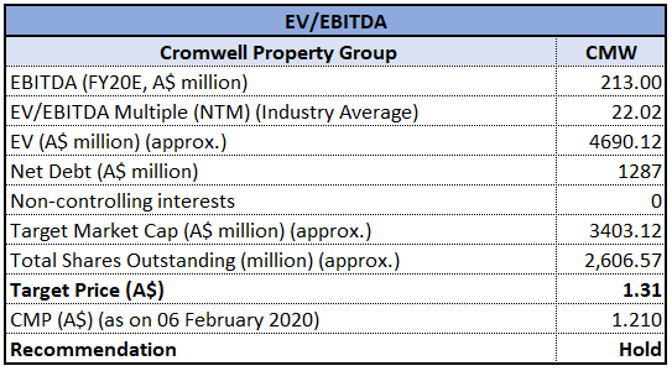
EV/EBITDA multiple Approach (Source: Thomson Reuters)
Note: All the forecasted figures are taken from Thomson Reuters, NTM: Next Twelve Months
Stock Recommendation: As per ASX, the stock of CMW gave a return of 3.43% on the YTD basis and a return of 1.26% in the past one month. Over the span of 4 years, the company witnessed a CAGR of 4.06% in revenue and a CAGR of 4.8% in gross profit. During FY19, gross margin of the company was 86.7% as compared to the industry median of 72.2%. Considering the returns, CAGR in gross profit and higher gross margin, we have valued the stock using EV/EBITDA based relative valuation method and arrived at a target upside of higher single-digit (in percentage terms). For the said purpose, we haveconsidered Growthpoint Properties Australia Ltd (ASX: GOZ), National Storage REIT (ASX: NSR), Centuria Industrial Reit (ASX: CIP), etc., as peers. Hence, we recommend a “Hold” rating on the stock at the current market price of $1.210, up by 0.415% on 6 February 2020.
Arena REIT
December Quarter Distribution Components: Arena REIT (ASX: ARF) owns, manages and develops social infrastructure properties across Australia. As per ASX, the market capitalization of the company stood at $924.07 million. Arena REIT Management Limited has recently declared that Arena REIT No. 1 and Arena REIT No. 2 trusts are withholding managed investment trusts for the purposes of Subdivision 12-H of Schedule 1 of the Taxation Administration Act 1953 in respect of the distribution of 3.575 cents declared for the period covering 1 October 2019 to 31 December 2019, which is to be paid on 6 February 2020. The company has recently announced that it will release its HY2020 results on 13 February 2020.
Strong Result and Earnings Growth: During FY19, net operating profit of the company went up by 8.7% on FY18 and stood at $37.7 million. This resulted in the EPS to increase by 5.3% to 13.8 cents.
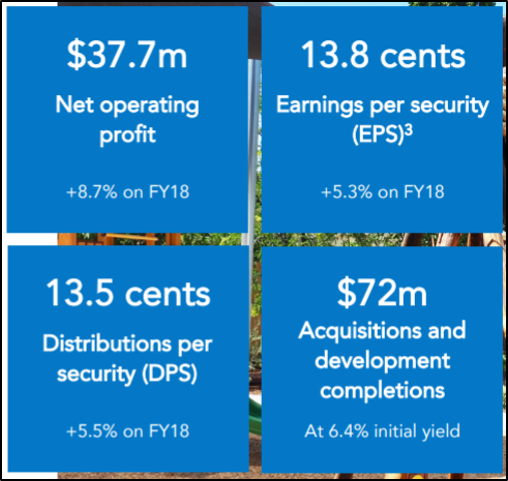
Financial Performance (Source: Company Reports)
What to Expect: The company has given the guidance for FY20 DPS and expects it to be approximately ~14.3 cents per share, representing an increase of 5.95% on FY19. ARF also expects new investment opportunities and anticipates debt capacity at lower incremental costs.
Valuation Methodology: EV/Sales Based Approach
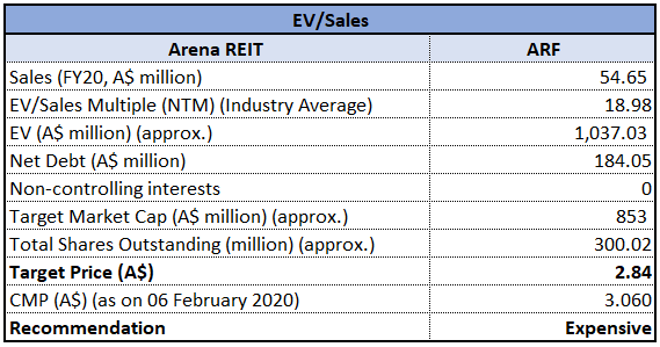
EV/Sales Multiple Approach (Source: Thomson Reuters)
Note: All the forecasted figures are taken from Thomson Reuters, NTM: Next Twelve Months
Stock Recommendation: As per ASX, the stock of ARF gave a return of 9.61% in the last six months and a return of 6.94% in the past one month. The stock is also trading close to its 52-week high of $3.140. During FY19, EBITDA margin of the company stood at 88.3%, higher than the industry median of 65.2%. In the same time span, ROE of the company was 10.4% as compared to the industry median of 9.4%. Considering the returns, trading levels, higher EBITDA margin and ROE, we have valued the stock using EV/Sales based relative valuation method and arrived at a downside of higher single-digit (in % terms).For the said purposes, we have considered Charter Hall Retail REIT (ASX: CQR), Shopping Centres Australasia Property Group Re Ltd (ASX: SCP) and Dexus (ASX: DXS) as peers. Hence, we give an “Expensive” rating on the stock at the current market price of $3.060, down by 0.649% on 6 February 2020.
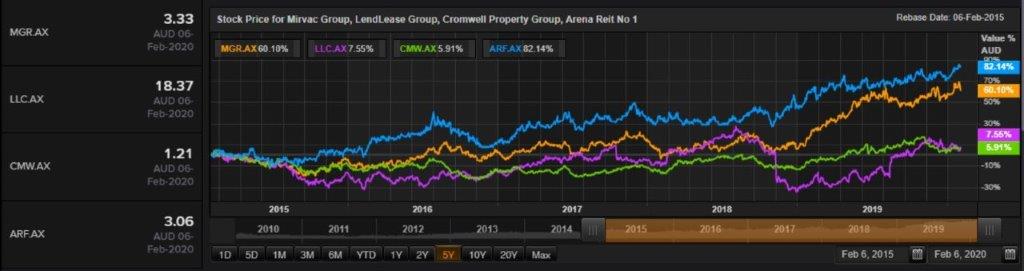
Comparative Price Chart (Source: Thomson Reuters)
Disclaimer
The advice given by Kalkine Pty Ltd and provided on this website is general information only and it does not take into account your investment objectives, financial situation or needs. You should therefore consider whether the advice is appropriate to your investment objectives, financial situation and needs before acting upon it. You should seek advice from a financial adviser, stockbroker or other professional (including taxation and legal advice) as necessary before acting on any advice. Not all investments are appropriate for all people. Kalkine.com.au and associated pages are published by Kalkine Pty Ltd ABN 34 154 808 312 (Australian Financial Services License Number 425376). The information on this website has been prepared from a wide variety of sources, which Kalkine Pty Ltd, to the best of its knowledge and belief, considers accurate. You should make your own enquiries about any investments and we strongly suggest you seek advice before acting upon any recommendation. Kalkine Pty Ltd has made every effort to ensure the reliability of information contained in its newsletters and websites. All information represents our views at the date of publication and may change without notice. To the extent permitted by law, Kalkine Pty Ltd excludes all liability for any loss or damage arising from the use of this website and any information published (including any indirect or consequential loss, any data loss or data corruption). If the law prohibits this exclusion, Kalkine Pty Ltd hereby limits its liability, to the extent permitted by law to the resupply of services. There may be a product disclosure statement or other offer document for the securities and financial products we write about in Kalkine Reports. You should obtain a copy of the product disclosure statement or offer document before making any decision about whether to acquire the security or product. The link to our Terms & Conditions has been provided please go through them and also have a read of the Financial Services Guide. On the date of publishing this report (mentioned on the website), employees and/or associates of Kalkine Pty Ltd do not hold positions in any of the stocks covered on the website. These stocks can change any time and readers of the reports should not consider these stocks as advice or recommendations.
 AU
AU

 Please wait processing your request...