.png)
Stocks’ Details
Lendlease Group
Strong Financial Position: Lendlease Group (ASX: LLC) is primarily engaged in retail property management and asset management. The market capitalisation of the company stood at $9.84 Bn as on 20th February 2020. Recently, the company has announced its results for 1HFY20, wherein it reported a solid performance and remains in a strong financial position. The company reported core business profit after tax amounting to $308 million, which helped it to generate a return on equity of 9.6%. Profit after tax for the group equated to $313 million along with earnings per stapled security of 55.5 cents and return on equity of 9.8%. The Board of the company declared an interim distribution amounting to 30 cents per security. The following picture depicts an idea of key dates for 2020:
.png)
Key Dates for 2020 (Source: Company Reports)
Future Perspectives of LLC: The company stated that the anticipated conversion of commercial and residential development opportunities for its major urbanisation projects are expected to support the near-term outlook for the core business. The core segments of the company are well-positioned and the company anticipates the urbanisation pipeline to create over $50 billion of institutional-grade assets for its capital partners and the investments platform of the Group.
Valuation Methodology:P/E Based Valuation
.png)
P/E Based Valuation (Source: Thomson Reuters)
Note: All forecasted figures and peers have been taken from Thomson Reuters, NTM: Next Twelve Months
Stock Recommendation: During 1H FY20, the company’s development pipeline increased to $112 billion along with a growing number of major urbanisation projects in its international gateway cities throughout the US and Europe. We have valued the stock using P/E based-relative valuation method and arrived at a target price, which is offering an upside of high single-digit (in percentage terms). Thus, considering the development pipeline, focus on future opportunities and decent performance in 1H FY20, we maintain a “Hold” rating on the stock at the current market price of $18.600 per share, up by 6.713% on 20th February 2020. It looks like the upside in the stock price was primarily due to the release of the first-half 2020 results.
Stockland
Robust Rise in Statutory Profit: Stockland (ASX: SGP) owns, manages and develops a range of assets, which include shopping centres, office and industrial assets, etc. The market capitalisation of the company stood at $12.37 Bn as on 20th February 2020. For the half-year ended 31st December 2019 (1H FY20), the company reported statutory profit amounting to $504 million with a rise of 68.1% against 1HFY19. During the period, the company has attained strong momentum on the delivery of strategic priorities, which include increased workplace and logistics allocation by 7% over the last 18 months, that currently reflects 26% of its portfolio by asset value. SGP reported funds from operations amounting to $384 million, with a fall of 5.6% because of the expected second half-skew. The company declared a distribution per security of 13.5 cents for the half year.
.png)
Funds from Operations (Source: Company Reports)
FFO and Distribution Guidance: The company reaffirmed its forecast for FY20 FFO per security of 37.4 cents, and distribution per security of 27.6 cents, with no material change in market conditions.
Valuation Methodology:P/E Based Valuation
.png)
P/E Based Valuation (Source: Thomson Reuters)
Note: All forecasted figures and peers have been taken from Thomson Reuters, NTM: Next Twelve Months
Stock Recommendation: Net margin of the company stood at 40.7% in 1H FY20, reflecting a YoY growth of 14.1%. This reflects that the company has improved its capabilities to convert its top-line into the bottom-line. During 1HFY20, the company reported return on equity of 5.1% as compared to the industry median of 4.6%. We have valued the stock using P/E based-relative valuation approach and for the purpose, have taken the peer group - Scentre Group (ASX: SCG), Mirvac Group (ASX: MGR), Vicinity Centres (ASX: VCX), etc. We have arrived at a target price, which is offering an upside of high single-digit (in percentage terms). Thus, in the light of growth in net margin and returns provided to shareholders, we give a “Hold” recommendation on the stock at the current market price of $5.420 per share, up by 4.432% on 20th February 2020.
Viva Energy REIT
Rise in Rental Income: Viva Energy REIT (ASX: VVR) owns and leases freehold property. The market capitalisation of the company stood at $2.21 Bn as on 20th February 2020. Recently, the company has reported FY19 as another year with strong results. The company reported statutory net profit amounting to $197.6 million, along with distributable earnings of $111.7 million. VVR witnessed a rise of 8.6% in rental income; driven by an increase in contracted rental, full-year contribution from FY18 acquisitions as well as part-year contribution from FY19 acquisitions. Final distribution for the six months ended 31st December 2019 stood at 7.19 cents per security.
.png)
Statutory Financial Performance (Source: Company Reports)
Guidance for FY20: For FY20, the company is anticipating distributable earnings growth in the range of 3.00%-3.75%. The company is also planning to evaluate its portfolio and pursue acquisitions and development opportunities.
Valuation Methodology:P/CF Based Valuation
.png)
P/CF Based Valuation (Source: Thomson Reuters)
Note: All forecasted figures and peers have been taken from Thomson Reuters, NTM: Next Twelve Months
Stock Recommendation: During FY19, the company spent an amount of $88.5 million for the acquisition of 15 properties on a weighted average capitalisation rate of 6.8%. We have valued the stock using P/CF based relative valuation method and arrived at a target price, which is offering limited upside (in percentage terms). As per ASX, the stock of VVR is trading above the average of its 52-week low and high. Hence, considering the limited upside in valuation and current trading levels, we have a watch stance on the stock at the current market price of $2.760 per share, down by 2.817% on 20th February 2020.
Sunland Group Limited
Approval of FIRB: Sunland Group Limited (ASX: SDG) is engaged in property construction and development. The market capitalisation of the company stood at $235.48 Mn as on 20th February 2020. On 2nd December 2019, the company announced that it has inked a conditional contract to sell the balance development land at Heights, Pimpama, to GemLife for a consideration of $29.7 million. In another update, the company stated that GemLife (buyer) has advised that FIRB (Foreign Investment Review Board) approval has been received and this makes the contract unconditional. However, the settlement for the same has been scheduled for mid-May 2020. The below picture provides an idea of financial metrics for FY19:
.png)
Financial Metrics (Source: Company Reports)
What to Expect: The company expects FY20 to be a period of challenges and opportunities due to the softening conditions in the current phase of the property cycle. As part of an integrated housing strategy, the company is expecting its mid-rise apartment portfolio to expand. This will help the company to address risk via staged delivery.
Stock Recommendation: Current ratio of the company stood at 5.24x in FY19 as compared to the industry median of 1.47x. This reflects that the company is in a decent position to address its short-term obligations against the broader industry. Debt to equity multiple of the company stood at 0.36x in FY19 versus the industry median of 1.07x. The stock of SDG has an EV to sales multiple of 1.3x as compared to the industry median (Real Estate Operations) of 5.3x on TTM basis. It has an EV to EBITDA multiple of 7.5x against the industry median (Real Estate Operations) 11.6x on TTM basis. The stock of SDG has provided returns of 8.18% and 11.33% during the span of three months and six months, respectively. Therefore, considering the decent liquidity position, valuation metrics and deleveraged balance sheet, we give a “Hold” recommendation on the stock at the current market price of $1.750 per share, up by 1.744% on 20th February 2020.
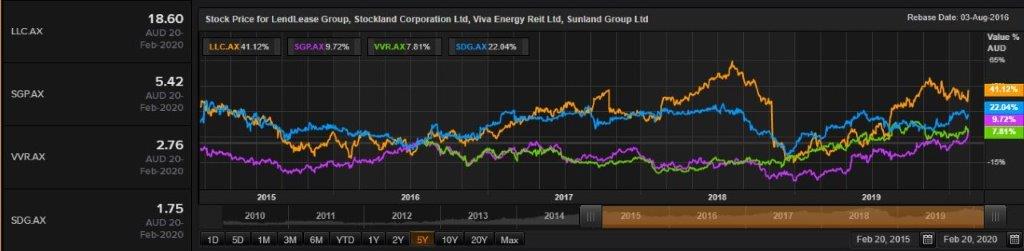
Comparative Price Chart (Source: Thomson Reuters)
Disclaimer
The advice given by Kalkine Pty Ltd and provided on this website is general information only and it does not take into account your investment objectives, financial situation or needs. You should therefore consider whether the advice is appropriate to your investment objectives, financial situation and needs before acting upon it. You should seek advice from a financial adviser, stockbroker or other professional (including taxation and legal advice) as necessary before acting on any advice. Not all investments are appropriate for all people. Kalkine.com.au and associated pages are published by Kalkine Pty Ltd ABN 34 154 808 312 (Australian Financial Services License Number 425376). The information on this website has been prepared from a wide variety of sources, which Kalkine Pty Ltd, to the best of its knowledge and belief, considers accurate. You should make your own enquiries about any investments and we strongly suggest you seek advice before acting upon any recommendation. Kalkine Pty Ltd has made every effort to ensure the reliability of information contained in its newsletters and websites. All information represents our views at the date of publication and may change without notice. To the extent permitted by law, Kalkine Pty Ltd excludes all liability for any loss or damage arising from the use of this website and any information published (including any indirect or consequential loss, any data loss or data corruption). If the law prohibits this exclusion, Kalkine Pty Ltd hereby limits its liability, to the extent permitted by law to the resupply of services. There may be a product disclosure statement or other offer document for the securities and financial products we write about in Kalkine Reports. You should obtain a copy of the product disclosure statement or offer document before making any decision about whether to acquire the security or product. The link to our Terms & Conditions has been provided please go through them and also have a read of the Financial Services Guide. On the date of publishing this report (mentioned on the website), employees and/or associates of Kalkine Pty Ltd do not hold positions in any of the stocks covered on the website. These stocks can change any time and readers of the reports should not consider these stocks as advice or recommendations.
 AU
AU

 Please wait processing your request...