HUB24 Limited
.png)
HUB Details
Healthy Financials: HUB24 Limited (ASX: HUB) posted sound results for the FY18 with $84.0 mn in revenue, an increase of 36% against $61.9 mn posted in FY17 and Gross Profit at $34.3 mn, up 65% compared to 20.8 mn in FY17. Operating cashflow for the company increased 201% to $12.2 mn for FY18. The company has declared inaugural dividend of 3.5 cents per share with ex dividend date set to 17th September 2018 and payment date as 19th October 2018.
Good Year for Distribution: HUB has invested significantly in expanding their Distribution footprint and it seems to be paying off with 61 new distribution agreements being signed with licensees, 310 new advisers added to the platform and record annual inflows of $2.4 bn. Counting on the growth opportunities, the company has revised its FUA target range to $19bn -$23bn by June 2021. Additionally, HUB24 is also looking forward to new agreements for the platform, Paragem and Agility in FY19 and beyond.
.png)
Platform Revenue and FUA (Source: Company Reports)
Rallied too far: While the company is looking poised to grow from here, given their initiatives and position in the industry, the share value might have run a bit too far, making it expensive for the investors at current juncture. Sector comparison reveals that HUB is trading at PE 108.23X, much ahead of the peers. The stock has generated YTD return of 36.07%, suggesting that there could come some correction in the share price before another leg of upward movement. A close look on the price movement reveals that after making recent high of $15.40, the rally has exhausted with price correcting in the following trading sessions. The short term weakness could persist in the stock and any movement below the support level of $13.03 could take it down further. We believe that the stock is ‘EXPENSIVE’ at the current market price of $13.26.
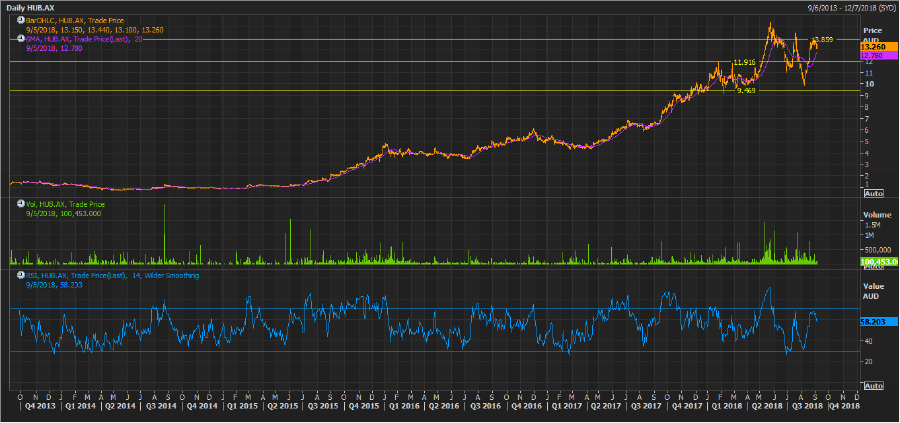
HUB Daily Chart (Source: Thomson Reuters)
Netwealth Group Ltd
.png)
NWL Details
Stock Under Pressure: Netwealth Group Limited’s (ASX: NWL) stock has been under pressure from quite some time now and post results, the price witnessed a steep fall from the higher levels. The fall has come despite good numbers posted by the company in FY18 with NPAT coming in at $29.0 mn, up 72.7% against $16.8 mn posted in FY2017. Netwealth group has a strong balance sheet and remains debt free with operating cashflow pre-tax of $39.4 mn for FY18. The company relies on advanced technology to streamline their Business operating model. However, the price challenges in the capital market industry cannot be overlooked, something that NWL has been concerned about.
.png)
Revenue Growth Rate (Source: Company Report)
It seems however, that the stock price already factored in the good results and the positive outlook of the company. The stock has generated decent YTD return of 21.92% and has entered a minor correction phase thereafter. Price had a steep fall after it failed to give the decisive breakout for the third time in span of just three months. Netwealth Group is trading at higher PE ratio of 93.70X, far more than peers and close to the industry average. Given the higher PE multiple compared to the sector peers and sluggish price movement, it seems that the investors would only consider entering the stock on a fresh bout of development, as and when it happens. The stock is just holding onto its crucial support level of $8.28 and any slip below that might result in sharp price decline. We maintain ‘EXPENSIVE’ rating on the stock at the current market price of $8.210.
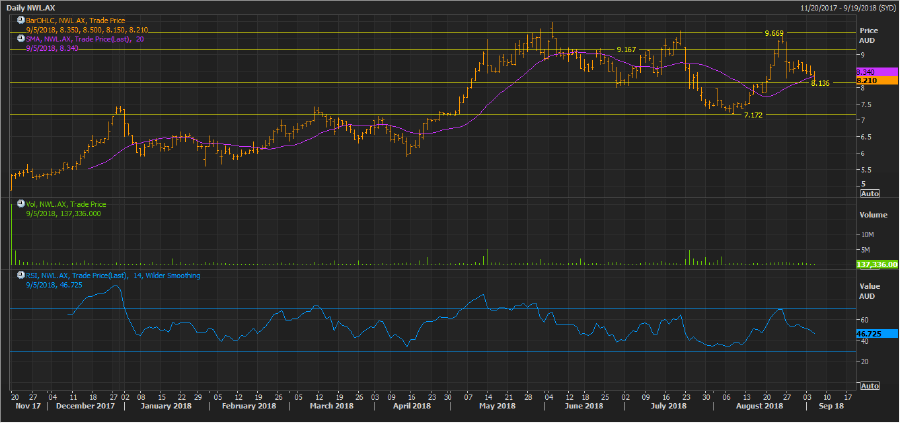
NWL Daily Chart (Source: Thomson Reuters)
Praemium Limited
.png)
PPS Details
Continues the stellar performance: Praemium Limited (ASX: PPS) has surged 42.86% in just three months on the back of strong financial performance in FY18. The company witnessed record gross asset inflows of $3.0 bn, an increase of 50% from FY2017. Underlying EBITDA was recorded at $8.8 mn, up 40% over pcp. There have been exemplary strategic developments throughout FY18 wherein the company signed key portfolios and SMA clients in addition to getting regulatory approval to sell Smartfund range of funds directly to the United Arab Emirates market. Both Australia and the United Kingdom have been profitable for the company in FY18 with revenue growing 19% and 27% respectively against previous comparable period.
Debt Free and Cash Rich: The group has reported cash and cash equivalents of $12,120,879 for FY 18 and remains debt free. It implies that Praemium can put the funds to operational uses rather than restricting them for the repayment of the debts.
Stock Performance: The stock has generated YTD return of 43.84% and looks promising on the chart for the session to come. Breakout from the level of $1.040 came on decent volumes. Although the price has retraced from the higher levels, the momentum remains intact as the stock is respecting its significant support level of $0.994. PPS is presenting a strong investment case for the investors with its stellar performance, consistent growth and stable outlook. We recommend a ‘HOLD’ on the stock at the current market price of $1.000 while it fell about 4.7% on September 05, 2018 on account of some profit booking.
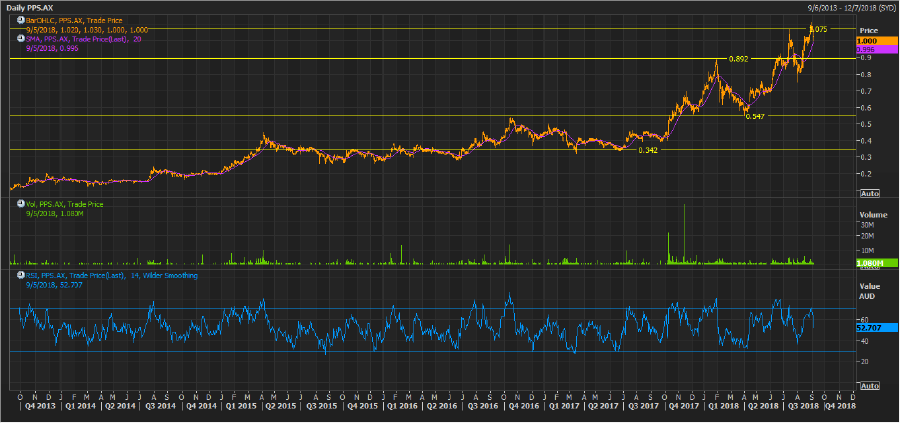
PPS Daily Chart (Source: Thomson Reuters)
Onevue Holdings Limited
.png)
OVH Details
Strong Financials: Onevue Holdings Limited (ASX: OVH) reported strong revenue growth of 20% at $49.1 mn, in FY18, compared to $40.9 mn in FY2017. NPATA for the company came in at $10 mn in FY18 compared to $2.5 mn posted in FY17. Onevue’s stellar performance was underlined by the strong organic growth of $5 mn, fueled by Fund Service and Managed Fund Administration. Recurring revenues were major contributor to the overall growth, representing 92% of the total in FY18.
.png)
Revenue Profile (Source: Company Reports)
Stock Performance: Growth and financial performance has reflected in the price as the stock generated YTD return of 19.71%. The stock is in uptrend and the momentum is expected to continue with health corrections periodically. Price corrections should offer good entry point to the investors who are looking for a balanced risk-reward ratio. After correcting from the recent high of $0.919, the stock is holding on to support level of $0.80. Momentum strength indicator does not show any significant sign of weakness or divergence in the price movement. The company is focused on deriving growth from the consistent execution of winning strategy. Moreover, recurring revenue contribution in total revenue suggests that the company is not dependent on windfall gains and has a solid business model in place to deliver growth. We maintain ‘HOLD’ on the stock at the current market price of $0.800.
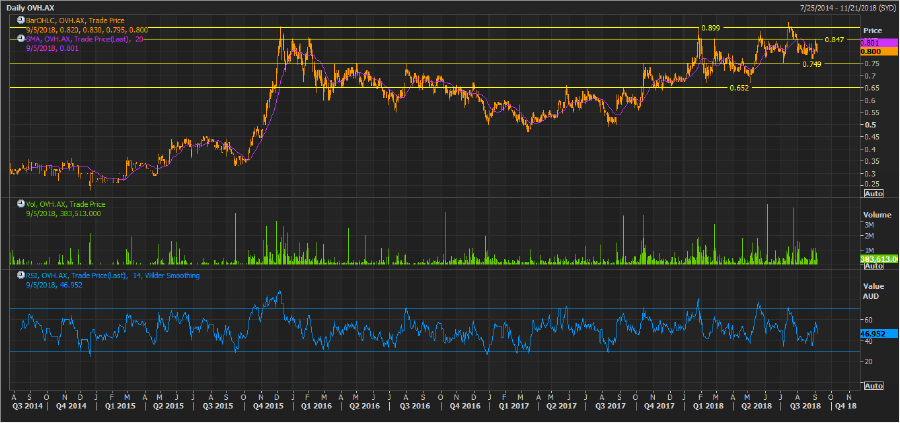
OVH Daily Chart (Source: Thomson Reuters)
Disclaimer
The advice given by Kalkine Pty Ltd and provided on this website is general information only and it does not take into account your investment objectives, financial situation or needs. You should therefore consider whether the advice is appropriate to your investment objectives, financial situation and needs before acting upon it. You should seek advice from a financial adviser, stockbroker or other professional (including taxation and legal advice) as necessary before acting on any advice. Not all investments are appropriate for all people. Kalkine.com.au and associated pages are published by Kalkine Pty Ltd ABN 34 154 808 312 (Australian Financial Services License Number 425376). The information on this website has been prepared from a wide variety of sources, which Kalkine Pty Ltd, to the best of its knowledge and belief, considers accurate. You should make your own enquiries about any investments and we strongly suggest you seek advice before acting upon any recommendation. Kalkine Pty Ltd has made every effort to ensure the reliability of information contained in its newsletters and websites. All information represents our views at the date of publication and may change without notice. To the extent permitted by law, Kalkine Pty Ltd excludes all liability for any loss or damage arising from the use of this website and any information published (including any indirect or consequential loss, any data loss or data corruption). If the law prohibits this exclusion, Kalkine Pty Ltd hereby limits its liability, to the extent permitted by law to the resupply of services. There may be a product disclosure statement or other offer document for the securities and financial products we write about in Kalkine Reports. You should obtain a copy of the product disclosure statement or offer document before making any decision about whether to acquire the security or product. The link to our Terms & Conditions has been provided please go through them and also have a read of the Financial Services Guide. On the date of publishing this report (mentioned on the website), employees and/or associates of Kalkine Pty Ltd do not hold positions in any of the stocks covered on the website. These stocks can change any time and readers of the reports should not consider these stocks as advice or recommendations.
 AU
AU

 Please wait processing your request...