Argo Investments Limited
.png)
ARG Details
Increase in Net Tangible Assets: Argo Investments Limited (ASX: ARG) is an Australian listed investment company with the objective of maximising long-term returns to shareholders through a balance of capital and dividend growth. Net Tangible Asset (NTA) per share as on 30 April 2018 was $7.84 per share which included all the costs related to company tax and tax payable on all the gains which are realised from the portfolio sales.After deducting all such costs, it amounted to $6.90 per share. However, Net Tangible Asset (NTA) per share increased by 3.3% in April month while comparing March month NTA which was around $7.59 per share. As per the latest NTA report, Westpac Banking Corporation, Macquarie Group, Australia and New Zealand Banking Group, and BHP Billiton are the top holdings of the group’ total asset portfolio (TAP) with weightage around 6.0%, 4.8%, 4.7%, 4.7% of Total assets, respectively, as at April 30, 2018. In addition to this, Argo uses extensive research and direct company visits to identify managed listed Australian businesses which are well placed into the market and have great potentiality to grow in future. This strategy will help to improve the group’s portfolio in year ahead.
.png)
Top 20 Investments (Source: Company Reports)
Apart from that, Argo has internally managed its management cost and does not charge fees to shareholders. This internal management structure helps to maintain low operating costs. Total revenue rose to $118.94 million during the first half of the year from $114.392 million in the prior corresponding period. The group’s cash and cash equivalents reached $184.734 million as at December 2017. Further, the issue price of the fully paid ordinary shares to be allotted to participants under the Dividend Reinvestment Plan for the fully franked interim dividend for the year ending 30 June 2018 amounted to $7.98 per share and the Dividend was paid on March 09, 2018. Moreover, few directors of the company (including Joycelyn Cheryl Morton and Roger Andrew Davis), having an indirect interest in the Group recently acquired ordinary shares under Share Purchase Plan, as at 11 April 2018. Meanwhile, the stock price was down by 5.02 per cent in the last three months as at May 08, 2018 and it is still trading at a slightly high level. We give an “Expensive” recommendation on the stock at the current market price of $7.920 considering the ongoing volatility into the equity market.
.png)
ARG Daily Chart (Source: Thomson Reuters)
Milton Corporation Limited
.png)
MLT Details
Reasonable Portfolio Performance: Milton Corporation Limited (ASX: MLT) is an investment company and has long term track record of paying fully franked dividends which are predominantly funded by the dividends received from its equity investments portfolio. Recently, the Group posted Net Tangible Assets (NTA) per share before tax of $4.54 as on April 30, 2018 while NTA per share after tax amounted to $4.01. Besides this, TPR (Total Portfolio Return), an indicator of LIC performance of MLT stood at 9.09% and it was close to the Accumulated Return of the All Ordinaries Index return (XAOAI) of 9.40% over 15 years. The group has a decent asset classification wherein Bank and other financial sector groups hold 30.6% and 12.9%, respectively as on April 30, 2018.
.png)
Decent Portfolio Performance Align with the XAOAI (Source: Company Reports)
But, the composition of the equity portfolio is not aligned with the stock exchange index in the past one year. It reflects that Milton has always invested in well managed companies that have a profitable history and are expected to grow dividends over time. Besides this, one of its Director J.E. Jarvinen, having an indirect interest in the Company acquired 12,000 shares through on-market trade. As of now, we continue to maintain our “Hold” recommendation on the stock at the current market price of $ 4.570.
.png)
MLT Daily Chart (Source: Thomson Reuters)
WAM Research Limited
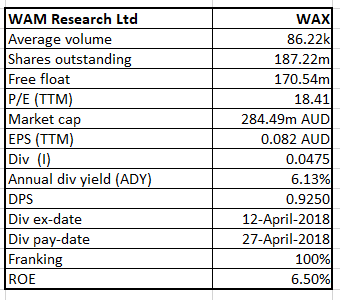
WAX Details
Decent Investment Portfolio Performance: WAM Research Limited’s (ASX: WAX) stock price edged down by 0.662 per cent as on May 09, 2018 while the group has posted an operating profit before tax (EBIT) of $20.4 Mn and an operating profit after tax of $15.1 Mn for the six months to 31 December 2017. Moreover, the group achieved investment portfolio performance of 18.7% per annum, by outperforming the index performance by 9.2% since the change in investment strategy, which was pushed by its research-driven investment process focused on identifying undervalued growth companies.
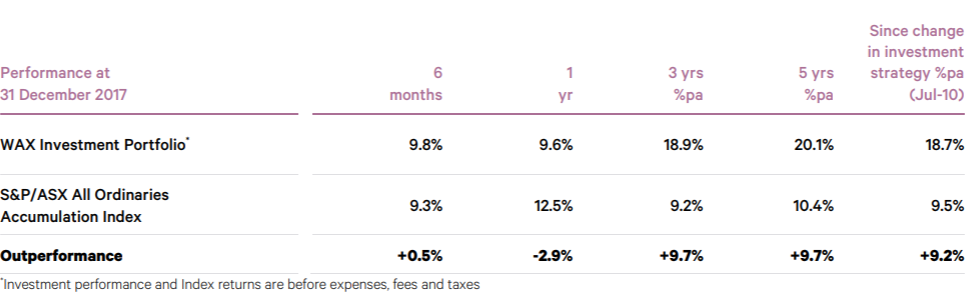
Decent Investment Portfolio Performance (Source: Company Reports)
Recently, WAM group exceeded the $16.5 Mn minimum offer proceeds in its strictly limited $550 Mn initial public offer (IPO) capital raising, which opened on 2 May 2018. In addition to this, the priority allocation of $165 Mn to the Wilson Asset Management family consists of $150 million priority allocation to shareholders of one or more of WAM Capital, WAM Leaders, WAM Microcap, WAM Research, WAM Active and Century Australia and rest $15 Mn priority allocation to past shareholders of the companies listed. WAM global shares are expected to be listed on ASX as on June 22, 2018. The Group has gained return on equity (RoE) as on average of 11.64 per cent over the last five years and entered the second half of 2018 financial year with a conservative balance sheet, a high cash weighting with no debt and with a flexible and a proven investment approach.The share price rose by 2.72 per cent in the past three months as at May 08, 2018 and we maintain our ‘Speculative Buy’ recommendation on the stock at the current price $ 1.500.
.png)
WAX Daily Chart (Source: Thomson Reuters)
Contango Income Generator Limited
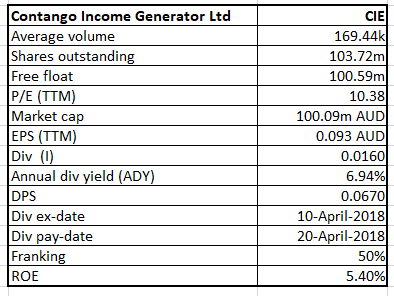
CIE Details
Targeting Gross Yield above the market: Contango Income Generator Limited’s (ASX: CIE) underperformed in the month of April with the CIE portfolio delivering only 0.69 per cent over the month as compared to the market return of 3.49 per cent. Since inception, the group has generated decent stock return of 8.15 per cent as compared to the market rise of 9.21 per cent. Besides this, Energy and Materials sector flagged up about 11% and 8%, respectively for one month. But, the fund does not have pure exposure to these sectors. However, the group has conveyed a cash weighting of approximately 15% over the past 12-18 months. This cash weighting in the fund will help to keep the portfolio’s risk profile below that of the market. The management proposes to increase the proportion of invested assets to a target of around 95% of net tangible assets. Furthermore, the Board of the company believes that the investment portfolio will be more attractive to the potential investors.
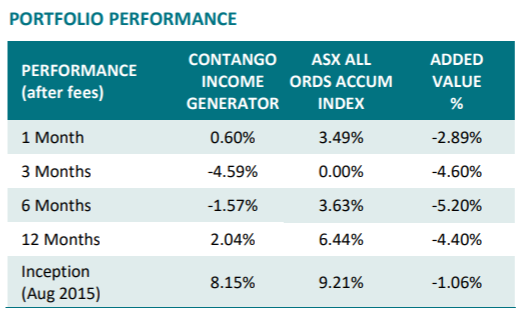
Portfolio Performance (Source: Company Reports)
On the other hand, the group's Net Tangible Assets (NTA) of investments before tax reached $0.963 (ex-distribution) as of April 30, 2018 as compared to $0.976 as at March 29, 2018. NTA after tax reached $0.957 (ex-distribution) in April 2018 as compared to $0.971 in March 2018. Meanwhile, the stock price was moderately up by 1.05 per cent in the past three months but down by 0.52 per cent in the past one week as at May 08, 2018. The group continues to target gross yield of 1% above the market with the stock portfolio which will be driven by sustainable businesses, cashflow and strong balance sheets. Hence, we maintain our “Speculative Buy” recommendation on the stock at the current price of $ 0.950.
.png)
CIE Daily Chart (Source: Thomson Reuters)
Disclaimer
The advice given by Kalkine Pty Ltd and provided on this website is general information only and it does not take into account your investment objectives, financial situation or needs. You should therefore consider whether the advice is appropriate to your investment objectives, financial situation and needs before acting upon it. You should seek advice from a financial adviser, stockbroker or other professional (including taxation and legal advice) as necessary before acting on any advice. Not all investments are appropriate for all people. Kalkine.com.au and associated pages are published by Kalkine Pty Ltd ABN 34 154 808 312 (Australian Financial Services License Number 425376). The information on this website has been prepared from a wide variety of sources, which Kalkine Pty Ltd, to the best of its knowledge and belief, considers accurate. You should make your own enquiries about any investments and we strongly suggest you seek advice before acting upon any recommendation. Kalkine Pty Ltd has made every effort to ensure the reliability of information contained in its newsletters and websites. All information represents our views at the date of publication and may change without notice. To the extent permitted by law, Kalkine Pty Ltd excludes all liability for any loss or damage arising from the use of this website and any information published (including any indirect or consequential loss, any data loss or data corruption). If the law prohibits this exclusion, Kalkine Pty Ltd hereby limits its liability, to the extent permitted by law to the resupply of services. There may be a product disclosure statement or other offer document for the securities and financial products we write about in Kalkine Reports. You should obtain a copy of the product disclosure statement or offer document before making any decision about whether to acquire the security or product. The link to our Terms & Conditions has been provided please go through them and also have a read of the Financial Services Guide. On the date of publishing this report (mentioned on the website), employees and/or associates of Kalkine Pty Ltd do not hold positions in any of the stocks covered on the website. These stocks can change any time and readers of the reports should not consider these stocks as advice or recommendations.
 AU
AU

 Please wait processing your request...