WAM Leaders Limited
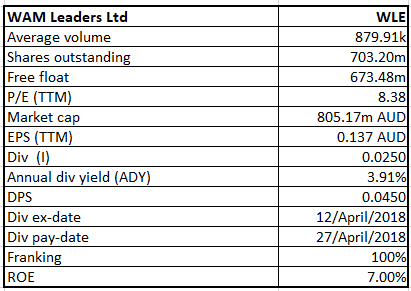
WLE Details
Decent Investment portfolio Performance Against S&P/ASX 200 Accumulation Index: WAM Leaders Limited’s (ASX: WLE) stock climbed up 1.739 per cent on July 09, 2018 following the announcement of strong performance and increased fully franked dividend. According to the announcement, the investment portfolio had increased 17.8% for the financial year to 30 June 2018, outperforming the S&P/ASX 200 Accumulation Index by 4.8%. Based on strong performance, the Board of Directors declared a fully franked full-year dividend of 5.0 cents per share, an increase of 66.7% on the previous year, with the fully franked final dividend being 2.5 cents per share, payable on 26 October 2018. The payout represents a yield of 4.3% which is ahead of the broader market, and currently, the share trades at a slight discount to its net tangible asset backing.
On the other hand, the company had recently announced the resignation of Mr. Chris Stott as a Director. Further, the Chairman stated that his resignation has taken place to allow him to focus on his role as Wilson Asset Management’s Chief Investment Officer. Moreover, Wilson Asset Management Group became the substantial holder of Greencross Limited since 22 June 2018 by holding 5.20 per cent of the voting power. Meanwhile, the stock price was up by 1.77 per cent in the past one month as at July 06, 2018 and it is trading towards to high level. While we maintain a watch on the stock, the same looks slightly “Expensive” at the current market price of $1.170, and we await for full-year result which will be out in upcoming weeks.
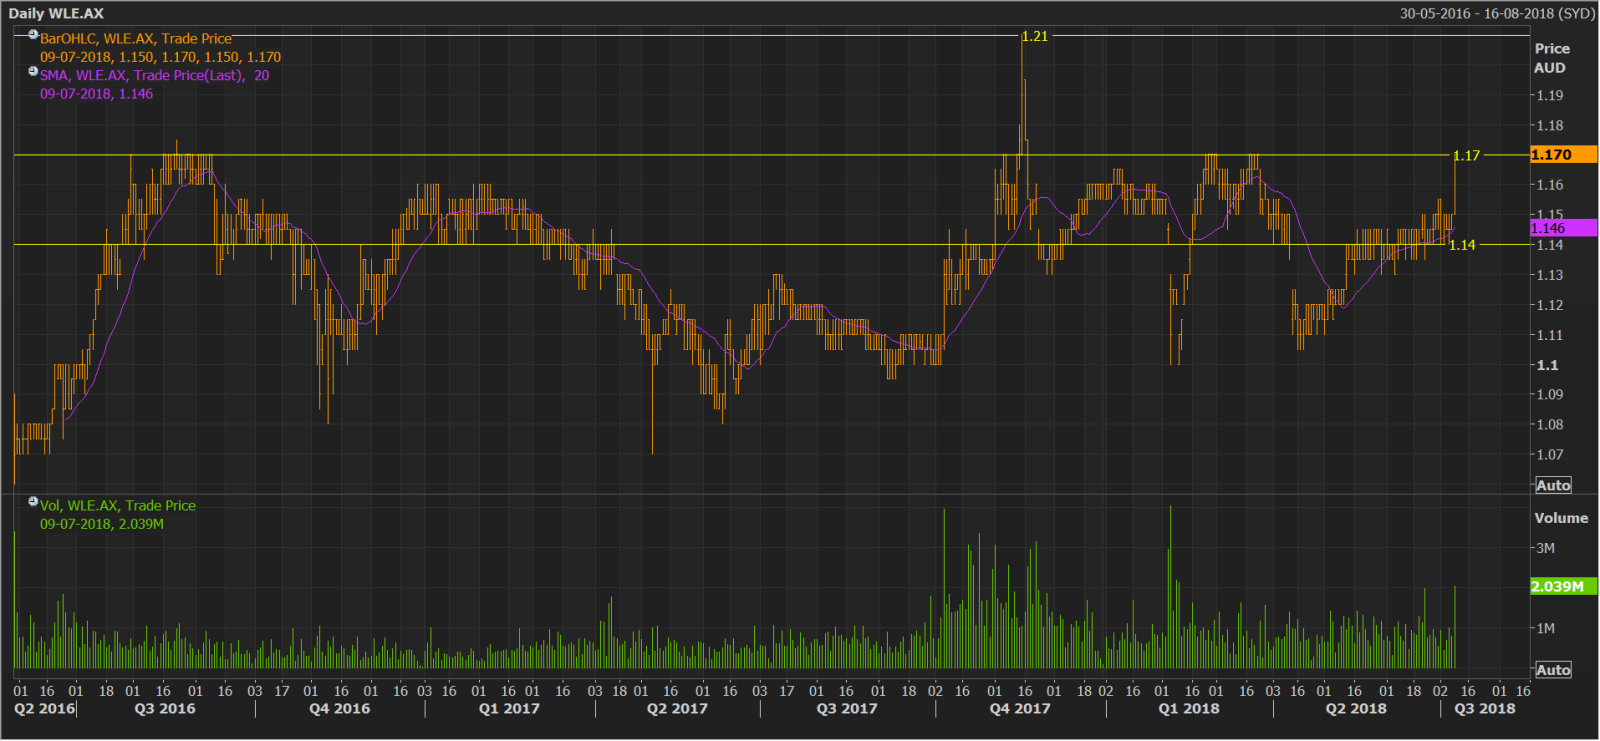
WLE Daily Chart (Source: Thomson Reuters)
WAM Microcap Limited
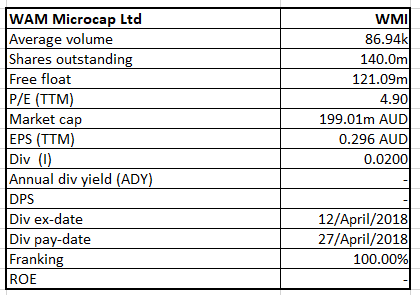
WMI Details
Outperforming Benchmark index: WAM Microcap Limited (ASX: WMI) reported decent performance for May month wherein WMI Investment Portfolio delivered a 3.9% return in one month (as of 31 May 2018) as compared to S&P/ASX Small Ordinaries Accumulation Index returns of 3.7%. For year to date (YTD) performance, WMI Investment Portfolio delivered decent returns of 26.1% (as at 31 May 2018) against the benchmark of 22.9%. Since inception, WMI Investment Portfolio generated 28.4% against the S&P/ASX Small Ordinaries Accumulation Index returns of 22.9%. The group has a decent diversified base comprising of 76.1 percent in listed equities and 23.9% in Fixed interest & cash. Moreover, the Group posted Net Tangible Assets (NTA) per share before tax of $1.33 as on May 31, 2018 while NTA per share after tax amounted to $1.27. The Group’s investment objectives are to deliver a stream of fully franked dividends, provide capital growth over the medium-to-long term and preserve shareholder capital.
.
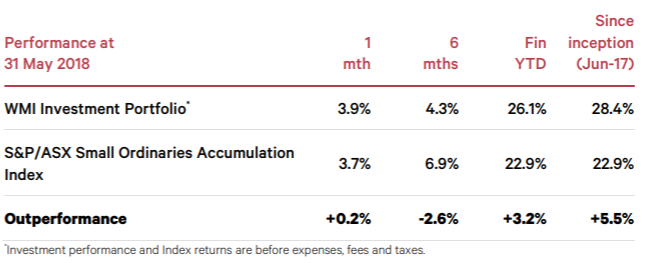
May 2018 Investment Portfolio Performance (Source: Company Reports)
On the other hand, the parent group became the substantial holder of Specialty Fashion group since 21 May 2018 by holding 9.14 per cent of the voting power. Further, the WAM group also became the substantial holder of Adairs Limited since May 2018 by holding 6.19 per cent of the voting power. Meanwhile, the stock has risen 5.45 per cent in the last one month and trading at a decent price level. Hence, we give a “Speculative Buy” recommendation on the stock at the current market price of $ 1.440, considering the continuation of strong investment performance ahead, against the benchmark index supported by well-versed research-driven strategy and market-driven investment processes.
.png)
WMI Daily Chart (Source: Thomson Reuters)
Magellan Global Trust
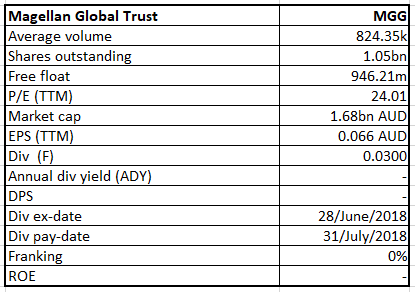
MGG Details
Decent Fund Performance: Magellan Global Trust (ASX: MGG) is an ASX listed investment trust with the objective of focusing attractive risk-adjusted returns over the medium to long term and minimize the risk of permanent capital loss. The Company released its Fund Update for the period ended 31 May 2018. The Company’s portfolio outperformed the broader market during May 2018 with a return of 3.5 per cent versus the 0.4 per cent return of its benchmark MSCI World Net Total Return Index. Moreover, the portfolio delivered returns more than the benchmark over the previous six months and since inception. The Group performed consistently which was in line with its long-term track record of delivering strong relative returns during times of market volatility. Therefore, the group aims to continue to strive towards better performance during the upcoming periods despite short-term headwinds.
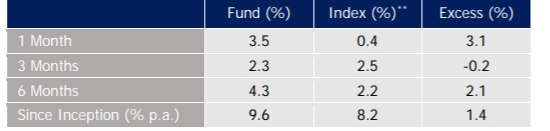
Fund Performance (Source: Company Reports)
Besides this, the Group bought back about 1,028 more shares (as of 18 June 2018) from themarket for the consideration of $1,634.52and before that it has already bought back 1,793,168 shares via on-market trade. The company is currently exercising its ability to hedge some of the capital component of the foreign currency exposure of the Fund arising from investments in overseas markets back to Australian dollars. Moreover, the company disclosed its weekly NAV per unit of Magellan Global Trust and recorded $1.6299 as at July 06, 2018. Meanwhile, the share price declined by 3.07 per cent in the past six months. Though risks in terms of currency and fees prevail, we put a “Buy” recommendation on the stock at the current market price of $ 1.570, as the group is a diversified stock with the exposure to resilient global businesses.
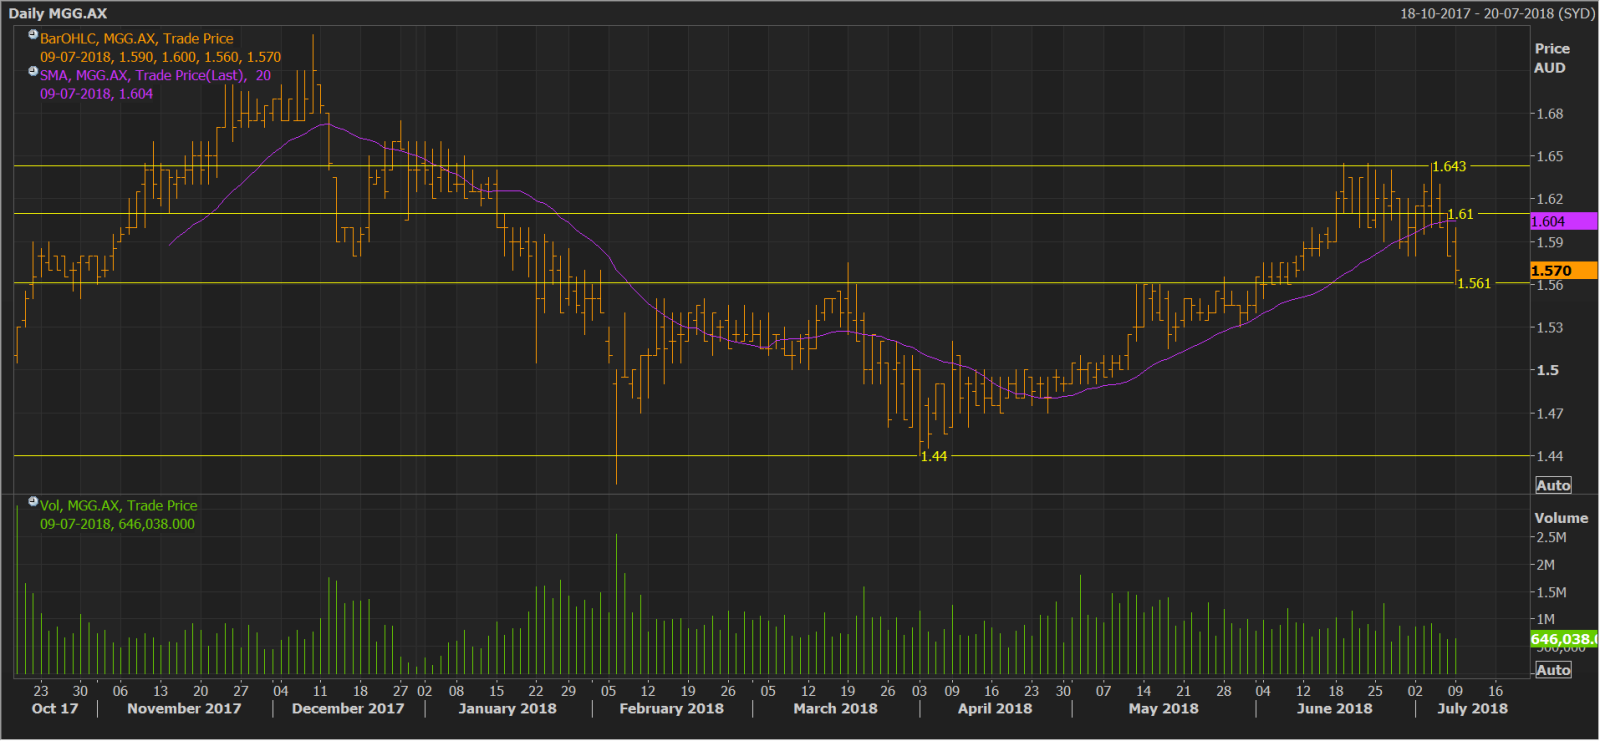
MGG Daily Chart (Source: Thomson Reuters)
Contango Income Generator Limited
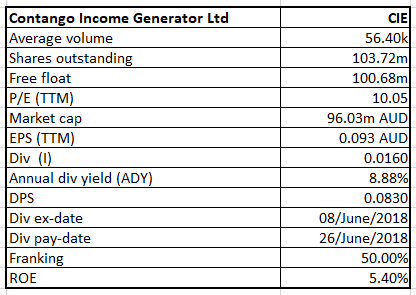
CIE Details
Performance Update as at May Month: Contango Income Generator Limited (ASX: CIE) slightly underperformed in the month of May with the CIE portfolio delivering only 1.34 per cent over the month as compared to the market return of 1.40 per cent. Since inception, the group has generated a decent stock return of 8.41 per cent as compared to the market rise of 9.46 per cent. The performance was contracted due to nervous Global market over US-China trade tension and political instability in Italy emerged late in the month. However, the size of the portfolio is $101.193 Mn as of 31 May 2018, consisting of 44 stocks. Further, the company highlighted its top 4 stocks which performed better during the month and gained a significant rise over the previous month. These are IPH Ltd, Super Retail Group, Bapcor, and Southern Cross Media that were uplifted by 23%, 17.8%, 13.6%, and 12.6%, respectively. The biggest detractor for the month was Automotive Holdings (-17.8%), declining after downgrading earnings driven by a weaker than expected recovery in sales. The group has conveyed a cash weighting of approximately 11% in the fund. The fund has started deploying more cash into the market with a target weight of 5.0% over time. We expect that the company will be prudent to allocate cash into the stock whenever the company will find solid, attractive and sustainable yields backed by good balance sheets and stable businesses.
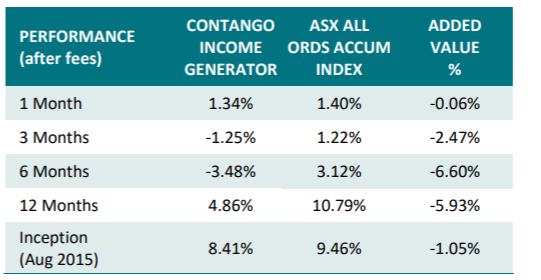
Portfolio Performance (Source: Company Reports)
As at May 31, 2018, the company showed its PE ratio of 16.3x against ASX All Ordinary Index PE level (i.e., 17.3x) and maintaining its dividend yield more than the Index benchmark. Further, the company portfolio’s beta stood at 0.8 which is lower than the Index beta of 1.0, representing it to be an undervalued stock.Although, the stock price has been declining for the last six months (down over 3.11%); looking at the overall scenario, we give a “Speculative Buy” recommendation on the stock at the current market price of $ 0.920.
.png)
CIE Daily Chart (Source: Thomson Reuters)
Disclaimer
The advice given by Kalkine Pty Ltd and provided on this website is general information only and it does not take into account your investment objectives, financial situation or needs. You should therefore consider whether the advice is appropriate to your investment objectives, financial situation and needs before acting upon it. You should seek advice from a financial adviser, stockbroker or other professional (including taxation and legal advice) as necessary before acting on any advice. Not all investments are appropriate for all people. Kalkine.com.au and associated pages are published by Kalkine Pty Ltd ABN 34 154 808 312 (Australian Financial Services License Number 425376). The information on this website has been prepared from a wide variety of sources, which Kalkine Pty Ltd, to the best of its knowledge and belief, considers accurate. You should make your own enquiries about any investments and we strongly suggest you seek advice before acting upon any recommendation. Kalkine Pty Ltd has made every effort to ensure the reliability of information contained in its newsletters and websites. All information represents our views at the date of publication and may change without notice. To the extent permitted by law, Kalkine Pty Ltd excludes all liability for any loss or damage arising from the use of this website and any information published (including any indirect or consequential loss, any data loss or data corruption). If the law prohibits this exclusion, Kalkine Pty Ltd hereby limits its liability, to the extent permitted by law to the resupply of services. There may be a product disclosure statement or other offer document for the securities and financial products we write about in Kalkine Reports. You should obtain a copy of the product disclosure statement or offer document before making any decision about whether to acquire the security or product. The link to our Terms & Conditions has been provided please go through them and also have a read of the Financial Services Guide. On the date of publishing this report (mentioned on the website), employees and/or associates of Kalkine Pty Ltd do not hold positions in any of the stocks covered on the website. These stocks can change any time and readers of the reports should not consider these stocks as advice or recommendations.
 AU
AU

 Please wait processing your request...