Magellan Global Trust
.png)
MGG Details
Decent Investment Portfolio Performance: Magellan Global Trust (ASX: MGG) has recently disclosed its weekly NAV per unit of Magellan Global Trust and recorded the same at $1.6854 as at October 19, 2018, a marginal rise of 0.1% in NAV from $1.6841 as on October 12, 2018. Besides this, the Trust has a decent portfolio which consists of 15 to 35 stocks at a time and has some exposure into cash division, comprising around 20% of an overall portfolio. The primary objectives of the Trust are to achieve attractive risk-adjusted returns over the medium to long-term while reducing the risk of permanent capital loss. Moreover, the Trust also manages its foreign currency exposure arising from investments in the overseas markets. As at 30 September 2018, the trust has total funds size of approximately A$1,827.3 Mn. Since inception, MGG Investment Portfolio generated 19.9% returns per annum against the MSCI World Net Total Return Index returns of 18.7% p.a. However, MGG reported a subdued performance for September month wherein MGG Investment Portfolio delivered a flat return in one month (as of 30 September 2018) as compared to MSCI World Net Total Return Index (AUD) returns of 0.5%, exhibiting de-growth of 0.5%. For six months’ performance, MGG Investment Portfolio delivered decent returns of 14.1% (as at 30 September 2018) against the benchmark of 13.2%. In our view, the trust has a positive outlook in term of generating decent returns from investment on the back of its strategic investment approach in its well-diversified portfolio.
.png)
Fund Performance (Source: Company Reports)
Meanwhile, MGG stock price has risen 13.80% in the past six months as at October 22, 2018 and traded at a reasonable PE level of 10.40x. By looking at its historical investment return performance, we, therefore, maintain our “Buy” recommendation on the stock at the current market price of $1.680.
.png)
MGG Daily Chart (Source: Thomson Reuters)
WAM Capital Limited
.png)
WAM Details
Update on Takeover Bid of Wealth Defender Limited: WAM Capital Limited (ASX: WAM) has recently announced an update on off-market takeover bid of the entire issued capital of Wealth Defender Limited in which WAM holds approximately 70.48% stake of WDE as on October 22, 2018. As per the release, if shareholders do not accept the WAM offer then WDE’ share price will fall and may be delisted on ASX. And, the shareholders will not be eligible to receive the fully franked WAM Capital dividend of 7.75 cents per share. The closing date of this takeover offer is 26 October 2018. Importantly, the aforesaid takeover offer equates one WAM share for every 2.5 Wealth Defender shares, representing a premium of 15.1% to the Wealth Defender share price on 29 August 2018. With this deal, WAM Capital shareholders will be benefited from realizing all or part of WAM’s 16.27% holding of Wealth Defender shares that were purchased at a discount to the pre-tax NTA. In addition to this, the all-scrip offer allows WAM shareholders to benefit from new shares issued at a premium to the WAM pre-tax NTA.
Recently, WAM has changed its registered office and principal place of business to Level 26, Governor Phillip Tower 1 Farrer Place Sydney, NSW 2000, effective from Monday, 22 October 2018. In the meantime, the share has risen 3.75% in the past three months as at October 22, 2018 and traded at reasonable PE multiple of 12.90x. Based on mixed updates, we, therefore, maintain our “Hold” recommendation on the stock at the current market price of $2.470.
.png)
WAM Daily Chart (Source: Thomson Reuters)
Pengana Capital Group Limited
.png)
PCG Details
Decent Performance in FY18: Pengana Capital Group Limited (ASX: PCG) is a small-cap funds management group with the market capitalization of circa $325.32 Mn as of October 23, 2018. It focuses on delivering distinct investment strategies that produce superior risk-adjusted returns to investors along with a focus on capital preservation. At the end of September 2018, PCG reported total Funds Under management (FUM) of $3,423.2 million compared to $3,495.7 million in the previous month ended 31 August 2018. This excludes the dividend of $8.1 Mn with an ex-date in September 2018. On the other hand, PCG delivered an underlying profit after tax of $12.4 million for the year ending 30 June 2018, displaying underlying earnings of 12.19 cents per share. It was mainly derived from the $7.0 million statutory profit after tax, adding back $3.1 million of non-cash amortization expenses, $2.1 million of interest on the off-balance sheet employee Loan Funded Share Plan and $0.2 million in unrealized investment gains accounted through equity. Based on FY18 performance, the Board of Directors declared a final fully franked dividend of 6.5 cents per share and it was paid on September 28, 2018 to its shareholders. This summarized a total dividend payment of 13 cents per share for the full year. As of now, the group is working on plans to launch global private equity listed investment trust in the next year. In addition to this, the Trust will provide investors with exposure to a diversified portfolio of private equity investments that includes funds, secondaries, directs, co-investments and other opportunistic strategies. This would be Australia’s first global private equity listed investment trust.
.png)
Historical Growth in FUM (Source: Company Reports)
Meanwhile, the share price has fallen 5.97% in the past three months as of October 22, 2018 and traded at higher PE multiple of 35.470x. As of now, the stock traded at a significant discount to a 12-month high of $3.95 against lower premium to a 12-month low of $2.89. We have a wait and watch view on the stock at the current price of $3.10 and we look for key catalysts for growth.
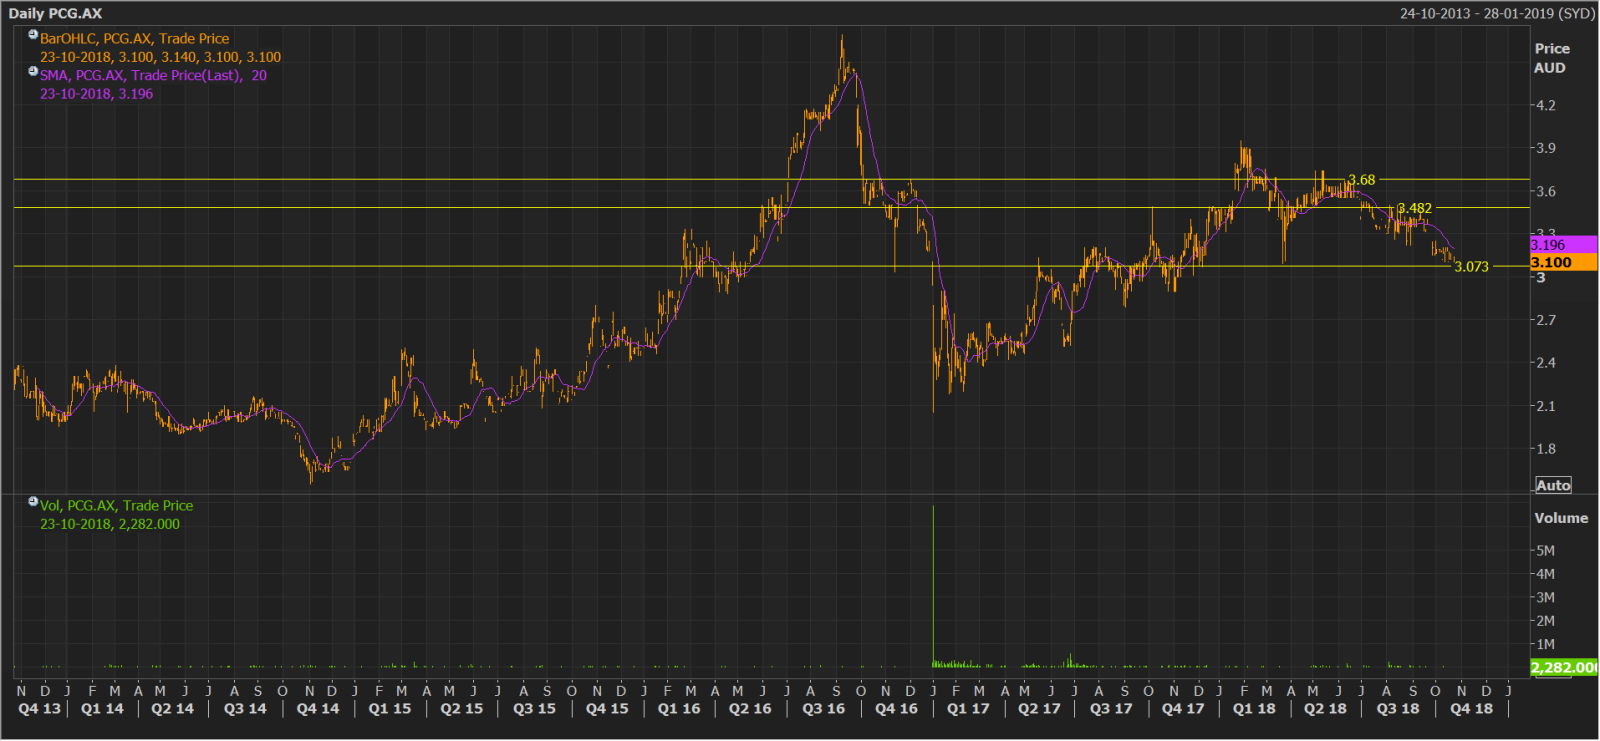
PCG Daily Chart (Source: Thomson Reuters)
Ellerston Global Investments Limited
.png)
EGI Details
Decent Fund Performance: Ellerston Global Investments Limited (ASX: EGI) reported decent performance for September month wherein EGI Portfolio delivered a 1.60% net return in one month (as of 30 September 2018) as compared to MSCI World Index (Local) returns of 0.73%. For Six months’ performance, EGI Portfolio delivered decent returns of 7.02% (as at 30 September 2018) against the benchmark of 9.05%. Since 1 November 2014, EGI net fund Portfolio generated 50.86% returns per annum against the MSCI World Index (Local) returns of 43.50%. Moreover, the Group posted Net Tangible Assets (NTA) per share before tax of $1.1855 as on September 30, 2018 while NTA per share after tax amounted to $1.1546. Overall, EGI’s holdings performed strongly during September month, of which, 4 of the stocks held were over 5.0% higher for the month. These included Equiniti Group Plc, Zayo Group Holdings Inc, Interxion Holding NV, and Entertainment One Ltd. On the financial front, The Company recorded a pre-tax profit of $12,984,465 and a net profit after income tax expense of $9,513,166 in FY18. Further, the Board of Directors declared a final dividend of 1.5 cents per share, which was paid on October 05, 2018 to its shareholders. After the payment of the dividend, the Company had a dividend profit reserve of 7.7 cents per share on current shares on issue. This provides the Company with over 2 years of capacity to pay future shareholder dividends as it currently intends to pay 3 cents per annum fully franked (1.5 cents per half).
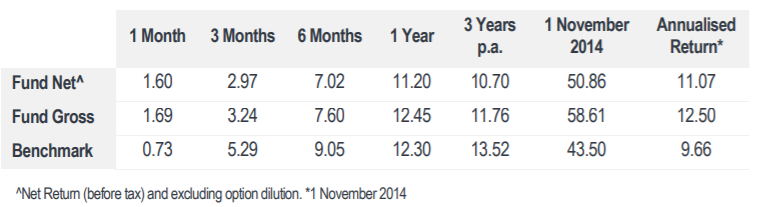
Fund Performance (Source: Company Reports)
Recently, the company disclosed the result of Annual General Meeting (AGM) wherein the shareholders of the company have approved several resolutions such as adoption of remuneration report, re-elected Paul Dortkamp as a Non-executive Director with highest voting rights. Meanwhile, the stock has generated a negative YTD return of 7.39%. It would witness a rebound as the 14-day RSI is approaching towards its oversold region. For this purpose, the default value has been taken into consideration. Hence, the stock is a close watch at the price of $1.04.
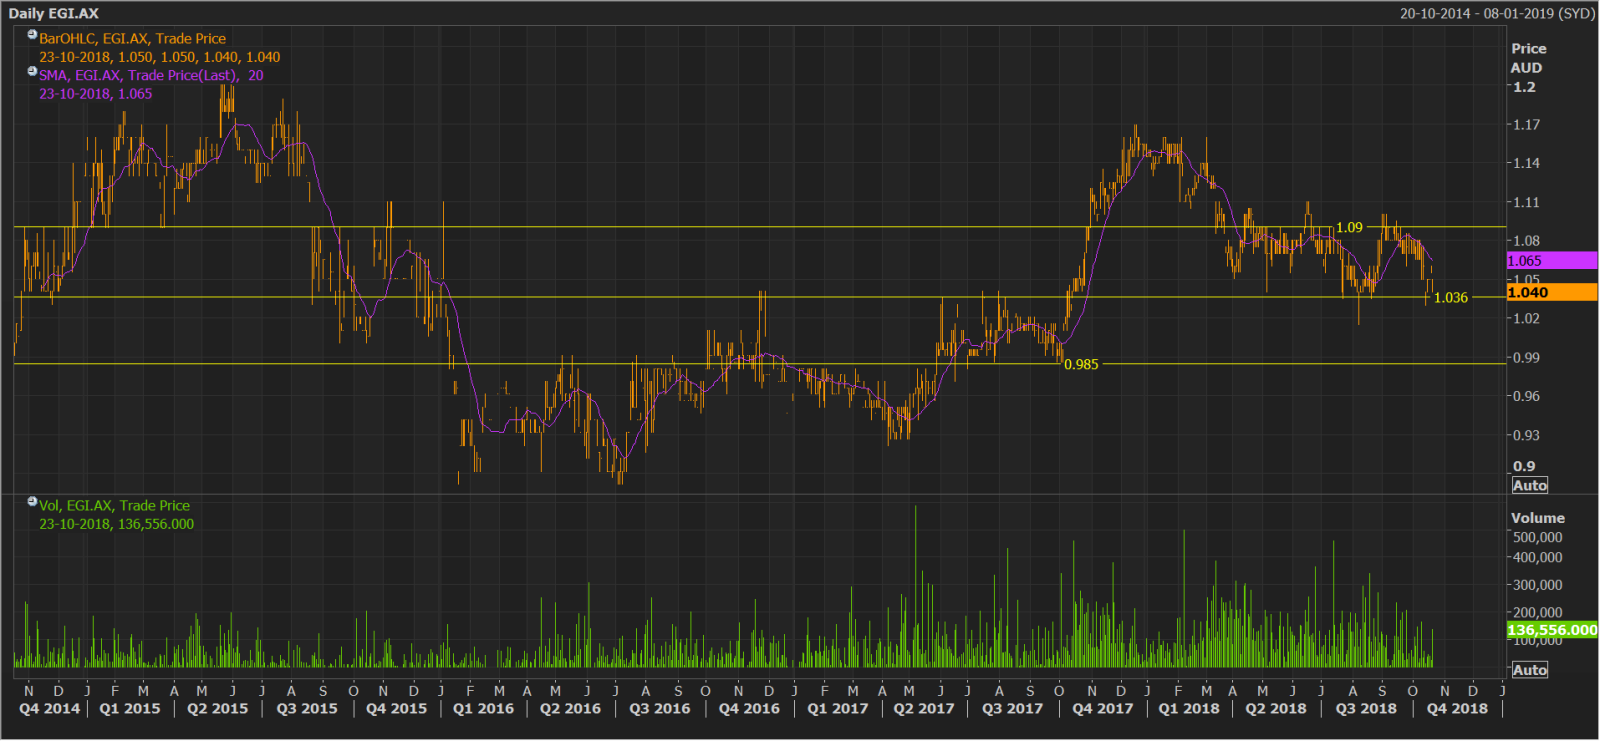
EGI Daily Chart (Source: Thomson Reuters)
Disclaimer
The advice given by Kalkine Pty Ltd and provided on this website is general information only and it does not take into account your investment objectives, financial situation or needs. You should therefore consider whether the advice is appropriate to your investment objectives, financial situation and needs before acting upon it. You should seek advice from a financial adviser, stockbroker or other professional (including taxation and legal advice) as necessary before acting on any advice. Not all investments are appropriate for all people. Kalkine.com.au and associated pages are published by Kalkine Pty Ltd ABN 34 154 808 312 (Australian Financial Services License Number 425376). The information on this website has been prepared from a wide variety of sources, which Kalkine Pty Ltd, to the best of its knowledge and belief, considers accurate. You should make your own enquiries about any investments and we strongly suggest you seek advice before acting upon any recommendation. Kalkine Pty Ltd has made every effort to ensure the reliability of information contained in its newsletters and websites. All information represents our views at the date of publication and may change without notice. To the extent permitted by law, Kalkine Pty Ltd excludes all liability for any loss or damage arising from the use of this website and any information published (including any indirect or consequential loss, any data loss or data corruption). If the law prohibits this exclusion, Kalkine Pty Ltd hereby limits its liability, to the extent permitted by law to the resupply of services. There may be a product disclosure statement or other offer document for the securities and financial products we write about in Kalkine Reports. You should obtain a copy of the product disclosure statement or offer document before making any decision about whether to acquire the security or product. The link to our Terms & Conditions has been provided please go through them and also have a read of the Financial Services Guide. On the date of publishing this report (mentioned on the website), employees and/or associates of Kalkine Pty Ltd do not hold positions in any of the stocks covered on the website. These stocks can change any time and readers of the reports should not consider these stocks as advice or recommendations.
 AU
AU

 Please wait processing your request...