.png)
Stocks Details
EBOS Group Limited
Revenues up ~25.2% Year Over Year: EBOS Group Limited (ASX: EBO) is involved in the marketing, and distribution of medical, healthcare & pharma goods in Australia, and offers renounced consumer products & animal care brands. On 12 June 2020, the company issued 6,429 fully paid ordinary shares for a consideration of NZ$22.25 per security, under its Employee Share Plan. In another update, the company informed the market about the lapse of 15,000 and 14,318 performance rights, issued on 30 October 2018 and 9 September 2019, respectively.
1HFY20 Results for the Period Ended 31 December 2019: During the period, the company’s total revenues and underlying net profit increased by 25.2% and 15.8%, respectively, year over year. Underlying EBITDA rose 13.4% year over year to $149 million. The increase in revenues represents the company’s portfolio strength with a substantial uplift in Pharmacy Wholesale and strong performances from TerryWhite Chemmart, Institutional Healthcare and Healthcare Logistics. The company witnessed a robust performance from its Community Pharmacy business, with revenues up 35.4% year over year. Underlying EPS for the period stood at 52.2 cents per share, up 9.1% year over year. During 1HFY20, the company’s operating cash flow stood at $74.2 million before capital expenditure and net debt at the end of the period amounted to $392.2 million.
.png)
Key Highlights (Source: Company Reports)
What Investors Need to Know: The company’s strong liquidity position along with a robust balance sheet is a key positive. The company took necessary actions to restraint the impact of COVID-19 crisis. The company produced solid revenue growth from its healthcare and animal care segments, supported by the rising demand. Apart from this, EBO is taking necessary measures to ensure health & safety of its employees & clients, during this crisis. However, the company is exposed to foreign currency risk and interest rate risk. Further, lower investment in generating working capital requirement exposes the company to liquidity risk.
Valuation Methodology: Price to Earnings Multiple Based Relative Valuation (Illustrative)
.png)
Price to Earning Based Valuation (Source: Refinitiv, Thomson Reuters)
Note: All forecasted figures and peers have been taken from Thomson Reuters, NTM-Next Twelve Months.
Stock Recommendation: The stock of the company corrected by 4.88% in the past one month. At the CMP of $20.55, the stock of the company is trading at a P/E multiple 21.03x with a dividend yield of 3.11%. Currently, the stock is trading below the average of its 52-week high and low of $24.5 and $18.8, respectively. Considering the robust revenues from its Healthcare and Animal Care segments, strong cash position, and current trading levels, we have valued the stock using Price-to-Earnings multiple based illustrative relative valuation method, and arrived at a target price of low double-digit growth (in percentage terms). Hence, we recommend a “Buy” rating on the stock at the current market price of $20.55, up 1.481% on 15 June 2020.
Mesoblast Limited
Phase 2 Trial Results: Mesoblast Limited (ASX: MSB) is a biotechnology company in the area of adult stem cell technology. As on 15 June 2020, the market capitalization of the company stood at $2.09 billion. MSB recently stated that patients with chronic obstructive pulmonary disease (COPD) and a higher state of inflammation have been dosed with Mesoblast’s mesenchymal stem cell (MSC) product remestemcel-L and resulted in better respiratory and functional outcomes.
Key Operational Highlights for the Nine Months Ended March 31, 2020: During the period, the company reported revenues US$31.5 million, soaring 113% on the pcp. The company witnessed 81% growth in royalty revenues and a 127% increase in milestone revenues. In the same time span, the company reported cash in hand of US$60.1 million. MSB continued to prepare for the potential approval and commercial launch of RYONCIL in the US. The company remains on track for a Phase 3 randomized controlled trial in the United States to provide data from the utilisation of remestemcel-L in COVID-19 infected patients.
.png)
Key Highlights (Source: Company Reports)
What Investors Need to Know: The company’s businesses including wholesale, distribution and retail healthcare activities are performing a vital role in ensuring stable and continuous supply of healthcare, medical and pharma goods, as they are classified as essential services.This apart, EBO is taking necessary measures to ensure health & safety of its employees & clients, during this crisis. However, stiff competition in the market and changes in government policies remains a headwind.
Stock Recommendation: As per ASX, the stock of MSB gave a return of 91.49% in the last six months and a return of 6.19% in the past one month. The stock is currently trading above the average of its 52-week trading range of $1.020 and $4.45. During Dec’20, debt to equity multiple of the company stood at 0.19x. On the valuation front, the stock is trading at a P/BV multiple of 2.6x as compared to the industry mean of 3.8x on TTM (Trailing Twelve Months) basis. Considering the above factors and current trading levels, we recommend a ‘Hold’ rating on the stock at the current market price of $3.61, up by 0.278% on 15 June 2020.
Australian Pharmaceutical Industries Limited
Strong Results & Healthy Balance sheet: Australian Pharmaceutical Industries Limited (ASX: API) is involved in the wholesale distribution of pharmaceutical products to pharmacies. In a recent update, the company announced that Mark Smith, a Director of the company, acquired 40,000 ordinary shares for a consideration of $41,550.
1HFY20 Key Highlight: During 1HFY20 for the period ended 29 February 2020, the company reported total revenues of $2,033 million, an increase of 2.8% year over year. The company’s financial position has improved owing to a reduction in net debt, via proceed from the Sigma shareholding sale, and improved working capital and cash conversion days. The company is undergoing a restructuring program, with further cost control initiatives expected in 2HFY20. The company’s balance sheet depicts a strong financial position, with a reduction of 50% of net debt on a year over year basis and cash conversion days down by 7.3 days as compared to prior corresponding period. During the period, API’s Pharmacy Distribution revenue was up 7.1% on the pcp.
.png)
Key Highlight (Source: Company Reports)
Growth Opportunity: The company remains on track to build a portfolio of complementary businesses, to develop a stronger pipeline via machine-driven in-store health checks, medicine managing apps, dose processing to aid and offer robust health products. The group is aiming to continue to enhance its Priceline Pharmacy network.
Risk Analysis: The company faces risks of changes in government policies, structural reform, regulations, and initiatives. The company also remains exposed to stiff competition in the Australian pharmacy, retail, and health market. Further, cybersecurity threat, failure to achieve success in its Priceline pharmacy franchise along with financial risks are potential headwinds to the company.
Valuation Methodology: P/BV Multiple Based Relative Valuation (Illustrative)
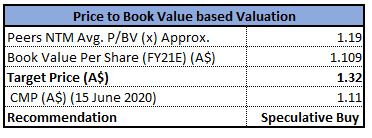
P/BV Multiple Based Relative Valuation (Source: Refinitiv, Thomson Reuters)
Note: All the forecasted figures are taken from Thomson Reuters, NTM: Next Twelve Months
Stock Recommendation: The stock of the company gave negative returns of 9.73% over a period of six months and is currently trading below the average of its 52-week low and high level of $0.995 and $1.520, respectively. The management of the company is focused on developing a pipeline of Priceline Pharmacies and Clear Skincare clinics which is experiencing huge demand as customers become more aware of result-driven skin treatments. We have valued the stock using a P/BV multiple based illustrative relative valuation method and have arrived at a target price with lower double-digit upside (in percentage terms).For this purpose, we have taken peers such as Sigma Healthcare Ltd (ASX: SIG), Sonic Healthcare Ltd (ASX: SHL) and Mayne Pharma Group Ltd (ASX: MYX), to name few. Hence, we give a “Speculative Buy” recommendation on the stock at the current market price of $1.11, down 4.31% on 15 June 2020.
Healius Limited
HLS Enters Into a Sales Agreement With BGH: Healius Limited (ASX: HLS) is involved in offering diagnostic and pathology services to consumers and their consulting practitioners, along with enabling a broad range of individual healthcare professionals to provide patient care in association with Healius’ nurses and support staff. In a recent update, the company inked a sale agreement with BGH Capital for an enterprise value of $500 million. As per the deal, HLS will sell 100% of its Primary Care (69 large-scale medical centres, 13 Health & Co practices & 62 Dental clinics) to BGH, subject to customary closing conditions. The proceed will strengthen the company’s balance sheet position and will support growth initiatives.
HLS Partners Minderoo: On 29 April 2020, HLS entered a partnership deal with the Minderoo Foundation to swiftly increase COVID-19 testing via Minderoo’s national Safety Through Accelerated Testing (STAT) program. The company plans to increase its own capacity for COVID-19 testing as part of a 3-fold rise in total daily testing capability across the country.
1HFY20 Key Highlights for the Period Ended 31 December 2019: During the period, the company reported revenues of $945.1 million, up 7.5% year over year. In all its main businesses, the company witnessed decent revenue growth. The company reported an underlying EBITDA of $113 million, up from $108.4 million reported in the year-ago period. EBIT for the period stood at $75.7 million, up 4% from $72.7 million reported in the year-ago period. Underlying NPAT for the period stood at $42.1 million, as compared to $39.1 million reported in the year-ago period. At the end of the period, the company reported a cash balance of $121.3 million. The company’s net debt at the end of the period came in at $746.6 million, up from $678.2 million as at 30 June 2019
.png)
1HFY20 Key Financial Highlights (Source: Company Reports)
What Investors Need to Know:The company’s robust performance reflects its efficiencies derived out of organisational redesign and cost savings initiatives. Due to the Covid-19 pandemic, the company is taking necessary measures to reduce cost and maintaining liquidity. Recently, the company witnessed a strong increase in demand in COVID-19 tests per day at its laboratories. However, due to the significant deferral of non-COVID-19 testing and elective services, the company has witnessed varying rates of volume decline in its businesses. HLS is closely working with Federal and State Governments to ensure that its essential healthcare services are readily available in the community. The company has also decided to defer its FY20 interim dividend.
Valuation Methodology- Price to Earnings Multiple Based Relative Valuation (Illustrative)
.png)
Price to Earnings Multiple Based Relative Valuation (Source: Refinitiv, Thomson Reuters)
Note: All forecasted figures and peers have been taken from Thomson Reuters, NTM-Next Twelve Months
Stock Recommendation: In the last six months, the stock of HLS has declined by 12.76% on ASX and is trading above the average of its 52-week low and high of $1.925 and $3.315, respectively. HLS possessed a strong balance sheet with decent leverage within covenants. The company is focused on managing debt levels for balancing an optimal gearing ratio with capital needs and dividends. Considering the above factors, we have valued the stock using Price to Earnings multiple based illustrative relative valuation method and have arrived at a target price offering an upside of lower double-digit (in % terms). For this purpose, we have taken peers such as Ansell Ltd (ASX: ANN), Sonic Healthcare Ltd (ASX: SHL) and Mayne Pharma Group Ltd (ASX: MYX). Hence, we recommend a “Hold” rating on the stock at the current market price of $3.01, up 18.972% on 15 June 2020, on the back of recent sale agreement with BGH.

Comparative Price Chart (Source: Refinitiv, Thomson Reuters)
Disclaimer
The advice given by Kalkine Pty Ltd and provided on this website is general information only and it does not take into account your investment objectives, financial situation or needs. You should therefore consider whether the advice is appropriate to your investment objectives, financial situation and needs before acting upon it. You should seek advice from a financial adviser, stockbroker or other professional (including taxation and legal advice) as necessary before acting on any advice. Not all investments are appropriate for all people. Kalkine.com.au and associated pages are published by Kalkine Pty Ltd ABN 34 154 808 312 (Australian Financial Services License Number 425376). The information on this website has been prepared from a wide variety of sources, which Kalkine Pty Ltd, to the best of its knowledge and belief, considers accurate. You should make your own enquiries about any investments and we strongly suggest you seek advice before acting upon any recommendation. Kalkine Pty Ltd has made every effort to ensure the reliability of information contained in its newsletters and websites. All information represents our views at the date of publication and may change without notice. To the extent permitted by law, Kalkine Pty Ltd excludes all liability for any loss or damage arising from the use of this website and any information published (including any indirect or consequential loss, any data loss or data corruption). If the law prohibits this exclusion, Kalkine Pty Ltd hereby limits its liability, to the extent permitted by law to the resupply of services. There may be a product disclosure statement or other offer document for the securities and financial products we write about in Kalkine Reports. You should obtain a copy of the product disclosure statement or offer document before making any decision about whether to acquire the security or product. The link to our Terms & Conditions has been provided please go through them and also have a read of the Financial Services Guide. On the date of publishing this report (mentioned on the website), employees and/or associates of Kalkine Pty Ltd do not hold positions in any of the stocks covered on the website. These stocks can change any time and readers of the reports should not consider these stocks as personalised advice.
 AU
AU

 Please wait processing your request...