.png)
Stocks’ Details
Volpara Health Technologies Limited
Subscription Revenue up 148% Year Over Year: Volpara Health Technologies Limited (ASX: VHT) is a SaaS company which provides health solutions for breast cancer. On 3rd March 2020, the company issued 340,000 new fully paid ordinary shares under its Employee Share Option Plan (ESOP).
1HFY20 Performance for the Period Ended 30 September 2019: During the period, revenue stood at ~NZ$6.8 million, up 197% year over year. Subscription revenue for the period rose 148% year over year. Operating loss stood at NZ$8.4 million, up 56%, owing to team expansion and scaled up operations. In 1HFY20, net loss stood at ~NZ$8 million, as compared to a loss of ~NZ$5.2 million reported in 1HFY19. Loss after tax increased 55% year over year, which included one-off acquisition costs of ~NZ$620k and other material non-cash expenses. Operating expenses for the period increased to NZ$15.4 million from NZ$5.4 million in 1HFY17, due to higher investment in sales, marketing and customer success teams’ capability.
.png)
.png)
Revenues & Subscription(Source: Company Reports)
Q3FY20 Sneak Peak: The company’s ARR at the end of the quarter came in at NZ$16.8Mn, including NZ$15.92Mn from breast cancer software sales and NZ$840K from lung cancer software sales. Cash receipts from customers for the quarter came in at NZ$4.5 million, up 138% year over year. Cash on hand at the end of the period stood at NZ$35.4Mn. Operating cash outflow came in at NZ$4.5 Mn as compared to a cash outflow NZ$4.2Mn in the prior quarter. The company is expecting NZ$9.2 million in cash outflow in the coming quarter.
Outlook: For FY20, the company expects ARR to be ~NZ$17.8 million (up from the previous guidance of NZ$17.1 million). Volpara expects that 27% of US women will apply the group’s product on their data and images.
Valuation Methodology:EV/Sales Multiple Based Relative Valuation
.png)
EV/Sales Multiple Based Valuation (Source: Thomson Reuters)
Note: All the forecasted figures are taken from Thomson Reuters, NTM: Next Twelve Months
Stock Recommendation:The stock of the company is currently trading close to its 52-week low level of A$1.000. The stock has a market cap of ~A$249.07 million. The company remains on track to invest in new technology as well as improvements in quality and personalised care systems. Considering the above factors, we have valued the stock using EV/Sales based relative valuation method, and for that purpose, we have considered peers such as Pro Medicus Ltd (ASX: PME), Nanosonics Ltd (ASX: NAN), Telix Pharmaceuticals Ltd (ASX: TLX), to name few. As a result, we have arrived at a target price of lower double-digit growth (in percentage terms). Hence, we recommend a “Buy” rating on the stock at the current market price of A$1.145, up 0.439% on 12 March 2020.
Estia Health Limited
Attained 93.7% Growth in Average Occupancy: Estia Health Limited (ASX: EHE) provides services in residential aged care homes in Australia. Recently, the company stated that Warwick Smith, one of the directors in the company, has acquired 27,000 fully paid ordinary shares for a consideration of $1.5451 per share. In another update, EHE stated that Norah Barlow has disposed 261,495 performance rights.
H1FY20 Financial Highlights for the Period ended 31 December 2019: The company has recently reported its half yearly results, wherein it reached 93.7% growth in average occupancy in mature homes. EBITDA on mature homes came in at $40.9 million, and NPAT of the company was $14.3 million. EHE is accelerating its substantial refurbishment program with a total of 42 homes and is qualifying for the higher accommodation supplement with additional eight homes to be completed in 2H20. During the period, the company’s net RAD inflows stood at $22.2 million. At the end of the period, net debt amounted to $96.6 million.
.png)
1HFY20 Key Highlights (Source: Company Reports)
Outlook: For FY20, the company expects EBITDA to be in the range of $78 million to $82 million. It also predicts capital investment to be in the ambit of $58 million to $64 million in 2HFY20 and is pursuing bank debt gearing in between 1.5x-1.9x EBITDA.
Valuation Methodology: Price to Earnings Based Valuation
.png)
Price to Earnings Multiple Based Valuation (Source: Thomson Reuters)
Note: All the forecasted figures are taken from Thomson Reuters, NTM: Next Twelve Months
Stock Recommendation: As per ASX, the stock of EHE is trading very close to its 52-weeks low level of $1.415, proffering a decent opportunity for accumulation. The company has a P/E multiple of 11.78x, with an annual dividend yield of 8.46%. Considering the trading levels, and decent outlook, we have valued the stock using price to earnings multiple based relative valuation method and arrived at a target price of lower double-digit upside (in percentage terms). For the purpose, we have taken peers like Resmed Inc (ASX: RMD), Regis Healthcare Ltd (ASX: REG), Japara Healthcare Ltd (ASX: JHC), to name a few. Hence, we recommend a “Buy” rating on the stock at the current market price of $1.47, down by 5.769% on 12 March 2020.
Compumedics Limited
Increase in Sales Order a Key Positive: Compumedics Limited (ASX: CMP) is involved in the production, manufacturing, development and marketing of medical devices utilized for analysis of brain and sleep disorders, and to analyse ultrasonic blood-flow treatments.
H1FY20 Financial Highlights for the Period ended 31 December 2019: During the period, revenue came in at $18.3 million, down 2% year over year. EBITDA for 1HFY20 stood at $1.2 million, as compared to $1.5 million in pcp, owing to sale shortage in the US. In 1HFY20, net profit after tax (NPAT) stood at $0.2 million, down from $0.8 million reported in 1FY19. Sales orders on hand at the end of the period came in at $8.2 million, up from $7.7 million as at 30 June 2019. Asia-based sales soared 7% year over year.
.png)
1HFY20 Key Highlights (Source: Company Reports)
Balance Sheet & Cash Flow Position: At the end of the period, the company reported cash and cash equivalents of $3.3 million. Debt at the end of the period stood at $1.8 million, as compared to $1.6 million as at 30 June 2019.Operating cash inflow came in at $2 million, flat year over year.
Outlook: For FY20 sales are expected to be roughly in the range of $40 to $42 million, down from the previous guidance of $42-44 million. EBITDA is expected between $5.5 million and $6.5 million, down from the previous guidance of $6.5 million and $7.5 million.
Valuation Methodology: Price to Earnings Multiple Based Relative Valuation
.png)
Price to Earnings Based Valuation (Source: Thomson Reuters)
Note: All forecasted figures and peers have been taken from Thomson Reuters, NTM-Next Twelve Months
Stock Recommendation: The stock of the company generated positive returns of ~76.47% over a period of one year. As per ASX, the stock of CMP is trading below the average of its 52-weeks low and high level of $0.320 and $0.960, respectively. The company has a P/E multiple of 31.58x, with a market cap of $103.6 million. Considering the above factors, we have valued the stock using a relative valuation method, i.e., Price to Earnings multiple, and for the purpose, we have taken the peer group Somnomed Ltd (ASX: SOM), Probiotec Ltd (ASX: PBP) and Universal Biosensors Inc (ASX: UBI). As a result, we have arrived at a target price depicting an upside of double-digit (in % terms). Hence, we recommend a “Speculative Buy” rating on the stock at the current market price of $0.500, down 16.667% on 12 March 2020, on the back of coronavirus impact which compelled the company to lower its FY20 outlook.
Australian Pharmaceutical Industries Limited
Sneak Peek at API’s FY19 Results: Australian Pharmaceutical Industries Limited (ASX: API) is a leading seller, distributor & manufacturer in Pharmacy and Grocery channels, which provides allied products and services to retailers and manufacturers. During FY19, the company reported revenues of ~$4 billion, which increased 4.1% year over year. The company reported NPAT of $56.6 million in FY19, up 17.4% year over year. During the period, the company’s growth assets continued to perform well with 0.7% growth in its Priceline like-for-like sales. EPS for the period stood at 11.2 cents per share, up 14.3% year over year. The company paid a final dividend of 4 cents per share in FY19.
.png)
FY19 Financial Highlights (Source: Company Reports)
Outlook: For FY20, the company is likely to provide growth by leveraging its organisational, planned and physical assets across Australia and New Zealand.
Valuation Methodology: Price to Cash Flow Multiple Based Relative Valuation
.png)
Price to Cash Flow Based Valuation (Source: Thomson Reuters)
Note: All forecasted figures and peers have been taken from Thomson Reuters, NTM-Next Twelve Months
Stock Recommendation: The stock of API is trading at $1.11 with a market capitalisation of ~$576,41 million. The stock is trading at the lower band of its 52-week trading range of $1.060 to $1.57. The stock has generated negative returns of ~11.2% in the last six-months. The stock is available at a PE multiple of 10.45x, with an annual dividend yield of 6.62%. Considering the current trading levels and business prospects, we have valued the stock using Price to Cash Flow based relative valuation method. For the purpose, we have taken peers like Resmed Inc (ASX: RMD), Mayne Pharma Group Ltd (ASX: MYX) and Sonic Healthcare Ltd (ASX: SHL) and arrived at a target price of double-digit upside (in % terms). Hence, we recommend a “Speculative Buy” rating on the stock at the current market price of $1.11 per share, down 5.128% on 3 March 2020.
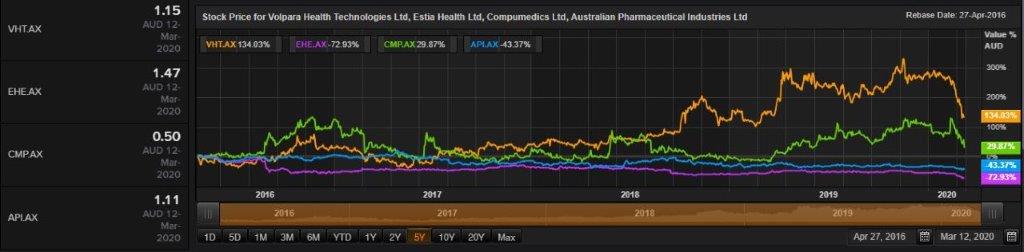
Comparative Price Chart (Source: Thomson Reuters)
Disclaimer
The advice given by Kalkine Pty Ltd and provided on this website is general information only and it does not take into account your investment objectives, financial situation or needs. You should therefore consider whether the advice is appropriate to your investment objectives, financial situation and needs before acting upon it. You should seek advice from a financial adviser, stockbroker or other professional (including taxation and legal advice) as necessary before acting on any advice. Not all investments are appropriate for all people. Kalkine.com.au and associated pages are published by Kalkine Pty Ltd ABN 34 154 808 312 (Australian Financial Services License Number 425376). The information on this website has been prepared from a wide variety of sources, which Kalkine Pty Ltd, to the best of its knowledge and belief, considers accurate. You should make your own enquiries about any investments and we strongly suggest you seek advice before acting upon any recommendation. Kalkine Pty Ltd has made every effort to ensure the reliability of information contained in its newsletters and websites. All information represents our views at the date of publication and may change without notice. To the extent permitted by law, Kalkine Pty Ltd excludes all liability for any loss or damage arising from the use of this website and any information published (including any indirect or consequential loss, any data loss or data corruption). If the law prohibits this exclusion, Kalkine Pty Ltd hereby limits its liability, to the extent permitted by law to the resupply of services. There may be a product disclosure statement or other offer document for the securities and financial products we write about in Kalkine Reports. You should obtain a copy of the product disclosure statement or offer document before making any decision about whether to acquire the security or product. The link to our Terms & Conditions has been provided please go through them and also have a read of the Financial Services Guide. On the date of publishing this report (mentioned on the website), employees and/or associates of Kalkine Pty Ltd do not hold positions in any of the stocks covered on the website. These stocks can change any time and readers of the reports should not consider these stocks as personalised advice.
 AU
AU

 Please wait processing your request...