.png)
Stocks’ Details
Suncorp Group Limited
Suncorp Group Bushfire & Natural Hazard Update: Suncorp Group Limited (ASX: SUN) is one of the leading financial services providers and is primarily engaged in the provision of banking, insurance and wealth products and services. On 9th January 2020, the company stated that it has received over 2,600 claims related to bushfires, along with total estimated bushfire costs of $315 million to $345 million since September 2019. The company has undertaken initiatives to develop a comprehensive reinsurance program with improved natural hazard protection for FY20.
FY19 Financial Highlights for the Period Ended 30 June 2019: The company reported cash earnings of $1.115 billion and net profit after tax of $175 million in FY19. The company declared a fully franked final dividend of 44 cents per share in FY19, with a pay-out ratio of 81.2%.
.png)
FY19 Financial Highlights (Source: Company Reports)
FY20 Outlook:For FY20, the company has increased its allowance for natural hazards from $720 million to $820 million. The company has also purchased an additional $200 million reinsurance cover.
Valuation Methodology: P/E Multiple Approach
.png)
P/EBased Valuation (Source: Thomson Reuters)
Note: All forecasted figures and peers have been taken from Thomson Reuters, NTM-Next Twelve Months
Stock Recommendation: As per ASX, the stock is trading below the average of its 52-week high-low of $14.155 and $12.621.The stock gave a return of 4.17% in the past one year. As per ASX, the stock has a market cap of ~$16.66 billion with a PE multiple of 97.56x and an annual dividend yield of 5.3%. We have valued the stock using P/E based relative valuation method, and for the said purpose, we have considered peers like Insurance Australia Group Ltd (ASX: IAG), QBE Insurance Group Ltd (ASX: QBE) and Medibank Private Ltd (ASX: MPL), to name few. Therefore, we have arrived at a target price with an upside of lower double-digit (in % terms). Considering the above factors, we give a “Hold” recommendation on the stock at the current market price of $12.990 per share, down 1.665% on 24th January 2020.
Insurance Australia Group Limited
Lowered Insurance Margin Outlook for FY20: Insurance Australia Group Limited (ASX: IAG) is involved in delivering general insurance services, which includes a broad range of personal and commercial insurance products. The company also notified that H1 FY20 results will be announced on 12th February 2020.
Key Updates for 1HFY20 Results: On 24th January 2020, the company provided an update on its FY20 reported margin guidance along with a modified full year view on net natural peril claim costs. The company reported that insurance margin is now expected to be between 14.5-16.5% as compared to the previous outlook of 16-18%. Pertaining to 1HFY20, the company expects the results to contain gross written premium (GWP) growth of ~1.4% , an underlying insurance margin of 16.9%, a reported insurance margin of 13.5%, a loss from fee-based business of $2 million along with a post-tax provision of ~$80 million for customer refunds.
Other Recent Updates: On 21st January 2020, the company stated that Ben Bessell, Group Executive of the company has intended to step down from the post, effective from March end 2020. In another update, the company has increased its group reinsurance cover to up to $10 billion, up from $9 billion in the previous calendar year.
.png)
IAG Catastrophe Reinsurance Protection (Source: Company Reports)
Valuation Methodology: P/CF Multiple Approach
.png)
P/CF Based Valuation (Source: Thomson Reuters)
Note: All forecasted figures and peers have been taken from Thomson Reuters, NTM-Next Twelve Months
Stock Recommendation: As per ASX, the stock is trading below the average of its 52-week low and high of $7.040 and $8.740, respectively. The stock gave a return of 8.73% in the past one year. As per ASX, the stock has a market cap of ~$17.84 billion with a PE multiple of 16.69x and an annual dividend yield of 4.15%. We have valued the stock using P/CF based relative valuation method, and for the said purpose, we have considered peers like NIB Holdings Ltd (ASX: NHF), QBE Insurance Group Ltd (ASX: QBE) and Suncorp Group Ltd (ASX: SUN), to name few. Therefore, we have arrived at a target price with an upside of single-digit (in percentage terms). Considering the revised guidance, valuation, and current trading levels, we have a watch view on the stock at the current market price of $7.300 per share, down 5.44% on 24 January 2020, after the company updated its FY20 outlook and 1HFY20 results.
QBE Insurance Group Limited
CPAT went Up by 35% Year Over Year:QBE Insurance Group Limited (ASX: QBE) is an Australia-based company, which is engaged in underwriting reinsurance risks & general insurance along with management of Lloyd’s syndicates and investment supervision. On 13 January 2020, the company notified the market regarding the cancellation of 3,023,060 shares on account of on-market share buy-back.
Adverse Weather Conditions Likely to Affect Company’s Earnings: On December 18, 2019, the company notified that its North American Crop insurance business is predicted to report a 2019 current accident year operating ratio of around 107% - 109% on net earned premium of nearly $1.2 billion. The results were impacted by prevented planting claims coupled with the yield shortages.
Key Highlights of 1HFY19:During the period, the company reported cash profit after tax of $520 million, as compared to $385 million reported in 1HFY18. The company’s debt to equity ratio reduced from 38% in FY18 to 36.8% in the current period.
.png)
Operating Results (Source: company Reports)
Valuation Methodology: P/E Multiple Approach
.png)
P/EBased Valuation (Source: Thomson Reuters)
Note: All forecasted figures and peers have been taken from Thomson Reuters, NTM-Next Twelve Months
Stock Recommendation: As per ASX, the stock is trading close to its 52-week high price of $13.990. The stock gave a return of 25.78% in the past one year. As per ASX, the stock has a market cap of ~$17.9 billion with a PE multiple of 24.94x and an annual dividend yield of 3.87%. We have valued the stock using P/E based relative valuation method, and for the said purpose, we have considered peers like NIB Holdings Ltd (ASX: NHF), Insurance Australia Group Ltd (ASX: IAG) and Suncorp Group Ltd (ASX: SUN), to name few. Therefore, we have arrived at a target price with an upside of single digit (in percentage terms). Considering the anticipated impact of adverse weather conditions and current trading levels, we have a watch view on the stock at the current market price of $13.77 per share, up 0.438% on 24 January 2020.
Netwealth Group Limited
FUA for December Quarter Up 12.6% Year Over Year: Netwealth Group Limited (ASX: NWL) provides financial investors and intermediaries with managed funds services, investor directed portfolio services, superannuation master fund service, etc.
Business Update for December Quarter 2019: The company stated that its funds under administration (FUA) came in at $28.5 billion as at 31 December 2019, up 12.6% year over year. The company reported FUA net inflows of $2.9 billion, which soared 228.3% from the year-ago quarter. Funds under management at the end of the quarter came in at $5.7 billion, up 29.4% on pcp. Managed accounts at the end of the quarter came in at $4.4 billion, up by 40.6%.
.png)
Key Metrics for December Quarter 2019 (Source: Company Reports)
Outlook:The company now anticipates FUA to exceed $32 billion as on 30 June 2020, up from the previous guidance of $30 billion. The company has a robust pipeline and is eyeing new business prospects.
Valuation Methodology: EV/Sales Multiple Approach
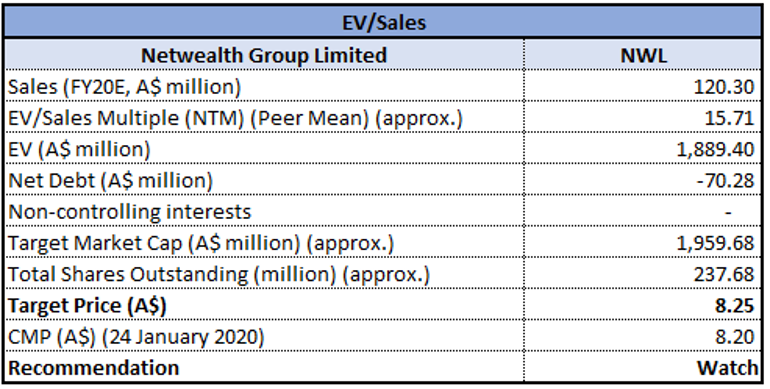
EV/SalesBased Valuation (Source: Thomson Reuters)
Note: All forecasted figures and peers have been taken from Thomson Reuters, NTM-Next Twelve Months
Stock Recommendation: As per ASX, the stock is trading close to the average of its 52-week high and low level of $10.110 and $6.350, respectively. As on 24th January 2020, the company’s market capitalisation stands at ~$1.85 billion, with 237.69 million outstanding shares. Its EBITDA margin and net margin for FY19 stood at 51.4% and 36.5%, lower than the industry median of 58.9% and 20.2%, respectively. Its current ratio for FY19 stood at 4.36x, better than the industry median of 1.47x, which implies the company’s good liquidity position. Considering the backdrop of the above factors, we have valued the stock using EV/Sales based relative valuation method and for the purpose, have taken the peer group - Credit Corp Group Ltd (ASX: CCP), Magellan Financial Group Ltd (ASX: MFG), Credit Corp Group Ltd (ASX: CCP) and Pinnacle Investment Management Group Ltd (ASX: PNI). Therefore, we have arrived at the target price with an upside of single-digit in % terms. Hence, we have a watch view on the stock at the current market price of $8.2, up 5.128% on 24th January 2020, primarily on the back of December quarter update.
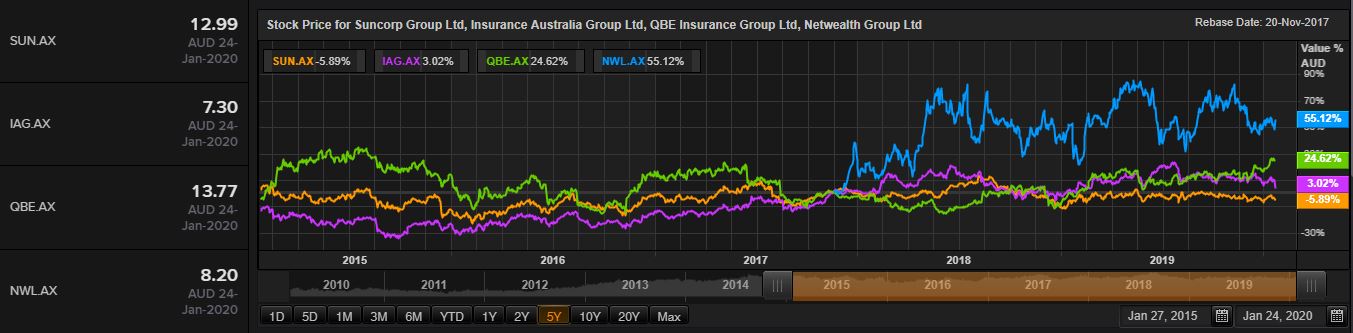
Comparative Price Chart (Source: Thomson Reuters)
Disclaimer
The advice given by Kalkine Pty Ltd and provided on this website is general information only and it does not take into account your investment objectives, financial situation or needs. You should therefore consider whether the advice is appropriate to your investment objectives, financial situation and needs before acting upon it. You should seek advice from a financial adviser, stockbroker or other professional (including taxation and legal advice) as necessary before acting on any advice. Not all investments are appropriate for all people. Kalkine.com.au and associated pages are published by Kalkine Pty Ltd ABN 34 154 808 312 (Australian Financial Services License Number 425376). The information on this website has been prepared from a wide variety of sources, which Kalkine Pty Ltd, to the best of its knowledge and belief, considers accurate. You should make your own enquiries about any investments and we strongly suggest you seek advice before acting upon any recommendation. Kalkine Pty Ltd has made every effort to ensure the reliability of information contained in its newsletters and websites. All information represents our views at the date of publication and may change without notice. To the extent permitted by law, Kalkine Pty Ltd excludes all liability for any loss or damage arising from the use of this website and any information published (including any indirect or consequential loss, any data loss or data corruption). If the law prohibits this exclusion, Kalkine Pty Ltd hereby limits its liability, to the extent permitted by law to the resupply of services. There may be a product disclosure statement or other offer document for the securities and financial products we write about in Kalkine Reports. You should obtain a copy of the product disclosure statement or offer document before making any decision about whether to acquire the security or product. The link to our Terms & Conditions has been provided please go through them and also have a read of the Financial Services Guide. On the date of publishing this report (mentioned on the website), employees and/or associates of Kalkine Pty Ltd do not hold positions in any of the stocks covered on the website. These stocks can change any time and readers of the reports should not consider these stocks as advice or recommendations.
 AU
AU

 Please wait processing your request...