IOOF Holdings Limited

.png)
IFL Details
Acquisition of the ANZ businesses has strengthened IFL’s position: IOOF Holdings Limited (ASX: IFL) in FY 17 had delivered the exceptional organic growth due to 156% growth in the net inflows to $4.6 billion and an underlying profit of $169.4 million. Moreover, IFL had raised $539m through the Placement and SPP, to partially fund the acquisition of ANZ’s OnePath Pensions and Investments business and Aligned Dealer Groups business. The acquisition of the ANZ businesses has strengthened IFL’s position to be Australia’s leading specialist advice led wealth manager. Meanwhile, IFL stock, which rose 2.3% on November 28, 2017, is trading at a slightly high level. Based on the foregoing, we give a “Hold” recommendation on the stock at the current price of $11.17
.png)

IFL Daily Chart (Source: Thomson Reuters)
Magellan Financial Group Ltd
.png)

MFG Details
Significant increase of FUM in October:Magellan Financial Group Ltd (ASX: MFG) in October had net inflows of $1,825 million. This reflected the net retail inflows into Global Equities strategies of $1,568 million, net retail inflows into Infrastructure Equities of $39 million, and net institutional inflows of $218 million. The funds under management (FUM) are of $56.03 billion as at October 31, 2017. This is a significant increase compared to FUM of $42.2 billion as at October 31, 2016 and $51.5 billion as at the end of September 2017. The company is thus expected to post a healthy underlying profit growth for the six-month period ending December 31, 2017.
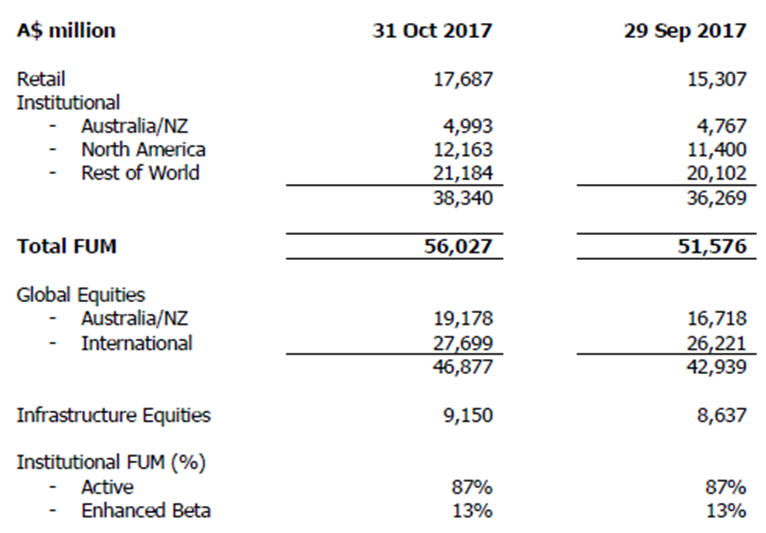

FUM as at October 31, 2017 (Source: Company Reports)
Meanwhile, MFG stock has risen 4.38% in last three months as on November 27, 2017. The group’s dividend policy for the underlying funds management business component is the payout between 75%-80% of the after-tax profit, excluding performance fees. Given the on-going momentum, we put a “Buy” recommendation on the stock at the current price of $25.65
.png)

MFG Daily Chart (Source: Thomson Reuters)
BT Investment Management Ltd
.png)

BTT Details
JOHCM under investigation:BT Investment Management Ltd (ASX: BTT) in FY17 posted 11% growth in the Cash NPAT to $173.1 million, at the back of higher average FUM, driven by strong net inflows and higher markets on average over the course of the year. The average FUM increased by 13% to $90.4 billion due to the strong global markets, with the average level of the MSCI All Countries World Index in local currency terms surging up 13%, and the average level of the S&P/ASX 300 Index surging by 9%. The Performance fees for FY17 were 51% lower to $37.9 million. The total cash operating expenses fell 5% to $281.9 million primarily due to a decrease in employee expenses linked to lower performance fee revenue. The closing FUM was $95.8 billion as at September 30, 2017, which is up $11.8 billion from $84.0 billion of last year. On the other hand, BTT is in preparation of new regulations scheduled to take effect in the coming year. This includes the reforms to the European Union’s Market in Financial Instruments Directive (known as MiFID II) that will come into effect in January 2018. In preparedness for the new MiFID II regulations, JOHCM will absorb the cost of all external research. Further, in the UK, after the industry thematic review, JOHCM is the subject of an investigation from its regulator relating to the eligibility of certain services approximating $8.6 million paid for out of dealing commissions between 2006 and 2016. There is a possibility that as part of the investigation the eligibility of other services may also get assessed. The likely outcome or consequence of this matter (including any sanctions or penalties) cannot be estimated at this time.

.png)
FY 17 Financial Performance (Source: Company Reports)
Meanwhile, BTT stock is trading at a high level. As of now and given some level of uncertainty, we put an “Expensive” recommendation on the stock at the current price of $10.89
.png)

BTT Daily Chart (Source: Thomson Reuters)
Platinum Asset Management Limited
.png)

PTM Details
Average FUM declined by 9.6% in FY17:Platinum Asset (Investment) Management Limited’s (ASX: PTM) FUM at the end of October increased 17% to $26.5 billion, from 30 June 2017, due to the better investment returns and positive inflows in the first four months of FY18. However, PTM does not provide earnings forecasts because of the uncertainty of net fund flows and equity market performance. In FY17, PTM has posted 7.5% fall in the fee revenue to $312.5 million majorly due to an average FUM declining by 9.6%. The profit after tax also fell 3.6% to $192.6 million. On the other hand, PTM had launched two new ASX quoted managed funds in September 2017 and had launched one new website. Meanwhile, PTM stock has risen 72% in last six months as on November 27, 2017 and is trading at a high level given the ongoing challenges. We give an “Expensive” recommendation on the stock at the current price of $7.52
.png)

PTM Daily Chart (Source: Thomson Reuters)
Disclaimer
The advice given by Kalkine Pty Ltd and provided on this website is general information only and it does not take into account your investment objectives, financial situation or needs. You should therefore consider whether the advice is appropriate to your investment objectives, financial situation and needs before acting upon it. You should seek advice from a financial adviser, stockbroker or other professional (including taxation and legal advice) as necessary before acting on any advice. Not all investments are appropriate for all people. Kalkine.com.au and associated pages are published by Kalkine Pty Ltd ABN 34 154 808 312 (Australian Financial Services License Number 425376). The information on this website has been prepared from a wide variety of sources, which Kalkine Pty Ltd, to the best of its knowledge and belief, considers accurate. You should make your own enquiries about any investments and we strongly suggest you seek advice before acting upon any recommendation. Kalkine Pty Ltd has made every effort to ensure the reliability of information contained in its newsletters and websites. All information represents our views at the date of publication and may change without notice. To the extent permitted by law, Kalkine Pty Ltd excludes all liability for any loss or damage arising from the use of this website and any information published (including any indirect or consequential loss, any data loss or data corruption). If the law prohibits this exclusion, Kalkine Pty Ltd hereby limits its liability, to the extent permitted by law to the resupply of services. There may be a product disclosure statement or other offer document for the securities and financial products we write about in Kalkine Reports. You should obtain a copy of the product disclosure statement or offer document before making any decision about whether to acquire the security or product. The link to our Terms & Conditions has been provided please go through them and also have a read of the Financial Services Guide. On the date of publishing this report (mentioned on the website), employees and/or associates of Kalkine Pty Ltd do not hold positions in any of the stocks covered on the website. These stocks can change any time and readers of the reports should not consider these stocks as advice or recommendations.
 AU
AU

 Please wait processing your request...