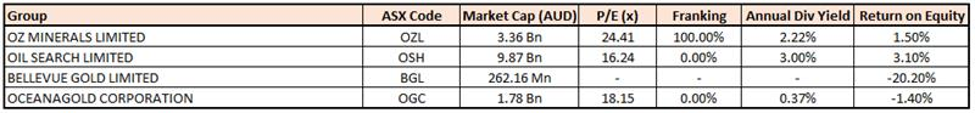
Stock’s Details
OZ Minerals Limited
Mining Production Stood at Upper Band of FY19 Guidance:OZ Minerals Limited (ASX: OZL) is an Australia based modern mining company that specialises in copper and gold exploration. On 7th February, the company informed on its 70:30joint venture with Cassini Resources Limited on the West Musgrave copper nickel project. The company is seeking the review and approval of the Pre-Feasibility study for the project upon consideration by the Board.
FY19 Business Highlights for the Period ended 31 December 2019: OZL declared its FY19 operational highlights wherein, the company reported revenue of $1,107 million along with a cash balance of $134 million. The company reported an increase in trade payables of $36 million, on account of the timing of payments and accruals. The company reported a reduction in the net ore inventory of $30 million following open-pit stockpile processing. The business reported contained copper production of 109,289 tonnes and contained gold production of 128,874 oz during FY19.
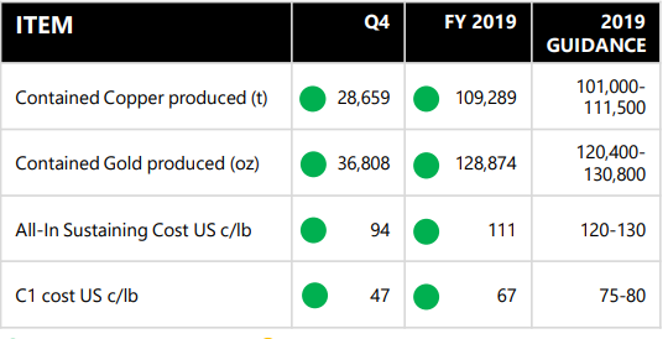
FY19 Production Highlights (Source: Company Reports)
Guidance:For FY20, the company is focusing on Carrapateena ramp-up, Prominent Hill operating performance and progressing the growth pipeline. The company is also planning to invest in Carrapateena in the coming years.
Valuation Methodology: Price to Cash Flow Multiple Approach
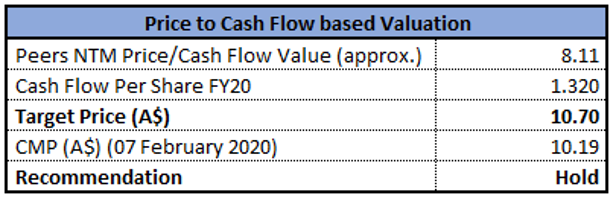
Price to Cash Flow based Valuation(Source: Thomson Reuters)
Note: All forecasted figures and peers have been taken from Thomson Reuters, NTM-Next Twelve Months
Stock Recommendation:The stock of OZL is quoting at $10.190 with a market capitalisation of $3.36 billion. The stock is trading at the upper band of its 52-week trading range of $8.470 to $11.720. The stock has delivered positive returns of 11.17% and 2.58% in the last six-month and one year, respectively. The business delivered itsCopper and gold production at the upper end of FY19 guidance. The business reported a continuation of drilling activities on Antas near mine prospects and holes completed at Azevedo West and Capivara prospects. Considering the current trading levels, and business prospects, we have valued the stock using Price to Cash Flow based relative valuation method. For the purpose, we have taken peers like IGO Ltd (ASX: IGO), Western Areas Ltd (ASX: WSA), Evolution Mining Ltd (ASX: EVN), etc., and arrived at a target price of single-digit upside (in % terms). Hence, we recommend a “Hold” rating on the stock at the current market price of $10.190 per share, down 1.546% on 7th February 2020.
Oil Search Limited
Q4FY19 Revenue Grew by 24% on y-o-y basis:Oil Search Limited (ASX: OSH) operates in exploration, development and production of oil and gas resources, with 98% of the Company’s assets in Papua New Guinea.
Drilling Report for January 2020:OSH reported its drilling updates for its three wells – (1) Gobe Footwall 1 / ST1 located at PDL 4, PNG, (2) Mitquq 1 located at Pikka East, Alaska North Slope, and (3) Stirrup 1 at Horseshoe Block, Alaska North Slope. For its Gobe Footwall 1 / ST1 well, the objective is to test a footwall structure west of the Gobe Main field while as per the forward plan, the company will plug and abandon the well. For its Mitquq 1 well, the company has set an objective for the exploration of Cretaceous Brookian Sandstone (Nanushuk) and Alpine C Sandstone. Last but not the least, the company has a forward plan to run and cement surface hole casing before drilling ahead to the primary objective, the Nanushuk reservoir for its Stirrup 1 well.
Key Business Highlights for Q4FY19: OSH came up with its quarterly highlights, wherein the company reported total production of 7.01 mmboe, up 3% q-o-q, while total sales stood at 7.92 mmboe, up 22% q-o-q. The business reported total revenue of US$446.7 million, representing a growth of 24% on q-o-q basis. Revenue growth was driven by the recovery in production, timing of shipments and higher realised oil and condensate prices.
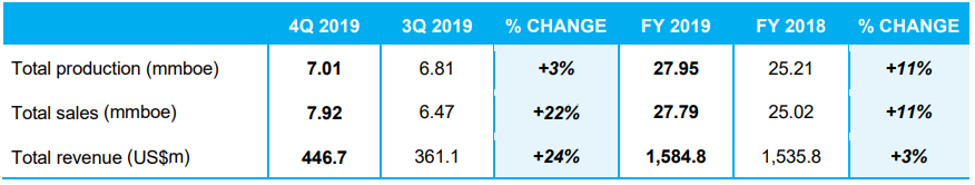
Q4FY19 Operational Highlights (Source: Company Reports)
Guidance:For FY19, the business expects unit production costs within the range of US$12.00/boe to US$13.00/boe. The company expects net financing charges within the range of US$225 million to US$235 million due to PNG LNG Project borrowing costs. Refer to the below image for the guidance provided for FY20.
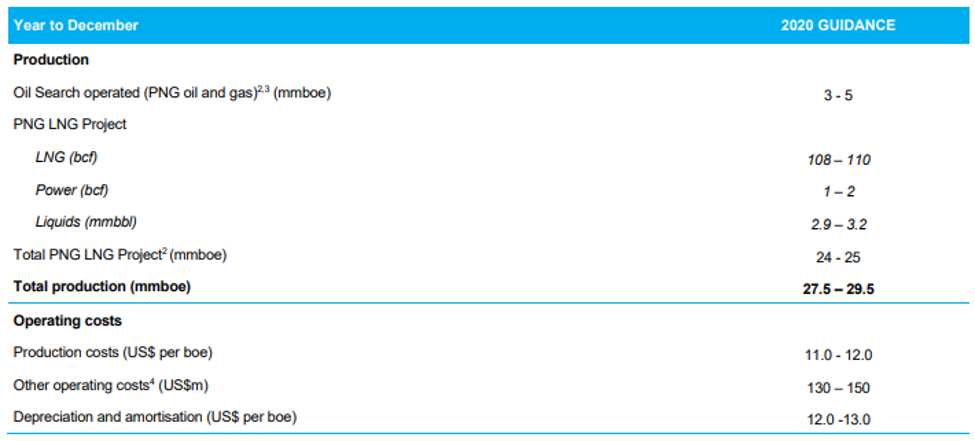
FY20 Guidance (Source: Company Reports)
Valuation Methodology: Enterprise Value (EV) to Sales Multiple Approach
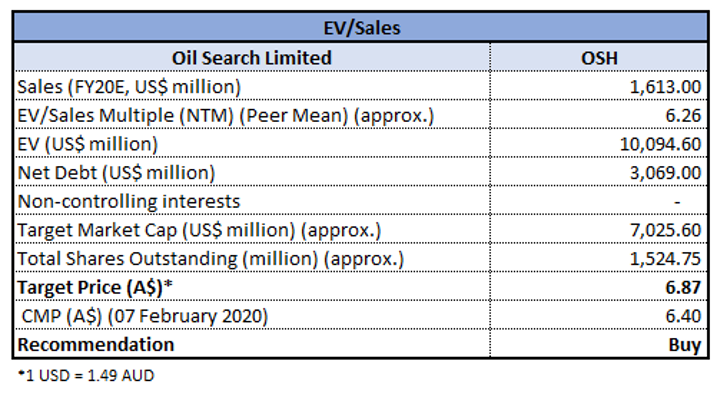
EV/Sales Based Valuation (Source: Thomson Reuters)
Note: All forecasted figures and peers have been taken from Thomson Reuters, NTM-Next Twelve Months
Stock Recommendation:The stock of OSH is trading at $6.40 with a market capitalisation of $9.87 billion. The stock is trading at the lower band of its 52-week trading range of $6.30 and $8.46. The stock has corrected by 12.8% and 6.5% in the last three months and six months, respectively. The company reported strong revenue growth, aided by higher production and the timing of shipments.We have valued the stock using EV/Sales based relative valuation method. For the purpose, we have taken peers like Woodside Petroleum Ltd (ASX: WPL), Beach Energy Ltd (ASX: BPT), Senex Energy Ltd (ASX: SYX), etc., and arrived at a target price, which is offering an upside of higher single-digit (in percentage terms). Hence, considering the decent growth in revenue, guidance for FY20 and valuation, we give a “Buy” recommendation on the stock at the current market price of $6.40 per share, down 1.082% as on 7th February 2020.
Bellevue Gold Limited
Commencement Studies on the Bellevue Gold Project: Bellevue Gold Limited (ASX: BGL) is engaged in the exploration of Gold from its Bellevue Gold Project, situated in Western Australia. On 7th February 2020, the company informed that Bank of Nova Scotia and its associates have increased the undiluted voting power from 12.35% to 13.71%.
Quarterly Cash Flow Highlights for the Period ended 31st December 2019: BGL reported its quarterly cash flow highlights, wherein, the company reported payments for exploration & evaluation at $10.874 million, while net cash used in operating activities stood at $11.678 million. The company reported net cash used in investing activities at $0.173 million. The company reported its cash and cash equivalents at end of the quarter at $20.711 million.
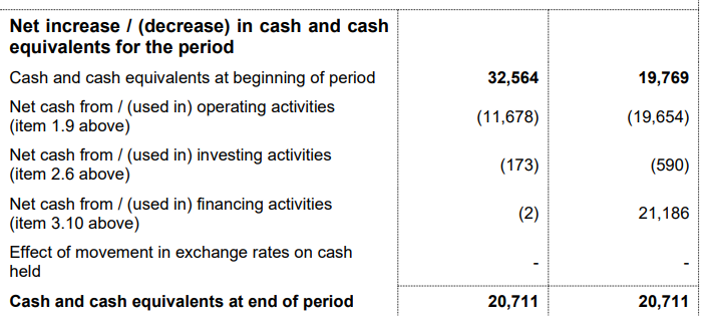
Q3FY20 Cash Flow Highlights (Source: Company reports)
Guidance: The company reported estimated cash outflows for Q3FY20, wherein it expects exploration and evaluation expense to be ~$9.343 million. Staff costs and administrative expenses are expected to be ~$0.254 million and ~$0.411 million, respectively. The business is advancing towards production with eight drill rigs focusing on the conversion to the indicated category for Q2FY20. The company has also commenced its economic studies on the Bellevue Gold Project.
Valuation Methodology: Price to Book Multiple Approach
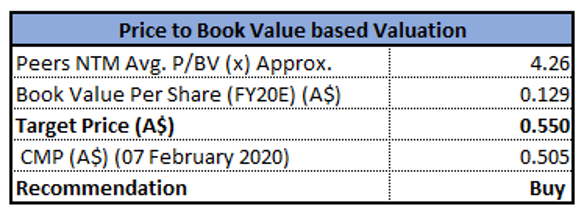
Price to Book Value based Valuation(Source: Thomson Reuters)
Note: All forecasted figures and peers have been taken from Thomson Reuters, NTM-Next Twelve Mont
Stock Recommendation:The stock of BGL is quoting at $0.505 with a market capitalisation of $262.16 million. The stock is trading at the lower band of its 52-week trading range of $0.430 to $0.735. In the coming years, the business willidentify possible early cash positive production scenarios from mineralisation beneath existing open pits and resources adjacent to the Bellevue decline. Considering the current trading levels and business prospects, we have valued the stock using Price to Book based relative valuation method and arrived at a target price of higher single-digit upside (in % terms). Hence, we recommend a “Buy” rating on the stock at the current market price of $0.505 per share, up 9.783% on 7th February 2020, as gold stocks rose on demand for safe haven.
Oceanagold Corporation
Annual Gold Production Stood at 10,255 tonnes: Oceanagold Corporation (ASX: OGC) is a mid-tier, multinational gold exploration company and has presence across the Philippines, New Zealand and the United States.
Key Business Highlights for the Period ended 31 December 2019: OGC came up with its operational highlights, wherein it reported a yearly production of 470,601 ounces of gold and fourth quarter production of 108,151 ounces. Annual copper production stood at 10,255 tonnes, that stood in line with revised FY19 production guidance of 10,000 to 11,000 tonnes. The business reported cash costs of $733 per ounce sold for FY19, with cost of $757 per ounce reported for the in the fourth quarter. The business continued to advance Martha Underground with ~830 metres of development and construction of the raise bore between the 800-RL and 920-RL drives completed in the fourth quarter.
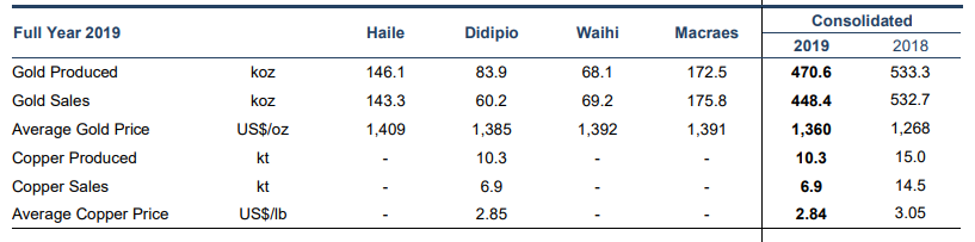
FY19 Operational Highlights (Source: Company Reports)
Valuation Methodology: Price to Earnings Multiple Approach
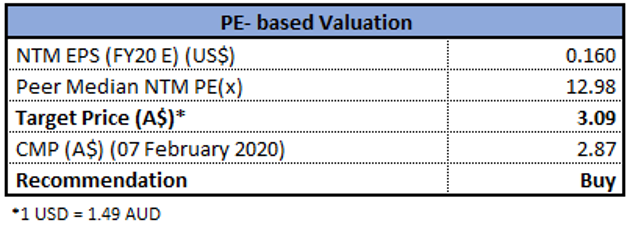
Price to Earnings based Valuation(Source: Thomson Reuters)
Note: All forecasted figures and peers have been taken from Thomson Reuters, NTM-Next Twelve Months
Stock Recommendation: The stock of OGC is quoting at $2.87 with a market capitalisation of $1.78 billion. The stock is trading at the lower band of its 52-week trading range of $2.49 to $4.93. The company is focusing on resolving the suspension of Didipio, executing at its operations and the timely delivery of key projects.The company is progressing and arranging the robust project pipeline across New Zealand and North America to deliver strong economic returns.Considering the current trading levels and business prospects, we have valued the stock using Price to Earnings based relative valuation method. For the purpose, we have taken peers like Northern Star Resources Ltd (ASX: NST), Evolution Mining Ltd (ASX: EVN), Newcrest Mining Ltd (ASX: NCM) etc., and arrived at a target price of higher single-digit upside (in % terms). Hence, we recommend a “Buy” rating on the stock at the current market price of $2.87 per share, up 0.35% on 07 February 2020.
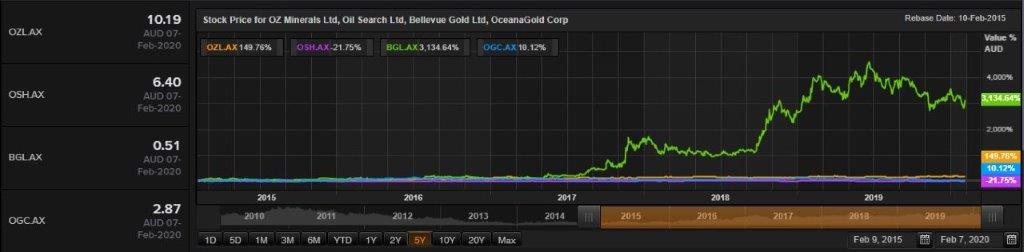
Comparative Price Chart (Source: Thomson Reuters)
Disclaimer
The advice given by Kalkine Pty Ltd and provided on this website is general information only and it does not take into account your investment objectives, financial situation or needs. You should therefore consider whether the advice is appropriate to your investment objectives, financial situation and needs before acting upon it. You should seek advice from a financial adviser, stockbroker or other professional (including taxation and legal advice) as necessary before acting on any advice. Not all investments are appropriate for all people. Kalkine.com.au and associated pages are published by Kalkine Pty Ltd ABN 34 154 808 312 (Australian Financial Services License Number 425376). The information on this website has been prepared from a wide variety of sources, which Kalkine Pty Ltd, to the best of its knowledge and belief, considers accurate. You should make your own enquiries about any investments and we strongly suggest you seek advice before acting upon any recommendation. Kalkine Pty Ltd has made every effort to ensure the reliability of information contained in its newsletters and websites. All information represents our views at the date of publication and may change without notice. To the extent permitted by law, Kalkine Pty Ltd excludes all liability for any loss or damage arising from the use of this website and any information published (including any indirect or consequential loss, any data loss or data corruption). If the law prohibits this exclusion, Kalkine Pty Ltd hereby limits its liability, to the extent permitted by law to the resupply of services. There may be a product disclosure statement or other offer document for the securities and financial products we write about in Kalkine Reports. You should obtain a copy of the product disclosure statement or offer document before making any decision about whether to acquire the security or product. The link to our Terms & Conditions has been provided please go through them and also have a read of the Financial Services Guide. On the date of publishing this report (mentioned on the website), employees and/or associates of Kalkine Pty Ltd do not hold positions in any of the stocks covered on the website. These stocks can change any time and readers of the reports should not consider these stocks as advice or recommendations.
 AU
AU

 Please wait processing your request...