.png)
Stocks’ Details
Rea Group Ltd
Large base of property audience remains the key growth driver: Rea Group Ltd (ASX: REA) stated in its recent release that Tracey Fellows will step down of the group from the role of CEO in January 2019 but will stay on Board as she is moving to take new role i.e. President of Global Digital Real Estate for News Corp. In the meantime, she will support the appointment of her replacement and the transition of leadership. For the quarter ended 30 September 2018, the topline grew by 17% on PCP to reach at $221.90 Mn. This growth was on account of the constant growth in the Australian Residential business and the recent inclusion of “Hometrack Australia Business”. Moreover, there was a full quarter contribution to the revenues from the Smartline Business as compared to the two months of the first quarter corresponding to the last year. Further, the underlying EBITDA came in at $130.90 Mn, up by 23% on PCP. This was driven by the double-digit growth achieved in the Developer as well as commercial business partially offset by the volume contraction seen in their new apartment construction projects. The double-digit growth was on the back of better product mix along with deeper penetration in the Commercial business. In our view, the company will be able to expand its margin on the back of cost optimization strategy by reduction administrative and other operating cost.
Hence, we expect the rate of revenue growth to exceed the rate of operating cost growth for the full year going forward.
.png)
Revenue and EBITDA Historical Trend (Source: Company Reports)
From the analysis standpoint, the company seems to be growing at a better pace considering its pre-tax margins of 46.8% vis-a-vis the industry median of 41.9%. Meanwhile, the stock price has risen by a modest 5.67% over the past one month as on November 30, 2018. Hence considering market leading position and the superior pre-tax margins, we maintain our “Hold” recommendation on the stock at the current market price of $77.360 as it is trading at lower range.
Going further, the company expects the conditions to remain tough in near term as the listings may remain weaker till NSW elections in March 2019; alsothe forecasts for the new apartment’s listings continue to show the decline.
CSL Limited
Growing R&D investment– key catalyst: CSL Limited (ASX: CSL) has stated that its operating revenue has surged by 11% on a Y-o-Y basis to reach at US$ 7.9 Bn. This was on the back of revenue growth of 16% in its Seqirus segment as compared to prior year. It was mainly driven by the strong growth of the influenza vaccine in the US. Moreover, the major growth driver was the remodelling of the product mix which led to a cell-based quadrivalent and adjuvanted products. As a result, NPAT came in at US$1.7 Bn in FY18, exhibiting strong growth of 29% on a Y-o-Y basis. This was on account of the contribution from the CSL Behring underpinning phenomenal contributions in revenue from the Immunoglobulins on account of the strong demand across the globe.
Further, the company’s investment into R&D has increased from $370 Mn in 2012 to $702 Mn in 2018 resulting into a 90% rise. Hence, we expect that it would lay the foundation for the growth in the upcoming years.
Moving forward, the company has reiterated its guidance of NPAT in the range of ~US$1,880-1,950 Mn. Further, the company expects continued strong demand and margin growth for the plasma and recombinant products. Moreover, the company will continue to invest heavily on its capital investments which would be around US$1.2-1.3 Bn and the R&D expenses would increase by ~US$150-$200 Mn post commencement of CSL112 Phase 3, to support further growth.
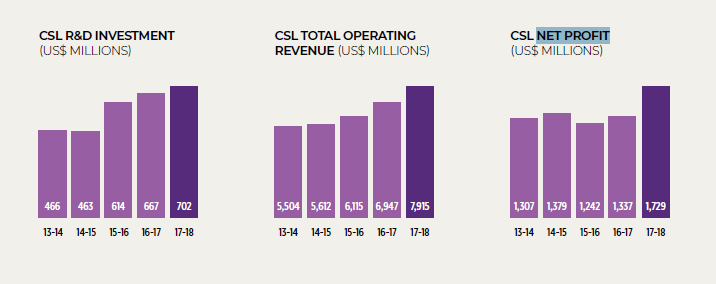
Financial Performance Metric (Source: Company Reports)
On the analysis front, the company’s Return on research capital (RORC) stands at 6.81 times for the current year vis-à-vis 5.87 times for the previous reporting period. This shows a rise of 15.85% on a Y-o-Y basis which signifies that return from expanding upon the major R&D projects are yielding better returns and are proving to be productive enough. Further, the growth in earnings are considered to be very critical in the valuation of the Biotech companies, considering this, the company has a PEG ratio of 2.405x which is more than 1 and hence the stock can be considered to be expensive enough at this point of time given the growth potential it has got. The stock price has fallen by a modest 5.16% over the past six months as on November 30, 2018. By considering the fact that the stock has priced in all the positives and is trading at a premium, thus, we have wait and watch view on the stock at the current market price of $183.49.
Westpac Banking Corporation
Improving asset quality: Westpac Banking Corporation (ASX: WBC) has via a recent release stated that a fully franked dividend of $0.94 shall be distributed to the common shareholders for the period pf six months. The record date for the distribution was November 14, 2018 and it will be payable on December 20, 2018.
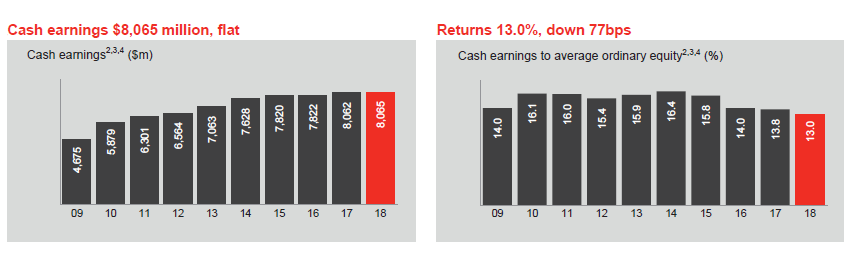
The bank’s pillar three report provided disclosures w.r.t the Australian Prudential Regulatory Authority (APRA) implementation of BASEL III Norms whereby it’s CET1 came in at 10.63% as at 30 September 2018. This was an improvement of 13 bps from the levels at 31 March 2018. The improvement in the capitalization was on account of the increase in cash earnings by 90Bps in the second half of 2018 & conversion of preference shares to common equity. Moreover, the ordinary RWA (Risk-weighted assets) fell slightly. Further, the firm has had a mixed FY 2018 performance, cash earnings for the year came in at $ 8,065Mn, up by 3 Mn on a YOY basis. This was due to the incurrence of litigation and regulatory costs associated with the implementation of the recommendation of the Royal Commission. On the analysis front, the company has Net Interest margins of 2.13% as compared to the 1.94% which is the Industry median. This shows that the bank has invested its funds more effectively as compared to the industry as a whole.
Cash Earnings and RoE (Source: Company Reports)
Meanwhile, the stock price has fallen by 6.65% over the past six months as on November 30, 2018, thus posing an attractive opportunity for the investors to acquire the stock at these levels. Hence considering the Improved asset quality across segments in accordance with the APRA regulations, we maintain our “Buy” recommendation on the stock at the current market price of $26.25.
Ramsay Health care Ltd
Brownfield projects to drive future growth- a growth catalyst: Ramsay Health care Ltd (ASX: RHC) saw its EBIT surging by 6.8% on a Y-o-Y basis, to stand at $1.008 Bn for FY 2018. This was on account of the admissions growth registered above the industry growth rate. However, this was partially offset by the affordability concerns and the negative focus on the private health insurance. In the future, the company is committed to investing in the brownfield projects to meet the ever-growing demand generated as a result of an increasingly ageing population. These investments are expected to contribute in a big manner to the FY 2019 earnings. The company aims to achieve an EPS growth of up to 2% for FY 2019. The firm expects the tough times to continue across its all key regions thus expecting a flat FY 2019 in terms of performance.
.png)
FY18’s Brownfield Project (Source: Company Reports)
From the analysis standpoint, the firm’s EBITDA margins for the FY 2018 came in at 13.5% which is at par with the Industry median, also the pre-tax margin is at a premium with respect to the concerned industry signifying that it’s a growth stock. On the valuation front, the company is trading at an EV / Sales ratio of 1.5 times, which is at a relative discount with the healthcare providers and services median of 1.9 times, hence from the sales generation aspect the stock seems to have potential upside at current valuations. If we look at the past six month’s performance, the stock is down by 11.39% as on November 30, 2018 and is trading at decent juncture. However, considering strong Australian demand and strong margins, we maintain our “Buy” recommendation on the stock at the current market price of $54.76.
.PNG)
Stock Price Comparative Chart (Source: Thomson Reuters)
Disclaimer
The advice given by Kalkine Pty Ltd and provided on this website is general information only and it does not take into account your investment objectives, financial situation or needs. You should therefore consider whether the advice is appropriate to your investment objectives, financial situation and needs before acting upon it. You should seek advice from a financial adviser, stockbroker or other professional (including taxation and legal advice) as necessary before acting on any advice. Not all investments are appropriate for all people. Kalkine.com.au and associated pages are published by Kalkine Pty Ltd ABN 34 154 808 312 (Australian Financial Services License Number 425376). The information on this website has been prepared from a wide variety of sources, which Kalkine Pty Ltd, to the best of its knowledge and belief, considers accurate. You should make your own enquiries about any investments and we strongly suggest you seek advice before acting upon any recommendation. Kalkine Pty Ltd has made every effort to ensure the reliability of information contained in its newsletters and websites. All information represents our views at the date of publication and may change without notice. To the extent permitted by law, Kalkine Pty Ltd excludes all liability for any loss or damage arising from the use of this website and any information published (including any indirect or consequential loss, any data loss or data corruption). If the law prohibits this exclusion, Kalkine Pty Ltd hereby limits its liability, to the extent permitted by law to the resupply of services. There may be a product disclosure statement or other offer document for the securities and financial products we write about in Kalkine Reports. You should obtain a copy of the product disclosure statement or offer document before making any decision about whether to acquire the security or product. The link to our Terms & Conditions has been provided please go through them and also have a read of the Financial Services Guide. On the date of publishing this report (mentioned on the website), employees and/or associates of Kalkine Pty Ltd do not hold positions in any of the stocks covered on the website. These stocks can change any time and readers of the reports should not consider these stocks as advice or recommendations.
 AU
AU

 Please wait processing your request...